Volume 2013, Article ID 695496,9pages http://dx.doi.org/10.1155/2013/695496
Research Article
Anthropometric Changes in the Brazilian Cohort of
Older Adults: SABE Survey (Health, Well-Being, and Aging)
Manuela Ferreira de Almeida,
1Maria de Fátima Nunes Marucci,
1Luís Alberto Gobbo,
2Luciana Silva Ferreira,
3Daiana Aparecida Quintiliano Scarpelli Dourado,
1Yeda Aparecida de Oliveira Duarte,
4and Maria Lucia Lebrão
51Department of Nutrition, School of Public Health, University of S˜ao Paulo (USP), Doutor Arnaldo Avenue 715, 2nd Floor,
S˜ao Paulo, SP 01216-901, Brazil
2Department of Physical Education, Center of Science and Technology, S˜ao Paulo State University (UNESP),
Presidente Prudente, SP 19060-900, Brazil
3School of Nutrition, Federal University of the State of Rio de Janeiro (UNIRIO), Rio de Janeiro, RJ 22290-210, Brazil
1School of Nursing, University of S˜ao Paulo (USP), S˜ao Paulo, SP 05103-000, Brazil
5Department of Epidemiology, School of Public Health, University of S˜ao Paulo (USP), S˜ao Paulo, SP 01216-901, Brazil
Correspondence should be addressed to Maria de F´atima Nunes Marucci; mmarucci@usp.br
Received 30 November 2012; Revised 6 March 2013; Accepted 25 March 2013
Academic Editor: Analiza M. Silva
Copyright © 2013 Manuela Ferreira de Almeida et al. This is an open access article distributed under the Creative Commons Attribution License, which permits unrestricted use, distribution, and reproduction in any medium, provided the original work is properly cited.
The aim of the present study was to analyze the anthropometric changes in a home-based cohort of Brazilian older adults who participated in the SABE Survey, conducted in 2000 and 2006. A total of 1030 men and women were examined by age group: 60– 69, 70–79, and≥80 years. This representative sample consists of the survivors of the 2000 cohort. The following anthropometric variables were assessed: body mass, arm muscle, waist and calf circumferences, triceps skinfold thickness, body mass index, waist-hip ratio, and arm muscle area according to mean values and percentile distribution. Except for body mass and body mass index, a significant difference(𝑃 < 0.05)was observed among the assessed anthropometric variables during the follow-up period. The older adults≥80 years presented the lowest values. The reduction in the mean values of triceps skinfold thickness was greater (30%) than that of waist circumference (9%) and was more pronounced in women (21%) than in men (9%). Arm muscle circumference and area reduced by 8% and 19%, respectively, in men and 1% and 3%, correspondingly, in women. Our findings revealed reductions in the mean values for all anthropometric variables in the follow-up period from 2000 to 2006 among older adults.
1. Introduction
The population aging and its socioeconomic and biopsy-chosocial implications are a widely discussed topic globally, including in Brazil, because this group is more vulnerable to the development of noncommunicable diseases such as diabetes mellitus, hypertension, dyslipidemia, cardiovascular disease, and cancer. These diseases, associated with changes of the aging process, can compromise individual health and
affect nutritional status [1]. For these reasons, this issue
arouses the interest of researchers, as additional knowledge about the aging process and its impact on the Brazilian health
system is required [2].
The aging process is associated with significant changes in body composition, including quantitative and qualitative progressive loss of skeletal muscle mass and body fat redis-tribution, with greater accumulation in the intra-abdominal region compared to the subcutaneous abdominal area,
inde-pendent of disease development [3,4]. The redistribution of
adipose tissue mass and the relative decline of skeletal muscle mass can occur even when there are no significant changes
in body mass index (BMI) [5]. Several longitudinal studies
suggest that fat mass increases with age in older men, but not in older women, and that lean mass decreases with age in both genders; however, there is still controversy in the scientific
For understanding the body composition changes in community-dwelling older adults, longitudinal studies are
needed [5, 6]. In Brazil, studies of this nature are scarce.
SABE Survey aimed to verify the changes that occurred in the process of getting old and the life and health conditions
of older adults in Brazil [7]. The objective of this study was
to analyze the anthropometric changes, by gender and age group, in Brazilian older adults.
2. Methods
2.1. Participants and Study Protocol. The data came from the SABE Survey (Health, Well-being, and Aging), which is a longitudinal study that began in 2000, involving a
probabilistic sample of older adults (≥60 y), both genders,
home-based, in the city of S˜ao Paulo (𝑛 = 2, 143), Brazil [8,9].
In 2006, the study was conducted with 1,115 participants from
baseline that were interviewed again [7].
Sampling procedures in SABE study have been reported elsewhere. Briefly, the individuals were selected at random from the population count conducted in Brazil, in 1996, by the Brazilian Institute of Geography and Statistics (IBGE). The sampling process was conducted in two stages: the first, a probabilistic sample of 1,568 individuals, and the second, a further 575 individuals, to compensate the higher rate of male mortality and lower population density of the group
≥75 y, resulting in 2000, in a sample of 2,143 individuals
[8].
The data collection was done by trained interviewers, using a specific questionnaire proposed by the Pan American Health Organization (PAHO), translated and adapted for use in Brazil. Each questionnaire was reviewed by a specialized
technical group [8].
During the followup (2000 to 2006), there was a
reduc-tion in the number of participants from 2,143 to 1,115 [7]. The
final sample for this study consisted of 1,030 subjects (92.4%
of the original 1,115), as shown inFigure 1. For this study, the
inclusion criterion was the existence of all anthropometric data for the description and proposed analysis.
The SABE Survey was approved by the Ethics in Research Committee of the Faculty of Public Health of the University of S˜ao Paulo and National Committee for Ethics in Research (CONEP) and all participants gave written consent before participation.
2.2. Measurements. The following anthropometric variables were assessed: body mass (BM), arm circumference (AC), waist circumference (WC), calf circumference (CC), triceps skinfold thickness (TSF), body mass index (BMI), arm muscle circumference (AMC), arm muscle area (AMA), and waist-hip ratio (WHR), by gender and age group (60–79, 70–
79, and ≥80 y). BM represents the total body mass; AC is
predictive of AMC and AMA; TSF is used as an indicator of the body fatness; WC and WHR represented the visceral fat, an important metabolic risk factor; AMC and AMA are indicators of the skeletal muscle mass; and BMI indicates the nutritional status.
The measurement techniques adopted were those given
by Frisancho [10], the collection was in triplicate, and the
SABE 2000
SABE 2006
177 refusals
139 cases of nonlocalization
51 cases of change of address 649 deaths
12 cases of institutionalization
Final sample
85 incomplete anthropometric data Losses in the period (𝑁 = 2143)
(𝑁 = 1115)
(𝑁 = 1030)
Figure 1: Final sample of older adults according to changes that occurred in the period, SABE Survey, 2000–2006.
mean values of these data for BM, AC, WC, CC, and TSF were used for the analysis. In both periods a total of six SABE Survey certified technicians performed the anthropometric measurements according to SABE standardized protocol. All the previous measurements were undertaken on individuals capable of walking; however, bedridden subjects had only their AC, CC, and TSF measured.
Body mass was measured on portable scales (Seca, Germany), with capacity of 150 kg and sensitivity of 0.1 kg; height (H), with an anthropometer (Harpenden, England), with maximum height of 2.0 m; arm, calf, and waist cir-cumferences, with an inelastic tape (1.5 m in length); and the triceps skinfold thickness with a Lange caliper, at a
constant pressure of 10 g/mm2, capacity of 67 mm graduated
in mm. BMI was calculated as the ratio between the values of
body mass (kg) and squared height (m) (BM/H2) and WHR
as the ratio of waist circumference (cm) to hip circumfer-ence (cm), whereas the arm muscle circumfercircumfer-ence and the arm muscle area were calculated using the following equa-tions:
(i) Gurney and Jelliffe, 1973 [11]:
(ii) Heymsfield et al. (1982) [12], by gender: men:
AMA(cm2)
= {AC(cm) − [𝜋 ∗ (4𝜋TSF(cm) ÷ 10)]}2 − 10cm2, (2)
women:
AMA(cm2)
= {AC(cm) − [𝜋 ∗ (4𝜋TSF (cm) ÷ 10)]}2 − 6.5cm2, (3)
where AC is arm circumference, TSF is triceps skinfold
thick-ness, and 𝜋= 3.1416.
2.3. Statistical Analysis. Considering the type of study (sur-vey-type [svy] command) and the complexity of the sample, statistical analysis was performed. The relative frequency corresponds to the weighted frequency in accordance with the weight of the sample of the Brazilian census office. To ana-lyze the anthropometric changes, by gender and age group, which occurred from 2000 to 2006, a confidence interval
(CI) of 95%, significance level <5%, and the Wald test
were adopted. Additionally, the relative variations (%) in the follow-up years, between age groups, gender, and year were observed. Means and standard deviations were expressed in percentiles (P5, P10, P15, P25, P50, P75, P90, and P95) and the Stata/SE 10.0 for Windows program was used for the cal-culations.
3. Results
The mean anthropometric values presented a reduction with advancing age in both genders and age groups. Regarding mean values of calf and waist circumference, waist-hip ratio, and triceps skinfold thickness, a significant difference was
only observed for women (𝑃 < 0.05) whereas for arm muscle
circumferences and arm muscle area, differences were found between genders.
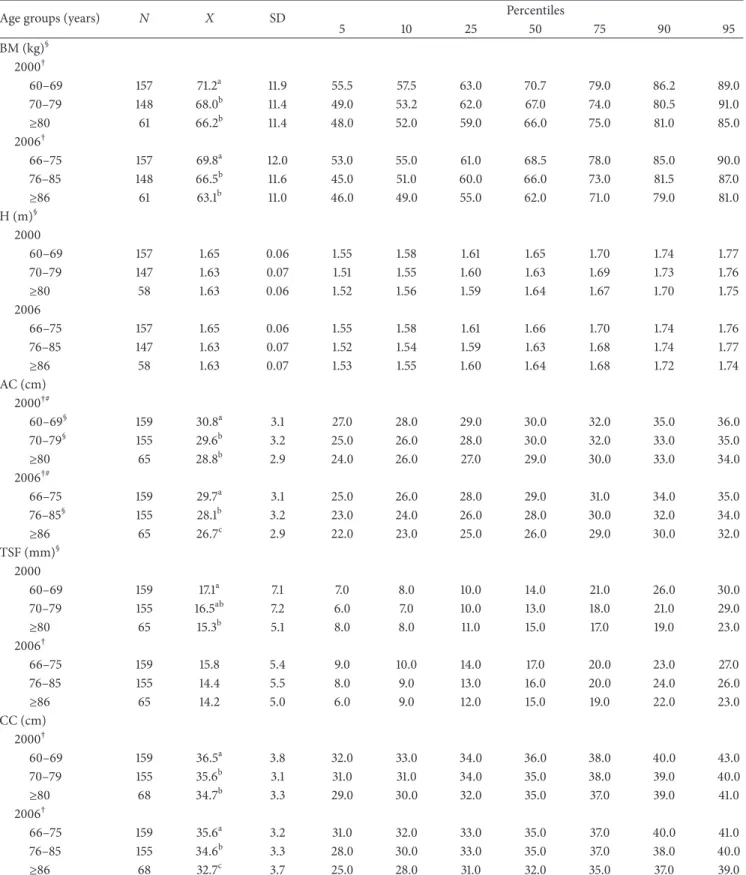
As regards BM, a significant decrease in the mean values was observed by genders and age group. The loss of weight
was more pronounced in the group≥80 years, in both women
(1.5%, 4.0%, and 6.4%) and men (2.0%, 2.2%, and 4.7%)
(Tables1and2).
Regarding BMI, the decrease was similar in both genders, with significant statistical difference between the age groups 60 to 69 and 70 to 79 years. The women had the highest mean
BMI values (Tables3and4).
Concerning arm and calf circumferences, the reduction was significantly greater in women (7% and 5%, resp.) than
in men (5% and 4%, resp.) (Tables1and2). The mean values
of AMC and AMA tend to reduce more in men (8% and 19%) than women (1% and 3%) in all age groups but significant
differences were only found for the group≥80 y (Tables3and
4).
The reduction of the mean values of TSF, WC, and WHR was greater in women (21%, 7% and 4%, resp.) than men (9%, 3% and 1%, resp.), being more pronounced in the age group
≥80 years, with significant difference in females in the
follow-up period (Tables1,2,3, and4).
4. Discussion
This is the first epidemiological, home-based, cohort study conducted on a representative sample of Brazilian aged
people (≥60 y) to report changes in mean anthropometric
values and percentile distribution, by gender and age group. With the process of aging, physical changes occur with a decrease of tissue-level components (subcutaneous adipose
tissue mass, skeletal muscle mass, and bone tissue mass) [13],
as supported by several investigators using whole-body level
measurements [14–20] and observed in this study.
As expected, in all age groups, the mean values of BM were lower among women. The reduction of the mean values of BM was seen to accompany advancing age in both genders,
being more pronounced between older old adults (≥80 y, in
2000, and≥86 y, in 2006). These results are similar to those
of other cohort studies of older adults [14–19]. Body mass
change with advancing age is associated with a change in body composition that occurs with aging, especially in
fat-free mass [21]. The mean BM value (65 kg) was observed to
be greater in Brazilian aged people than in Chinese≥70 years
[14], but lower than that of Europeans≥65 years [15–18] and
Americans≥75 years [19].
Although the loss of weight is common in the older adults, especially in the oldest of the old, care is necessary in the interpretation of this progressive loss of body weight which may result in undernutrition being often ignored by
health professionals [22]. Studies show that older adults
mal-nourished are at greater risk of developing complications and diseases and that the likelihood of hospitalization and death
is increased [22,23].
The mean values of the BMI also presented a reduction, in both genders and all age groups, with advancing age, as
noted in other cohort studies [14–17]. They are greater in
Brazilian older adults than in those of the other Latin Amer-ican countries which participated in the SABE Survey,
namely, Mexico [24], Chile [25], and Cuba [26], but lower
than in those of the United States [27] and Italy [15].
Low values of BMI are related to respiratory and infec-tious diseases, cancer, depression, worsening of chronic dis-eases, changes in functional capacity, prolonged recovery from illness, and a higher number of hospitalizations, all asso-ciated with increased susceptibility to morbidity and lower
survival rates [28]. Some authors have suggested higher
values of BMI as reference for the older adults so that they
may better face up their health problems [29,30].
A reduction of the anthropometric parameters represent-ing skeletal muscle mass was more pronounced in men, as
occurred in other studies [14–20], and can lead to decreased
strength and physical capacity [31, 32], characterizing the
Table 1: Percentile distribution of anthropometric values of women by age group (SABE Survey, S˜ao Paulo, Brazil, 2000–2006).
Age groups (years) 𝑁 𝑋 SD Percentiles
5 10 25 50 75 90 95
BM(kg)§
2000†
60–69 290 65.3a 11.6 48.5 51.0 57.0 64.0 72.0 80.0 86.0
70–79 244 63.9a 13.6 44.0 46.5 54.0 62.5 73.5 81.5 88.0
≥80 78 59.3b 12.3 37.0 43.0 50.0 60.0 67.0 74.0 80.5
2006†
66–75 290 64.3a 12.2 46.0 50.0 56.0 63.0 71.5 81.0 87.0
76–85 244 61.3b 14.0 42.0 45.0 50.0 60.0 71.0 81.0 87.0
≥86 78 55.5c 11.5 36.0 42.0 48.0 55.0 63.0 72.0 76.0
H (m)§
2000†
60–69 291 1.52a 0.06 1.42 1.44 1.48 1.53 1.57 1.61 1.64
70–79 243 1.51b 0.06 1.41 1.43 1.47 1.52 1.56 1.59 1.62
≥80 75 1.49b 0.07 1.38 1.38 1.45 1.50 1.55 1.59 1.62
2006†
66–75 291 1.52a 0.06 1.42 1.44 1.48 1.53 1.57 1.61 1.64
76–85 243 1.51a 0.06 1.42 1.43 1.47 1.51 1.56 1.61 1.62
≥86 75 1.49b 0.06 1.37 1.39 1.44 1.50 1.53 1.57 1.61
AC (cm) 2000#
60–69§ 294 32.1a 3.61 27.0 28.0 29.0 32.0 35.0 36.0 38.0
70–79§ 262 31.4a 4.69 24.0 26.0 29.0 31.0 34.0 37.0 40.0
≥80 95 29.0b 3.96 22.0 23.0 27.0 29.0 32.0 34.0 35.0
2006†#
66–75 294 30.1a 3.92 25.0 26.0 28.0 30.0 33.0 36.0 38.0
76–85§ 262 29.4b 4.72 23.0 24.0 26.0 29.0 32.0 36.0 38.0
≥86 95 26.3c 3.74 20.0 21.0 24.0 27.0 29.0 31.0 31.0
TSF (mm)§ 2000†#
60–69 294 28.3a 7.04 18.0 20.0 23.0 28.0 33.0 37.0 40.0
70–79 260 27.3a 9.41 12.0 14.0 21.0 27.0 34.0 40.0 42.0
≥80 93 22.3b 7.67 10.0 11.0 17.0 23.0 27.0 31.0 34.0
2006†#
66–75 294 22.6a 5.73 14.0 16.0 19.0 22.0 26.0 30.0 32.0
76–85 260 20.9b 6.69 11.0 12.0 16.0 20.0 25.0 30.0 33.0
≥86 93 17.8c 5.14 10.0 10.0 15.0 18.0 22.0 24.0 25.0
CC (cm) 2000†#
60–69 293 36.6a 3.7 31.0 32.0 34.0 36.0 39.0 41.0 43.0
70–79 261 35.7b 4.0 29.0 30.0 33.0 36.0 39.0 41.0 42.0
≥80 94 33.9c 3.2 28.0 30.0 31.0 34.0 36.0 38.0 39.0
2006†#
66–75 293 35.5a 3.8 30.0 31.0 33.0 35.0 38.0 40.0 42.0
76–85 261 34.1b 4.4 27.0 29.0 32.0 34.0 37.0 39.0 41.0
≥86 94 31.8c 3.9 25.0 26.0 29.0 32.0 34.0 36.0 38.0
BM: body mass; H: height; AC: arm circumference; TSF: triceps skinfold thickness; CC: calf circumference;𝑋: mean values; SD: standard deviation.
†Statistical differences among age groups,𝑃 < 0.05(equal superscript letters: no statistical differences between age groups; different superscript letters: statistical
differences between age groups).
Table 2: Percentile distribution of anthropometric values of men by age group (SABE Survey, S˜ao Paulo, Brazil, 2000–2006).
Age groups (years) 𝑁 𝑋 SD Percentiles
5 10 25 50 75 90 95
BM (kg)§
2000†
60–69 157 71.2a 11.9 55.5 57.5 63.0 70.7 79.0 86.2 89.0
70–79 148 68.0b 11.4 49.0 53.2 62.0 67.0 74.0 80.5 91.0
≥80 61 66.2b 11.4 48.0 52.0 59.0 66.0 75.0 81.0 85.0
2006†
66–75 157 69.8a 12.0 53.0 55.0 61.0 68.5 78.0 85.0 90.0
76–85 148 66.5b 11.6 45.0 51.0 60.0 66.0 73.0 81.5 87.0
≥86 61 63.1b 11.0 46.0 49.0 55.0 62.0 71.0 79.0 81.0
H (m)§
2000
60–69 157 1.65 0.06 1.55 1.58 1.61 1.65 1.70 1.74 1.77
70–79 147 1.63 0.07 1.51 1.55 1.60 1.63 1.69 1.73 1.76
≥80 58 1.63 0.06 1.52 1.56 1.59 1.64 1.67 1.70 1.75
2006
66–75 157 1.65 0.06 1.55 1.58 1.61 1.66 1.70 1.74 1.76
76–85 147 1.63 0.07 1.52 1.54 1.59 1.63 1.68 1.74 1.77
≥86 58 1.63 0.07 1.53 1.55 1.60 1.64 1.68 1.72 1.74
AC (cm) 2000†#
60–69§ 159 30.8a 3.1 27.0 28.0 29.0 30.0 32.0 35.0 36.0
70–79§ 155 29.6b 3.2 25.0 26.0 28.0 30.0 32.0 33.0 35.0
≥80 65 28.8b 2.9 24.0 26.0 27.0 29.0 30.0 33.0 34.0
2006†#
66–75 159 29.7a 3.1 25.0 26.0 28.0 29.0 31.0 34.0 35.0
76–85§ 155 28.1b 3.2 23.0 24.0 26.0 28.0 30.0 32.0 34.0
≥86 65 26.7c 2.9 22.0 23.0 25.0 26.0 29.0 30.0 32.0
TSF (mm)§ 2000
60–69 159 17.1a 7.1 7.0 8.0 10.0 14.0 21.0 26.0 30.0
70–79 155 16.5ab 7.2 6.0 7.0 10.0 13.0 18.0 21.0 29.0
≥80 65 15.3b 5.1 8.0 8.0 11.0 15.0 17.0 19.0 23.0
2006†
66–75 159 15.8 5.4 9.0 10.0 14.0 17.0 20.0 23.0 27.0
76–85 155 14.4 5.5 8.0 9.0 13.0 16.0 20.0 24.0 26.0
≥86 65 14.2 5.0 6.0 9.0 12.0 15.0 19.0 22.0 23.0
CC (cm) 2000†
60–69 159 36.5a 3.8 32.0 33.0 34.0 36.0 38.0 40.0 43.0
70–79 155 35.6b 3.1 31.0 31.0 34.0 35.0 38.0 39.0 40.0
≥80 68 34.7b 3.3 29.0 30.0 32.0 35.0 37.0 39.0 41.0
2006†
66–75 159 35.6a 3.2 31.0 32.0 33.0 35.0 37.0 40.0 41.0
76–85 155 34.6b 3.3 28.0 30.0 33.0 35.0 37.0 38.0 40.0
≥86 68 32.7c 3.7 25.0 28.0 31.0 32.0 35.0 37.0 39.0
BM: body mass; H: height; AC: arm circumference; TSF: triceps skinfold thickness; CC: calf circumference;𝑋: mean values; SD: standard deviation.
†Statistical differences among age groups,𝑃 < 0.05(equal superscript letters: no statistical differences between age groups; different superscript letters: statistical
differences between age groups).
Table 3: Percentile distribution of anthropometric indicators of women by age group (SABE Survey, S˜ao Paulo, Brazil, 2000–2006).
Age groups (years) 𝑁 𝑋 SD Percentiles
5 10 25 50 75 90 95
BMI (kg/m2) 2000†
60–69§ 290 28.0a 4.9 21.2 22.8 24.3 27.1 30.7 35.1 37.3
70–79§ 243 27.9a 5.7 18.9 20.9 23.6 27.8 31.2 35.1 37.1
≥80 75 26.4b 4.9 18.4 19.2 23.5 26.1 30.4 32.4 33.5
2006†
66–75§ 290 27.6a 5.1 20.1 21.2 24.1 26.9 30.6 34.4 36.1
76–85§ 243 26.7a 5.7 18.8 20.0 22.6 26.3 30.3 34.6 36.1
≥86 75 24.8b 4.6 17.5 18.6 21.2 24.7 27.8 32.4 33.6
WC (cm) 2000#
60–69§ 292 94.0 13.0 74.0 78.0 85.0 93.0 102.0 110.0 115.0
70–79 246 95.7 14.4 72.0 77.0 85.0 96.0 106.0 114.0 118.0
≥80 77 93.6 12.6 73.0 74.0 87.0 94.0 102.0 111.0 115.0
2006#
66–75§ 292 89.1 11.6 72.0 74.0 81.0 88.0 97.0 104.0 108.0
76–85 246 89.1 12.6 70.0 73.0 80.0 89.0 97.0 105.0 110.0
≥86§ 77 85.9 12.9 63.0 70.0 77.0 86.0 95.0 105.0 109.0
WHR 2000#
60–69§ 292 0.90 0.08 0.76 0.78 0.83 0.90 0.96 1.00 1.02
70–79§ 244 0.91 0.08 0.79 0.81 0.85 0.91 0.97 1.01 1.04
≥80 77 0.91 0.07 0.80 0.81 0.86 0.91 0.97 1.01 1.02
2006𝑠§#
66–75 292 0.87 0.07 0.75 0.78 0.82 0.86 0.91 0.97 1.00
76–85 244 0.88 0.09 0.78 0.79 0.84 0.87 0.92 0.96 1.00
≥86 77 0.87 0.08 0.75 0.78 0.82 0.87 0.91 0.95 1.03
AMC (cm) 2000†
60–69 294 23.2a 2.7 19.1 20.1 21.3 23.0 24.9 26.2 27.8
70–79 260 22.8ab 2.9 18.7 19.4 20.8 22.7 24.4 26.3 28.1
≥80# 93 22.0b 2.3 17.6 18.7 20.7 22.1 23.8 24.6 25.8
2006†
66–75 294 23.4a 2.9 18.7 19.8 21.3 23.4 25.3 27.3 28.7
76–85 260 22.8a 3.7 17.3 18.6 20.3 22.4 24.8 27.2 30.7
≥86# 93 20.7b 2.7 15.6 16.9 19.1 20.7 22.7 24.2 24.9
AMA (cm2)
2000†§
60–69 294 36.9a 10.8 22.5 25.6 29.7 35.5 42.8 48.1 55.0
70–79 260 35.6a 11.1 21.4 23.6 28.0 34.7 41.1 48.6 56.4
≥80# 93 32.5b 8.0 18.2 21.2 27.5 32.3 38.4 41.7 46.6
2006†
66–75 294 37.8a 11.1 21.4 24.8 29.8 37.1 44.6 52.6 59.1
76–85§ 260 36.0a 14.7 17.4 21.0 26.4 33.4 42.6 52.4 68.6
≥86# 93 28.3b 8.7 12.9 16.3 22.7 27.7 34.6 40.1 42.9
BMI: body mass index; WC: waist circumference; WHR: waist-hip ratio; AMC: arm muscle circumference; AMA: arm muscle area;𝑋: mean values; SD: standard deviation.
†Statistical differences among age groups,𝑃 < 0.05(equal superscript letters: no statistical differences between age groups; different superscript letters: statistical
differences between age groups).
Table 4: Percentile distribution of anthropometric indicators of men by age group (SABE Survey, S˜ao Paulo, Brazil, 2000–2006).
Age groups (years) 𝑁 𝑋 SD Percentiles
5 10 25 50 75 90 95
BMI (kg/m2) 2000†
60–69§ 157 25.9a 3.6 19.8 21.9 23.8 25.8 27.7 30.3 32.1
70–79§ 146 25.3ab 3.8 18.7 20.9 23.0 25.1 27.6 30.1 31.9
≥80 58 24.8b 3.6 19.7 20.1 22.5 24.7 27.1 28.8 30.9
2006†
66–75§ 157 25.4a 3.8 19.0 20.7 23.0 25.1 28.0 29.8 32.5
76–85§ 146 24.7ab 3.9 18.5 19.7 22.4 24.4 27.1 29.6 31.0
≥86 58 23.5b 3.3 18.0 19.8 21.3 23.3 25.6 28.3 30.1
WC (cm) 2000
60–69§ 157 96.8 10.5 81.0 84.0 90.0 96.0 104.0 109.0 112.0
70–79 149 95.2 10.1 76.0 82.0 89.0 95.0 101.0 105.0 113.0
≥80 61 93.8 11.1 77.0 78.0 86.0 94.0 101.0 108.0 110.0
2006
66–75§ 157 93.5 10.6 77.0 80.0 87.0 94.0 100.0 106.0 113.0
76–85 149 91.8 10.8 74.0 77.0 85.0 92.0 99.0 106.0 110.0
≥86§ 61 91.2 9.4 76.0 78.0 84.0 91.0 98.0 103.0 110.0
WHR 2000
60–69§ 157 0.97 0.06 0.88 0.89 0.93 0.97 1.01 1.04 1.05
70–79§ 149 0.96 0.06 0.86 0.88 0.93 0.96 1.01 1.03 1.04
≥80 61 0.94 0.08 0.80 0.85 0.91 0.95 0.99 1.03 1.03
2006§
66–75 157 0.96 0.09 0.83 0.86 0.91 0.96 1.00 1.05 1.08
76–85 149 0.95 0.07 0.83 0.86 0.91 0.95 0.99 1.03 1.06
≥86 61 0.94 0.07 0.83 0.85 0.88 0.95 0.99 1.03 1.05
AMC (cm) 2000†#
60–69 159 25.9a 2.4 22.0 22.8 24.3 25.8 27.5 28.8 29.9
70–79 155 25.1ab 2.7 21.0 21.7 23.8 25.3 26.5 28.2 28.9
≥80 65 24.4b 2.3 21.0 21.4 22.6 24.3 26.3 27.6 27.7
2006†#
66–75 159 24.3a 2.5 20.5 21.2 22.7 24.1 26.0 27.7 28.5
76–85 155 22.9b 2.6 18.5 19.3 21.0 22.9 24.5 26.2 27.5
≥86 65 21.9b 2.4 18.6 18.8 20.7 22.1 23.2 24.7 27.0
AMA (cm2)
2000†§#
60–69 159 43.7a 10.3 28.5 31.3 36.9 43.0 50.3 56.0 60.9
70–79 154 40.6b 9.8 25.0 27.6 35.3 41.1 46.1 53.4 56.3
≥80 65 37.6b 9.1 25.0 26.5 30.7 37.2 45.0 50.6 50.9
2006†#
66–75 294 37.6a 9.8 23.6 25.7 30.9 36.2 43.7 51.1 54.8
76–85§ 260 32.2b 9.6 17.2 19.8 25.2 31.8 37.9 44.6 50.3
≥86 93 28.7c 8.6 17.5 18.0 24.0 28.8 32.9 38.4 48.1
BMI: body mass index; WC: waist circumference; WHR: waist-hip ratio; AMC: arm muscle circumference; AMA: arm muscle area;𝑋: mean values; SD: standard deviation.
†Statistical differences among age groups,𝑃 < 0.05(equal superscript letters: no statistical differences between age groups; different superscript letters: statistical
differences between age groups).
in endocrine function, loss of neuromuscular function, mus-cle fiber atrophy, changes in protein metabolism (deficit between synthesis and degradation), and insufficient protein
intake and/or inadequate nutrition [33].
The decrease in skeletal muscle mass occurs primarily as a result of a condition referred to as sarcopenia, and its consequences involve reduced muscular strength and an
increased risk of falls and consequent hip fractures [34,35].
According to Zhu et al. [36], regardless of the risk of falling,
the low body reserves have been linked to higher rates of all-cause mortality in women in the United States. Therefore, the skeletal muscle and fat mass reductions may be relevant risk factors with advancing age for disease prevention.
In this study, the reduction in the mean values of TSF with advancing age was greater than that of WC, the lowest values being found among the oldest old, as in other longitudinal studies conducted in China, the United States, and Europe
[14–19]. Women have higher mean values of TSF, but the
reduction of these variables was greater in men, as observed
by Going [20], who adopted the same age groups as used in
this study (60–69, 70–79, and≥80 y), that identified decreases
of 23%, 14%, and 20%, in women, and 10%, 12%, and 13%, in men, respectively.
The mean values of WC and WHR also showed a reduc-tion in both genders and all age groups, in line with the data
given by previous studies [14,15,17]. These values, in Brazilian
aged people, are lower than those of a study conducted in
a sample of American older adults [19]. This difference is
probably due to the fact that the average values of BM and TSF in American old people, as well as of the prevalence of obesity among them, are higher.
It is important to underscore that anthropometric mea-surements were performed by certified technicians in both
periods following SABE standardized protocol [9] but the
technical error of measurement was not tested and provided. In this study only the triceps skinfold was included and could have been affected by possibly larger inter- and intraindivid-ual errors of measurements. However, among the assessed anthropometric variables, the most pronounced reduction was observed in the triceps skinfold (30%) and even if less precise measurements were presented we could still probably detect a trend for a decrease from 2000 to 2006.
In conclusion, a negative anthropometric profile appears to be more delayed in women whereas the reduction is more
pronounced in the older adults≥80 years. This study showed
that the changes of anthropometric variables associated with the human aging process should be recognized by health professionals as an increased risk of undernutrition among very old adults may be expected. This information should contribute to the formulation of public health policies for disease prevention and health promotion in the elderly population.
Disclosure
The authors declare that this paper represents an original study and has not been published previously. It is not cur-rently being considered by any other journal and once accepted by Journal of Obesity will not be published
elsewhere without the written consent of Journal of Obesity. All the authors have seen and approved the content of this paper.
Acknowledgments
The authors acknowledge the FAPESP—Foundation
for Research Support of the State of S˜ao Paulo and CAPES—Coordination of Improvement of Higher Level Personnel for providing financial support. The authors have no financial or personal conflict of interests to disclose.
References
[1] WHO, “National Institute of Aging Global Health and Ageing,”
http://www.who.int/ageing/en/, 2013.
[2] IBGE, The Brazilian Institute of Geography and Statistics, “Demographic census,”http://www.ibge.gov.br, 2010.
[3] A. B. Newman, J. S. Lee, M. Visser et al., “Weight change and the conservation of lean mass in old age: the Health, Aging and Body Composition Study,”The American Journal of Clinical Nutrition, vol. 82, no. 4, pp. 872–878, 2005.
[4] R. N. Baumgartner, “Body composition in healthy aging,”
Annals of New York Academic Science, vol. 904, no. 1, pp. 437– 448, 2006.
[5] J. Ding, S. B. Kritchevsky, A. B. Newman et al., “Effects of Birth cohort and age on body composition in a sample of community-based elderly,”The American Journal of Clinical Nutrition, vol. 85, no. 2, pp. 405–410, 2007.
[6] F. Fantin, V. Di Francesco, G. Fontana et al., “Longitudinal body composition changes in old men and women: interrelationships with worsening disability,”Journals of Gerontology A, vol. 62, no. 12, pp. 1375–1381, 2007.
[7] F. C. D. Andrade, P. E. Guevara, M. L. Lebr˜ao et al., “Gender differences in life expectancy and disability-free life expectancy among older adults in Sao Paulo, Brazil,”Women’s Health Issues, vol. 21, no. 1, pp. 64–70, 2011.
[8] M. L. Lebr˜ao and R. Laurenti, “Health, well-being and aging: The SABE Study in Sao Paulo, Brazil,” Revista Brasileira de Epidemiologia, vol. 8, no. 2, pp. 127–141, 2005.
[9] M. Pel´aez, A. Palloni, J. C. Albala et al., Survey on Aging, Health and Wellbeing, 2000, Pan American Health Organiza-tion, Washington, DC, USA, 2003.
[10] A. R. Frisancho, “New standards of weight and body composi-tion by frame size and height for assessment of nutricomposi-tional status of adults and the elderly,”American Journal of Clinical Nutrition, vol. 40, no. 4, pp. 808–819, 1984.
[11] J. M. Gurney and D. B. Jelliffe, “Arm anthropometry in nutri-tional assessment: nomogram for rapid calculation of muscle circumference and cross sectional muscle and fat areas,” Ameri-can Journal of Clinical Nutrition, vol. 26, no. 9, pp. 912–915, 1973. [12] S. B. Heymsfield, C. McManus, and J. Smith, “Anthropometric measurement of muscle mass: revised equations for calculating bone-free arm muscle area,”American Journal of Clinical Nutri-tion, vol. 36, no. 4, pp. 680–690, 1982.
[13] D. Gallagher, “Weight loss in older women: influences on body composition,”American Journal of Clinical Nutrition, vol. 84, no. 5, pp. 957–958, 2006.
to health outcomes in Hong Kong Chinese age 70 and older,”
Journal of the American Geriatrics Society, vol. 49, no. 6, pp. 737– 746, 2001.
[15] C. P. G. M. De Groot, G. Enzi, A. L. Perdigao, and P. Deurenberg, “Longitudinal changes in anthropometric characteristics of elderly Europeans,”European Journal of Clinical Nutrition, vol. 50, no. 2, pp. S9–S15, 1996.
[16] D. K. Dey, E. Rothenberg, V. Sundh, I. Bosaeus, and B. Steen, “Height and body weight in the elderly. I. A 25-year longitudinal study of a population aged 70 to 95 years,”European Journal of Clinical Nutrition, vol. 53, no. 12, pp. 905–914, 1999.
[17] D. K. Dey, I. Bosaeus, L. Lissner, and B. Steen, “Changes in body composition and its relation to muscle strength in 75-year-old men and women: a 5-year prospective follow-up study of the NORA cohort in G¨oteborg, Sweden,”Nutrition, vol. 25, no. 6, pp. 613–619, 2009.
[18] C. P. G. M. De Groot, G. Enzi, C. Matthys, O. Moreiras, W. Roszkowski, and M. Schroll, “Ten-year changes in anthropo-metric characteristics of elderly Europeans,”Journal of Nutri-tion, Health and Aging, vol. 6, no. 1, pp. 4–8, 2002.
[19] V. A. Hughes, R. Roubenoff, M. Wood, W. R. Frontera, W. J. Evans, and M. A. Fiatarone Singh, “Anthropometric assessment of 10-y changes in body composition in the elderly,”The Ameri-can journal of clinical nutrition, vol. 80, no. 2, pp. 475–482, 2004. [20] S. Going, D. Williams, and T. Lohman, “Aging and body com-position: biological changes and methodological issues,” Exer-cise and Sport Sciences Reviews, vol. 23, pp. 411–449, 1995. [21] U. G. Kyle, F. F. Zhang, A. Morabia, and C. Pichard,
“Longitudi-nal study of body composition changes associated with weight change and physical activity,”Nutrition, vol. 22, no. 11-12, pp. 1103–1111, 2006.
[22] G. Bahat, F. Tufan, B. Saka B et al., “Which body mass index (BMI) is better in the elderly for functional status?”Archives of Gerontology and Geriatrics, vol. 54, no. 1, pp. 78–81, 2012. [23] L. S. Ferreira, T. Amaral, M. F. N. Marucci et al.,
“Undernutri-tion as a major risk factor for death among older Brazilian adults in the community-dwelling setting: SABE survey,”Nutrition, vol. 27, no. 10, pp. 1017–1022, 2011.
[24] M. C. Velazquez-Alva, M. E. Irigoyen, M. Zepeda, V. M. Sanchez, M. P. Garcia Cisneros, and L. M. Castillo, “Anthropo-metric measurements of a sixty-year and older Mexican urban group,”Journal of Nutrition, Health and Aging, vol. 8, no. 5, pp. 350–354, 2004.
[25] J. L. Santos, C. Albala, L. Lera et al., “Anthropometric measure-ments in the elderly population of Santiago, Chile,”Nutrition, vol. 20, no. 5, pp. 452–457, 2004.
[26] R. D. S. Coqueiro, A. R. Barbosa, and A. F. Borgatto, “Anthro-pometric measurements in the elderly of Havana, Cuba: age and sex differences,”Nutrition, vol. 25, no. 1, pp. 33–39, 2009. [27] K. F. Adams, A. Schatzkin, T. B. Harris et al., “Overweight,
obe-sity, and mortality in a large prospective cohort of persons 50 to 71 years old,”The New England Journal of Medicine, vol. 355, no. 8, pp. 763–778, 2006.
[28] D. R. Thomas, “Loss of skeletal muscle mass in aging: examining the relationship of starvation, sarcopenia and cachexia,”Clinical Nutrition, vol. 26, no. 4, pp. 389–399, 2007.
[29] F. Landi, G. Zuccal`a, G. Gambassi et al., “Body mass index and mortality among older people living in the community,”Journal of the American Geriatrics Society, vol. 47, no. 9, pp. 1072–1076, 1999.
[30] J. M. Kvamme, J. Holmen, T. Wilsgaard et al., “Body mass index and mortality in elderly men and women: the Tromsø and HUNT studies,”Journal Epidemiology Community Health, vol. 66, no. 7, pp. 611–617, 2012.
[31] T. O. Obisesan, M. H. Aliyu, V. Bond, R. G. Adams, A. Ako-molafe, and C. N. Rotimi, “Ethnic and age-related fat free mass loss in older Americans: the Third National Health and Nutri-tion ExaminaNutri-tion Survey (NHANES III),”BMC Public Health, vol. 5, no. 1, pp. 41–49, 2005.
[32] R. N. Baumgartner, S. J. Wayne, D. L. Waters, I. Janssen, D. Gallagher, and J. E. Morley, “Sarcopenic obesity predicts instru-mental activities of daily living disability in the elderly,”Obesity research, vol. 12, no. 12, pp. 1995–2004, 2004.
[33] R. N. Baumgartner, D. L. Waters, D. Gallagher, J. E. Morley, and P. J. Garry, “Predictors of skeletal muscle mass in elderly men and women,”Mechanisms of Ageing and Development, vol. 107, no. 2, pp. 123–136, 1999.
[34] A. C. Jentoft, J. P. Baeyens, J. Bauer et al., “Sarcopenia: European consensus on definition and diagnosis,”Age Ageing, vol. 39, no. 4, pp. 412–423, 2010.
[35] R. A. Fielding, B. Vellas, W. J. Evans et al., “Sarcopenia: an undiagnosed condition in older adults. Current consensus definition: prevalence, etiology, and consequences. Interna-tional Working Group on Sarcopenia,”Journal of the American Medical Directors Association, vol. 12, no. 4, pp. 249–256, 2011. [36] S. Zhu, M. Heo, M. Plankey, M. S. Faith, and D. B. Allison,
Submit your manuscripts at
http://www.hindawi.com
Stem Cells
International
Hindawi Publishing Corporation
http://www.hindawi.com Volume 2014
Hindawi Publishing Corporation
http://www.hindawi.com Volume 2014
INFLAMMATION
Hindawi Publishing Corporation
http://www.hindawi.com Volume 2014
Behavioural
Neurology
International Journal of
Endocrinology
Hindawi Publishing Corporation
http://www.hindawi.com Volume 2014
Hindawi Publishing Corporation
http://www.hindawi.com Volume 2014
Disease Markers
BioMed Research
International
Hindawi Publishing Corporation
http://www.hindawi.com Volume 2014
Oncology
Journal ofHindawi Publishing Corporation
http://www.hindawi.com Volume 2014
Hindawi Publishing Corporation
http://www.hindawi.com Volume 2014
Oxidative Medicine and Cellular Longevity
PPAR
R e s e a r c h
Hindawi Publishing Corporation
http://www.hindawi.com Volume 2014
The Scientific
World Journal
Hindawi Publishing Corporation
http://www.hindawi.com Volume 2014
Immunology Research
Hindawi Publishing Corporation
http://www.hindawi.com Volume 2014 Journal of
Obesity
Journal ofHindawi Publishing Corporation
http://www.hindawi.com Volume 2014
Hindawi Publishing Corporation
http://www.hindawi.com Volume 2014
Computational and Mathematical Methods in Medicine
Ophthalmology
Journal of Hindawi Publishing Corporationhttp://www.hindawi.com Volume 2014
Diabetes Research
Journal ofHindawi Publishing Corporation
http://www.hindawi.com Volume 2014
Hindawi Publishing Corporation
http://www.hindawi.com Volume 2014
Research and Treatment
AIDS
Hindawi Publishing Corporation
http://www.hindawi.com Volume 2014
Gastroenterology Research and Practice
Parkinson’s Disease
Hindawi Publishing Corporation
http://www.hindawi.com Volume 2014
Evidence-Based Complementary and Alternative Medicine
Volume 2014 Hindawi Publishing Corporation