DOI: http://dx.doi.org/10.5007/1980-0037.2015v17n2p186
original article
Licence
Creative Commom CC
RBCDH
1 Universidade de Brasília, Facul-dade de Educação Física. Brasília, Distrito Federal, Brasil.
Received: 09 May 2014 Accepted: 17 October 2014
Strength, muscle quality and markers of
cardiometabolic risk in older women
Força, qualidade muscular e marcadores de risco
cardiometabólico em mulheres idosas
Rafael Gauche1
André Bonadias Gadelha1
Flávio Macedo Lahud Paiva1
Pedro Ferreira Alves de Oliveira1
Ricardo Moreno Lima1
Abstract– he aging process is associated with a decline in physiological functions, including a reduction in muscle quality, as well as changes in cardiometabolic risk factors. hus, the aim of this study was to verify if a correlation exists between muscle strength and quality and cardiometabolic risk markers in older women. hirty older women (66.13±5.26 years, 67.33±12.45 kg, 1.54±0.07 m, body mass index: 28.20±4.72) were submitted to the evaluation of muscle thickness and strength and blood analy-sis of cardiometabolic risk markers (glucose, basal insulin, C-reactive protein, total cholesterol, HDL-cholesterol, LDL-cholesterol, VLDL-cholesterol, triglycerides, and HOMA-IR). Nosigniicant correlations were found between muscle phenotypes and markers of cardiometabolic risk, even ater adjustment for confounding factors.he present study indicates that muscle strength or quality is not correlated with markers of cardiometabolic risk.
Key words: Elderly; Muscle strength; Risk factors.
he process of aging is accompanied by diferent physiological changes that afect the function of organs and tissues, with an impact on the inde-pendence of older adults in activities of daily living and on their functional
capacity1. Among these changes, the reduction in strength levels and muscle
mass (i.e., sarcopenia) is negatively associated with the health of older adults,
including the occurrence of chronic-degenerative diseases2 and a higher
risk of mortality3, in addition to a signiicant impact on healthcare costs4.
Aging has also been associated with an increase in the circulating
levels of inlammatory markers5 and insulin resistance6 and with a
reduc-tion in cholesterol and its subfracreduc-tions7. Furthermore, studies have shown
a relationship between these variables and muscle strength8-10. However,
this association is not well documented for muscle quality (MQ). Muscle quality, also known as speciic tension or strength, can be characterized as the ratio between maximal muscle strength and muscle mass and is a more representative parameter of muscle function than muscle strength or
muscle mass alone11. As observed for muscle strength and mass, changes
in MQ can occur during aging12.
In the few studies investigating the association between MQ and mark-ers of cardiometabolic risk, only variables related to glycemic control were
analyzed13,14 and the results, methods used for strength evaluation and
calculation of MQ difered between studies. Furthermore, there are no studies analyzing the association between MQ and inlammatory markers or lipid proile variables.
One may speculate that the correlation of these variables with MQ is more pronounced than with muscle strength since the former is a more representative measure of the function of the muscle complex. he identii-cation of this correlation is particularly important for the elderly population
because of the deleterious efects of aging on both the muscle system12 and
on the levels of some cardiometabolic risk markers5,6. he study of muscle
phenotypes and blood variables related to cardiometabolic risk in older women is of special interest since women are at higher cardiovascular
risk ater the age of 60 years15 and present elevated cholesterol levels7 and
a higher incidence of diabetes16 when compared to men.
Muscle phenotypes and cardiometabolic risk Gauche et al.
METHODS
Sample
hirty older women (66.13±5.26 years, 67.33±12.45 kg, 1.54±0.07 m, body
mass index [BMI] of 28.20±4.72 kg/m2 without any experience in strength
training were selected to participate in the study. For recruitment of the sample, the study was previously published at strategical sites of the Federal District through print (banners, billboards and lealets) and interactive media (radio and television). Older women aged 60 to 80 years who voluntarily agreed to participate in the study were selected. Ater initial recruitment, the following exclusion criteria were applied: experience in strength training or participation in a guided physical exercise program in the 3 months preceding the evaluations and a his-tory of musculoskeletal injury related to movements in strength tests.
All subjects were informed about the risks and beneits of the study and signed the free informed consent form before participation in the study. he study was conducted by the analysis of data originating from initial assessments of a sample of subjects participating in a more comprehensive study approved by the Ethics Committee on Human Research of the School of Health Sciences, University of Brasília (Universidade de Brasília - UnB) (Registration No. 001/13).
Experimental procedures
Data were collected on two days at an interval of up to 2 weeks. he irst visit consisted of anthropometric evaluation and application of a questionnaire containing traditional anamnesis data, sociodemographic data, medical history, and use of medications. he second visit consisted of blood col-lection (ater a fast of ~12 hours) and the evaluation of muscle thickness and isokinetic peak torque. During the second visit, the cited order of evaluations was rigorously followed, i.e., immediately ater blood collec-tion the volunteers were invited to have breakfast ofered free of charge by the Exercise Physiology and Health Research Group, School of Physical Education, UnB. Muscle thickness was analyzed ater a postprandial period of 30 minutes by ultrasonography and muscle strength was then evaluated with an isokinetic dynamometer.
Anthropometric assessment
For anthropometric assessment, the subjects were weighed on a digital scale to the nearest 50 g and height was measured with a wall stadiometer. he BMI was calculated by dividing body weight by the square of the height
(kg/m2) of the volunteers.
Muscle thickness
additional pressure was applied to standardize the compression generated on the skin. Once the examiner found a satisfactory image, it was frozen and stored. Finally, all measurements and analyses were performed three times by the same examiner and the mean value was considered for analysis. he cut-of value for the evaluation of rectus femoris muscle thickness was deined according to Chilibeck et al.17.
Isokinetic peak torque
Isokinetic peak torque (PT) of the knee extensor was measured with an isokinetic dynamometer (Biodex System III, Biodex Medical Systems, New York, USA). For warm-up and familiarization with the test, the volunteers
underwent two series of eight repetitions at an angular velocity of 300°.s-1.
he subjects were asked to exercise at submaximal force levels. Next, PT was evaluated ater four series of 4 maximal repetitions, the irst two
per-formed at 60º.s-1 and the last two at 180°.s-1, with an interval of 1 minute
between series. Only the PT at 60º.s-1 was considered for analysis and the
highest value obtained in the two series was used.
he subjects were positioned comfortably on the dynamometer, which was adjusted individually for each subject. Ater adjustment, the subjects were strapped to minimize movements that could interfere with the re-sults of the tests. he PT values were adjusted for gravity using the Biodex Advantage sotware. It should be noted that older women do not show
diferences in PT between the dominant and non-dominant limb18. hus,
only the dominant lower limb was evaluated during the strength test, in which all subjects received visual feedback and verbal encouragement.
Muscle quality
Muscle quality, also called speciic torque, was deined as the force pro-duced per unit of muscle volume. he quadriceps muscle was chosen for this analysis because it is widely evaluated in older adults and an asso-ciation with activities of daily living has been well documented. Muscle quality was calculated from the measurements of muscle volume and the force produced by the muscle. Techniques that are well described in the literature were used for the measurements (i.e., isokinetic dynamography
and ultrasonography)11,14. hus, muscle strength (isokinetic PT at 60º.s-1)
was divided by muscle thickness and the results are expressed as N.m/mm.
Blood markers of cardiometabolic risk
Muscle phenotypes and cardiometabolic risk Gauche et al.
C-reactive protein was measured by a turbidimetric method. Additionally, the HOMA-IR was calculated by dividing the product of insulin (μIU/mL) and glucose (mmol/dL) by 405.
Statistical analysis
he descriptive characteristics are expressed as the mean and standard deviation. Normality of the sample was veriied using the Shapiro-Wilk test. he association between variables was then evaluated by partial cor-relation analysis controlling for the following variables: smoking, hormone replacement therapy, diseases, medications, and regular physical activity. A level of signiicance of p < 0.05 was adopted. All analyses were performed using the SPSS 20.0 sotware.
RESULTS
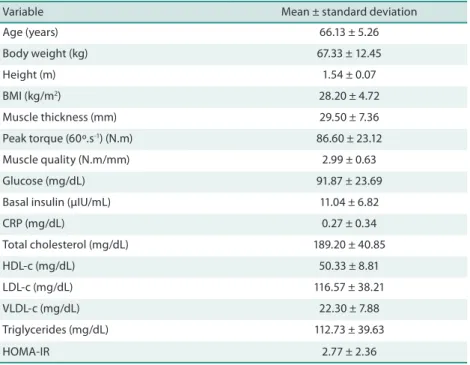
he characteristics of the subjects are shown in Table 1.
Table 1. Characteristics of the subjects (n = 30).
Variable Mean ± standard deviation
Age (years) 66.13 ± 5.26
Body weight (kg) 67.33 ± 12.45
Height (m) 1.54 ± 0.07
BMI (kg/m2) 28.20 ± 4.72
Muscle thickness (mm) 29.50 ± 7.36
Peak torque (60º.s-1) (N.m) 86.60 ± 23.12
Muscle quality (N.m/mm) 2.99 ± 0.63
Glucose (mg/dL) 91.87 ± 23.69
Basal insulin (µIU/mL) 11.04 ± 6.82
CRP (mg/dL) 0.27 ± 0.34
Total cholesterol (mg/dL) 189.20 ± 40.85
HDL-c (mg/dL) 50.33 ± 8.81
LDL-c (mg/dL) 116.57 ± 38.21
VLDL-c (mg/dL) 22.30 ± 7.88
Triglycerides (mg/dL) 112.73 ± 39.63
HOMA-IR 2.77 ± 2.36
BMI = body mass index; CRP = C-reactive protein; HDL-c = HDL cholesterol; LDL-c = LDL cholesterol; VLDL-c = VLDL cholesterol; HOMA-IR = homeostasis model assessment of insulin resistance.
Analysis of the correlation of muscle strength and MQ with cardio-metabolic risk markers is shown in Table 2. No signiicant associations were observed between strength or MQ and the cardiometabolic risk markers studied. he frequency of the confounding variables was as follows: smoking
Variable
r p r p
Glucose (mg/dL) 0.243 0.252 0.215 0.314
Basal insulin (µUI/mL) 0.379 0.068 0.284 0.178
CRP (mg/dL) -0.268 0.206 -0.230 0.280
Total cholesterol (mg/dL) 0.239 0.260 -0.243 0.253
HDL-c (mg/dL) 0.069 0.748 -0.171 0.423
LDL-c (mg/dL) 0.184 0.390 -0.261 0.217
VLDL-c (mg/dL) 0.215 0.314 0.191 0.370
Triglycerides (mg/dL) 0.204 0.339 0.156 0.465
HOMA-IR 0.364 0.080 0.282 0.182
PT = peak torque; MQ = muscle quality; CRP = C-reactive protein; HDL-c = HDL cholesterol; LDL-c = LDL cholesterol; VLDL-c = VLDL cholesterol; HOMA-IR = homeostasis model assessment of insulin resistance. Values adjusted for the following variables: smoking, hormone replacement therapy, diseases, medications, and regular physical activity.
DISCUSSION
he present results did not show signiicant correlations between strength or MQ and cardiometabolic risk markers in older women, even ater adjust-ment for possible confounding variables (smoking, hormone replaceadjust-ment therapy, diseases, medications, and regular physical activity). here is spe-cial interest in studying this association in older women who are at higher
cardiovascular risk ater the age of 60 years15 and who present elevated
cho-lesterol levels7 and a higher incidence of diabetes16 when compared to men.
Although the muscle phenotypes studied were not signiicantly correlated with glucose (r = 0.243 for strength; r = 0.215 for MQ), basal insulin (r = 0.379 for strength; r = 0.284 for MQ) or insulin resistance (r = 0.364 for strength; r = 0.282 for MQ), there is interest in the study of the relationship between these phenotypes and markers of glucose uptake
since skeletal muscle is the main site of glucose uptake in the body19.
he question is particularly interesting for the elderly population since
an increase in insulin resistance6, which indicates the possibility of
im-paired glucose uptake, is one of the metabolic disorders that accompany the process of aging. In fact, there is evidence indicating a relationship
between sarcopenia and increased insulin resistance20.
No signiicant correlations were observed between muscle strength
and glucose levels, in agreement with the study of Wijndaele et al.10.
In contrast to the present results, several studies8,13,14,21,22 have
demon-strated associations between strength and indicators of glycemic control.
With respect to glucose levels, Jurca et al.8 found an inverse correlation
between muscle strength and glucose levels in 8,570 men. For insulin
resistance, Nomura et al.22 reported inverse correlations of lower limb
strength with insulin levels and HOMA-IR, in agreement with the study
of Barzilay et al.21. he divergences between the present study and the
Muscle phenotypes and cardiometabolic risk Gauche et al.
he lack of a correlation between MQ and markers of glycemic
con-trol agrees in part with the study of Park et al.14, but is not supported by
previous studies13,21,23. Park et al.14 observed no signiicant correlation
between MQ and glycemic control. hese authors also identiied a nega-tive correlation between the duration of diabetes and MQ, although the efect of diabetes on MQ was eliminated ater adjusting for confounding factors in the female population, in agreement with the indings of the
present study. In contrast, Volpato et al.23 found diabetes to be associated
with poor MQ in older adults, even ater adjustment for age and gender.
In agreement with these indings, Lee et al.13 observed signiicant
cor-relations between MQ and insulin sensitivity in 40 obese adolescents.
Similar results have been reported by Barzilay et al.21. It should be noted
that the studies cited used diferent methods for the evaluation of muscle strength and thickness, with a direct inluence on the values used for the calculation of MQ. he lack of standardization in the choice of these vari-ables may have interfered with the results and their interpretation, as well as with the comparisons between previous studies and the present one. he lack of a correlation between muscle strength and lipid proile (total cholesterol, r = 0.239; HDL-c, r = 0.069; LDL-c, r = 0.184; VLDL-c, r
= 0.215; triglycerides, r = 0.204) agrees with previous studies22,24, although
not all have corroborated these indings8,10. Kohl et al.24 compared the
relationship between muscle strength and lipid proile in men and women and found no signiicant correlations for women. hese results are
sup-ported by the study of Nomura et al.22 who also observed no correlations
between strength and LDL-c, HDL-c or triglycerides, as demonstrated
in the present study. In contrast, Wijndaele et al.10 found a negative
correlation between muscle strength and triglycerides and a positive correlation between muscle strength and HDL-c in women, correlations
corroborated by Jurca et al.8, but not observed in the present study.
Intramuscular fat content is known to be higher in older adults when
compared to younger individuals25, a fact that may explain the
reduc-tion in MQ observed during aging12. However, although intramuscular
fat is associated with the availability of circulating lipids26, no signiicant
correlations were observed between MQ and lipid proile variables (total cholesterol, r = -0.243; HDL-c, r = -0.171; LDL-c, r = -0.261; VLDL-c, r = 0.191; triglycerides, r = 0.156). To our knowledge, this is the irst study investigating this association since we found no studies in the literature correlating MQ with triglyceride or cholesterol levels. Methodological dif-ferences compared to other studies may explain in part the results found. here was no signiicant correlation between muscle strength and CRP levels (r = -0.268). he indings of the present study agree in part with the
results reported by Schaap et al.9 who observed no association between
proteins are related to catabolic processes in muscle tissue that lead to the loss of muscle strength and muscle mass - consequently accelerating the
process of sarcopenia – and to functional limitations in older adults29,30.
However, such association was not observed in the present study. No correlation between MQ and CRP levels was observed in the present study (r = -0.230). his inding was expected since MQ is a more functional measure of muscle capacity. It was not possible to identify the reason for the lack of correlation between these variables, a fact indicating the need for further studies with similar objectives. Additionally, there are no studies in the literature evaluating the association between MQ and CRP. he lack of standardization observed for the calculation of MQ impairs comparisons with the results of other studies and is a potential limita-tion of this study. In fact, there is no consensus in the literature regard-ing the measurement of MQ. Well-described techniques (i.e., isokinetic
dynamometry and ultrasonography) were used in the present study11,14.
In summary, no signiicant correlations were observed between mus-cle strength or MQ and markers of cardiometabolic risk in older women.
Acknowledgements
We thank Conselho Nacional de Desenvolvimento Cientíico e Tecnológico (CNPq) for inancial support (Grant No. 487622/2012-0).
REFERENCES
1. American College of Sports Medicine. Position stand. Exercise and physical activity for older adults. Med Sci Sports Exerc 2009;41(7):1510-30.
2. Chin SO, Rhee SY, Chon S, Hwang YC, Jeong IK, Oh S, et al. Sarcopenia is inde-pendently associated with cardiovascular disease in older Korean adults: he Korea National Health and Nutrition Examination Survey (KNHANES) from 2009. PloS One 2013;8(3):e60119.
3. Arango-Lopera VE, Arroyo P, Gutierrez-Robledo LM, Perez-Zepeda MU, Ce-sari M. Mortality as an adverse outcome of sarcopenia. J Nutr Health Aging 2013;19(3):259-262.
4. Janssen I, Shepard DS, Katzmarzyk PT, Roubenof R. he healthcare costs of sar-copenia in the United States. J Am Geriatr Soc 2004;52(1):80-5.
5. Brüünsgaard H, Pedersen BK. Age-related inlammatory cytokines and disease. Immunol Allergy Clin North Am 2003;23(1):15-39.
6. Meigs JB, Muller DC, Nathan DM, Blake DR, Andres R. he natural history of progression from normal glucose tolerance to type 2 diabetes in the Baltimore Longitudinal Study of Aging. Diabetes 2003;52(6):1475-84.
7. Ettinger WH, Wahl PW, Kuller LH, Bush TL, Tracy RP, Manolio TA, et al. Lipo-protein lipids in older people. Results from the Cardiovascular Health Study. he CHS Collaborative Research Group. Circulation 1992;86(3):858-69.
8. Jurca R, Lamonte MJ, Church TS, Earnest CP, Fitzgerald, SJ, Barlow CE, JORDAN AN, et al. Associations of muscle strength and aerobic itness with metabolic syn-drome in men. Med Sci Sports Exerc 2004;36(8):1301-7.
9. Schaap LA, Pluijm SM, Deeg DJ, Visser M. Inlammatory markers and loss of muscle mass (sarcopenia) and strength. Am J Med 2006;119(6):526.e9-17.
Muscle phenotypes and cardiometabolic risk Gauche et al.
Corresponding author
Rafael Gauche
Universidade de Brasília, Campus Universitário Darcy Ribeiro, Faculdade de Educação Física, Brasília, DF, Brasil. CEP: 70910-900.
E-mail: [email protected]
11. Radaelli R, Neto ENW, Bottaro MF, Pinto RS. Espessura e qualidade musculares medidas a partir de ultrassonograia: inluência de diferentes locais de mensuração. Rev Bras Cineantropom Desempenho Hum 2011;13(2):87-93.
12. Goodpaster BH, Park SW, Harris TB, Kritchevsky, SB, Nevitt M, Schwartz AV, et al. he loss of skeletal muscle strength, mass, and quality in older adults: the health, ag-ing and body composition study. J Gerontol A Biol Sci Med Sci 2006;61(10):1059-64.
13. Lee S, Kim Y, White D, Kuk J, Arslanian S. Relationships between insulin sensitiv-ity, skeletal muscle mass and muscle quality in obese adolescent boys. Eur J Clin Nutr 2012;66(12):1366-8.
14. Park SW, Goodpaster BH, Strotmeyer ES, De Rekeneire N, Harris TB, Schwartz AV, et al. Decreased muscle strength and quality in older adults with type 2 diabetes. he Health, Aging, and Body Composition Study. Diabetes 2006;55(6):1813-18.
15. Mikkola TS, Gissler M, Merikukka M, Tuomikoski P, Ylikorkala O. Sex diferences in age-related cardiovascular mortality. PloS One 2013;8(5):e63347.
16. Lee CY, Hairi NN, Ahmad WAW, Ismail O, Liew HB, Zambahari R, et al. Are there gender diferences in coronary artery disease? he Malaysian National Car-diovascular Disease Database–Percutaneous Coronary Intervention (NCVD-PCI) Registry. PloS One 2013;8(8):e72382.
17. Chilibeck PD, Stride D, Farthing JP, Burke DG. Effect of creatine ingestion ater exercise on muscle thickness in males and females. Med Sci Sports Exerc 2004;36(10):1781-8.
18. Frontera WR, Hughes VA, Lutz KJ, Wvans WJ. A cross-sectional study of muscle strength and mass in 45- to 78-yr-old men and women. J Appl Physiol 1991;71(2): 644-50.
19. DeFronzo RA. Lilly lecture 1987. he triumvirate: beta-cell, muscle, liver. A collu-sion responsible for NIDDM. Diabetes 1988;37(6):667-87.
20. Srikanthan P, Karlamangla AS. Relative muscle mass is inversely associated with insulin resistance and prediabetes. Findings from the third National Health and Nutrition Examination Survey. J Clin Endocrinol Metab 2011;96(9):2898-903.
21. Barzilay JJ, Cotsonis GA, Walston J, Schwartz AV, Satterield S, Miljkovic J, Harris TB. Insulin resistance is associated with decreased quadriceps muscle strength in nondiabetic adults aged≥ 70 years. Diabetes Care 2009;32(4):736-8.
22. Nomura T, Ikeda Y, Nakao S, Ito K, Ishida K, Suehiro T, et al. Muscle strength is a marker of insulin resistance in patients with type 2 diabetes: a pilot study. Endocr J 2007;54(5):791-96.
23. Volpato S, Bianchi L, Lauretani F, Lauretani F, Bandinelli S, Guralnik JM, et al. Role of muscle mass and muscle quality in the association between diabetes and gait speed. Diabetes Care 2012;35(8):1672-79.
24. Kohl H, Gordon NF, Scott CB, Vaandrager H, Blair SN. Musculoskeletal strength and serum lipid levels in men and women. Med Sci Sports Exerc 1992;24(10):1080-7.
25. Cree MG, Newcomer BR, Katsanos CS, Sheield-Moore M, Chinkes D, Aarsland A, et al. Intramuscular and liver triglycerides are increased in the elderly. J Clin Endocrinol Metab 2004;89(8):3864-71.
26. Shaw CS, Clark J, Wagenmakers AJ. he efect of exercise and nutrition on intra-muscular fat metabolism and insulin sensitivity. Annu Rev Nutr 2010;30:13-34.
27. Hamer M, Molloy GJ. Association of C-reactive protein and muscle strength in the English Longitudinal Study of Ageing. Age 2009;31(3):171-7.
28. Taafe DR, Harris TB, Ferrucci L, Rowe J, Seeman TE. Cross-sectional and prospec-tive relationships of interleukin-6 and C-reacprospec-tive protein with physical performance in elderly persons: MacArthur studies of successful aging. J Gerontol A Biol Sci Med Sci 2000;55(12):M709-15.
29. Visser M, Pahor M, Taafe DR, Goodpaster BH, Simonsick EM, Newman AB, et al. Relationship of interleukin-6 and tumor necrosis factor-α with muscle mass and muscle strength in elderly men and women: the Health ABC Study. J Gerontol A Biol Sci Med Sci 2002;57(5):M326-32.