Licence Creative Commom
CC
RBCDH
The impact of obesity on the perception of
self-concept in children and adolescents
O impacto da obesidade na percepção do autoconceito
em crianças e adolescentes
Helio Serassuelo Junior1 Timothy Gustavo Cavazzotto2 Ana Carolina Paludo3 Lidyane Ferreira Zambrin2 Antonio Carlos Simões4
Abstract– he objective of this study was to investigate the impact of overweight and obesity on the perception of self-concept in children and adolescents. A total of 785 schoolchildren, 410 girls (11.44 ± 1.84 years), participated in the study. he sample was divided into normal weight, overweight and obese groups according to the BMI criteria proposed by Cole et al. (2000). Socioeconomic status (SES) was evaluated according to the ABEP (2010) and self-concept was rated using the Piers-Harris 2 Scale. he results showed that for the overall self-concept variable the overweight and obese groups were within the average recommended by the instrument; however, the lowest scores were observed in obese boys and girls. On the basis of speciic predictors (BMI, age, SES and skin color), obese boys were signiicantly more likely to present imbalance in the Behav-ioral Adjustment and Freedom From Anxiety domains (2.6 and 3.1 times, respectively) than the normal weight group, irrespective of age, SES and skin color. For girls, the obese group was 2.0 to 2.7 times more likely to present imbalance in the TOT and Intellectual Status, Popularity and Happiness domains than the normal weight group, irrespective of age, SES and skin color. he results demonstrated a negative impact of overweight and obesity on the perception of overall self-concept and its domains.
Key words: Children; Obesity; Self-concept.
Resumo– O objetivo do presente estudo foi investigar se crianças e/ou adolescentes com excesso de peso apresentam uma percepção negativa do seu autoconceito. Participaram do estudo 785 escolares, 410 meninas (11,44±1,84 anos). A distribuição da amostra nos grupos peso normal, sobrepeso e obesidade foi realizada pelo critério de IMC proposto por Cole et al. (2000), as características socioeconômicas, ABEP (2010) e o autoconceito inventário Piers-Harris 2. Os resultados demonstram que para variável autoconceito total, ambos os grupos estão dentro da média preconizada pelo inventário, porém os menores valores ob-servados para esta variável estão localizados no grupo obeso em ambos os sexos. A partir de previsores especíicos, IMC, idade, os meninos obesos apresentaram um efeito signiicativo de 2,6 vezes mais chances em apresentar desequilíbrio na variável ajuste de comportamento e 3,1 vezes mais chance para a variável livre de ansiedade, signiicativamente comparados ao grupo com peso normal, independente da idade, NSE e cor da pele. Para as meninas, o grupo obeso apresentou entre 2,0 e 2,7 vezes mais chance de desequilíbrio para as variáveis TOT, Status Intelectual, Popularidade e Felicidade, comparado ao grupo com peso normal, independente do efeito da idade, NSE e cor da pele. Os resultados encontrados demonstram existir impacto negativo na percepção do autoconceito total e suas dimensões, condicionado
1 Universidade Estadual de Londri-na. Departamento de Ciências do Esporte. Londrina, PR. Brasil.
2 Universidade Estadual de Londri-na. Programa de Pós-Graduação em Educação Física UEM-UEL. Londrina, PR. Brasil.
3 Universidade de São Paulo. Programa de Pós-Graduação em Educação Física. São Paulo, SP. Brasil.
4 Universidade de São Paulo. Es-cola de Educação Física e Esporte. São Paulo, SP. Brasil.
Obesity in children and adolescents Serassuelo et al.
INTRODUCTION
he results of studies on youth health indicate an association between psychological disorders and excess weight, even in adolescence1-4. During this phase, young people face the transition from childhood to adulthood, a process that is inluenced by both interpersonal relationships and cultural aspects. herefore, the way society treats an obese youngster can have a major impact on body image and self-concept5-7.
he body image somehow relects the images that circulate in society and are built from the diferent relationships established, i.e., a social im-age of the body always exists in any group and thus is a symbol that causes feelings of identiication or rejection of individuals in relation to certain images. If the dominant, socially valued body image is that of a slim person, losing weight would be the ideal goal for everybody. Within this perspective, individuals who are unable to achieve this desirable pattern sufer a lot5-7.
From the same point of view, it should be understood that self-concept is related to the perception of how the individual sees himself in physical, social and spiritual spheres. Self-concept would be a dynamic characteristic which a human acquires and develops as he expands his perception and
understanding of personal and social values8. According to Serassuelo
Junior et al.9, self-concept develops from a social feedback response and from the ability to interpret ideas and personal success.
Selection and description of the sample
he data used in this study are part of a project entitled “Trends in self-concept of school-age children: a study of the inluence of anthropometric and psychosocial variables”, approved by the Ethics Committee of the School of Physical Education and Sports, University of São Paulo (Escola de Educação Física e Esporte, Universidade de São Paulo - EEFEUSP) (Protocol No. 053/06072004).
he present study was conducted in the Municipality of Cambé, Paraná, Brazil. here are approximately 400 school classes of primary and second education in this municipality, comprising a total of about 10,000 students. Of these, 2000 students are enrolled in 4th to 9th grade classes.
he town was divided into ive major regions to guarantee the repre-sentativeness of the sample at all socioeconomic, racial and ethnic levels. Six schools representing all regions, one school per region and two schools for the center region due to its higher population density, were selected. Classes of 1st to 9th grade (age range of 8 to 14 years) were randomly chosen at each school, selecting only one class from each series per school and always morning classes.
Selection criteria for participation in the study were the child’s interest to participate in the study, to be regularly enrolled at the school selected, and to be present in the Physical Education class. Ater they had received detailed information about the study procedures, the parents or legal guardian signed the free informed consent form.
First, 821 children and adolescents who met all study criteria were se-lected: region, school, grade, and consent to participate. he inal sample con-sisted of 785 children and adolescents of both genders (410 girls and 375 boys).
Anthropometric measures
he body weight of the subjects was measured with a Filizola digital scale to the nearest 0.1 kg, and height was determined with an anthropometric measuring tape mounted on the wall to the nearest 0.1 cm, according to the recommendations of Gordonet al.12. Body weight and height were used
to calculate the body mass index (BMI) as the body weight divided by the square of the height6. he deinition proposed by Cole et al.13 was used to
classify the nutritional status of the schoolchildren and the sample was thus divided into three groups: normal weight (low weight + normal weight), overweight, and obese. All measurements were made by experienced re-searchers with training in physical education.
Socioeconomic status and ethnicity
Obesity in children and adolescents Serassuelo et al.
Evaluation of self-concept
he Piers-Harris 2 Scale15 was used to evaluate the perception of self-concept in the children and adolescents studied. his instrument was translated
and adapted to the Portuguese language by Serassuelo Junior et al.9. he
Piers-Harris 2 Scale was applied individually in the class room without interference from the parents or teachers. he procedures described in the manual of the instrument were followed. he instrument can be applied to children and adolescents aged 7 to 18 years.
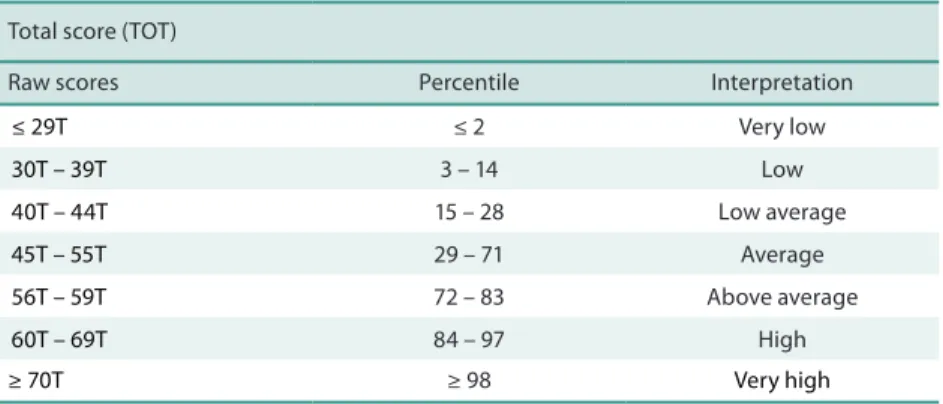
he Piers-Harris 2 Scale consists of 60 items with alternative responses (yes or no) and measures, in addition to overall self-concept (total score, TOT), the following six domain scales: Behavioral Adjustment (BEH), Intellectual and School Status (INT), Physical Appearance and Personal Attributes (PHY), Freedom From Anxiety (FRE), Popularity (POP), and Happiness and Satisfaction (HAP). he standardization of the instrument itself is used for interpretation of the results (Table 1).
It should be emphasized that the instrument permits visualization of the inal results as absolute or relative (percentile) values, attributing scale scores to each domain related to the behavior of the individuals. he standard result is a common numerical measure that permits comparison between raw scores as well as with a reference sample.
Table 1. Interpretation of the results of the Piers-Harris 2 Scale15.
Total score (TOT)
Raw scores Percentile Interpretation
≤ 29T ≤ 2 Very low
30T – 39T 3 – 14 Low
40T – 44T 15 – 28 Low average
45T – 55T 29 – 71 Average
56T – 59T 72 – 83 Above average
60T – 69T 84 – 97 High
≥ 70T ≥ 98 Very high
Data collection
Data were collected during the Physical Education classes at the selected schools. First, a questionnaire for personal identiication of the students was applied, followed by the socioeconomic questionnaire. Ater this irst contact, the participants were submitted to anthropometric assessment and application of the self-concept scale.
Statistical analysis
was classiied whether he/she met the average proposed by the interpreta-tion of the results of the Piers-Harris 2 Scale (Table 1). For this purpose, students whose score was within the average were classiied as balanced and those whose score was above or below the average range were classiied as unbalanced. Binary logistic regression was used to determine the risk of behavioral imbalance (self-concept) considering as predictors BMI and age adjusted for SES and skin color. Association analysis (chi-squared test) indicated the variables that should be included in the model as predictors (p<0.20). he adjustment variables were selected by sensitivity analysis. hese variables modiied the result of association between the predictors and the outcome. A level of signiicance of p<0.05 was adopted for all statistical analyses.
RESULTS
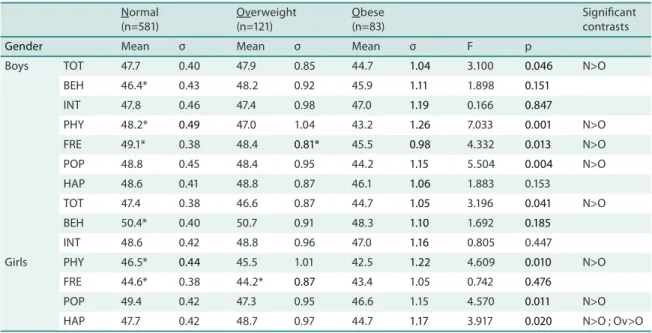
Table 2 shows the descriptive results of the study according to nutritional status. A irst analysis showed that 26% (n=204) of the subjects studied had excess weight, with 10% (n=83) being classiied as obese. Signiicantly lower scores were observed in the obese group compared to the normal weight group for TOT and for the PHY, FRE and POP domains. Additionally, in boys, signiicantly lower POP scores were observed in the obese group com-pared to the overweight group. In girls, only PHY scores difered between the obese and normal weight groups, and HAP scores difered between the obese and overweight groups. It should be noted that these comparisons were made correcting for the efect of age. Comparison between boys and girls showed signiicant diferences in BEH, PHY and FRE scores in the normal weight group and in FRE scores in the overweight group, with girls only scoring higher in the BEH domain.
In Table 3, the analysis was structured by dividing the subjects into two groups. he irst group consisted of subjects whose self-concept scores were within the average (balanced). he second group consisted of subjects whose domain scores were below or above the average.
Obesity in children and adolescents Serassuelo et al.
Table 3. Risk of the occurrence of imbalance among youngsters according to BMI and age adjusted for skin color and socioeconomic status.
TOT BEH INT PHY FRE POP HAP
Boys
BMI
Normal 1 1 1 1 1 1 1
Overweight 1.1 (0.6-1.6) 0.9 (0.5-1.3) 0.7 (0.4-1.0) 0.8 (0.4-1.2) 0.8 (0.4-1.2) 0.8 (0.4-1.2) 0.7 (0.4-1.0)
Obese 1.7 (0.8-2.6) 2.6 (1.3-3.9) 1.1 (0.5-1.7) 0.8 (0.4-1.2) 3.1 (1.5-4.7) 1.7 (0.8-2.6) 1.5 (0.7-2.3)
Age (years)
8-9 1 1 1 1 1 1 1
10-12 1.4 (0.7-2.1) 0.5 (0.2-0.9) 0.6 (0.3-0.9) 1.3 (0.7-1.9) 1.5 (0.7-2.3) 0.9 (0.4-1.4) 1.3 (0.6-2.0)
13-14 1.5 (0.9-2.1) 0.7 (0.4-1.0) 0.8 (0.5-1.1) 1.3 (0.8-1.8) 2.0 (1.1-2.9) 1.4 (0.8-2.0) 1.4 (0.8-2.0)
Girls
BMI
Normal 1 1 1 1 1 1 1
Overweight 0.9 (0.5-1.3) 0.7 (0.3-1.1) 1.0 (0.5-1.5) 1.3 (0.7-1.9) 0.7 (0.4-1.0) 1.3 (0.7-2.3) 1.2 (0.6-1.8)
Obese 2.1 (1.1-3.1) 0.9 (0.4-1.4) 2.0 (1.1-2.9) 1.9 (0.9-2.9) 1.4 (0.7-2.1) 2.7 (1.3-4.1) 2.5 (1.2-3.8)
Age (years)
8-9 1 1 1 1 1 1 1
10-12 0.7 (0.3-1.1) 0.8 (0.4-1.2) 0.6 (0.2-1.0) 0.4 (0.2-0.8) 0.4 (0.2-0.6) 1.5 (0.8-2.2) 1.3 (0.6-2.0)
13-14 1.0 (0.6-1.4) 0.9 (0.5-1.3) 0.8 (0.5-1.1) 0.8 (0.5-1.1) 1.1 (0.7-1.5) 1.2 (0.8-1.6) 1.0 (0.6-1.4)
Adjusted odds ratios (95% conidence interval) for the predictor variables (BMI and age), skin color and socioeconomic status. TOT: Total Score; BEH: Behavioral Adjustment; INT: Intellectual and School Status; PHY: Physical Appearance and Personal Attributes; FRE: Freedom From Anxiety; POP: Popularity; HAP: Happiness and Satisfaction.
Table 2. Distribution of the mean and standard deviation adjusted for age (ANCOVA) of overall self-concept and domain scores according to nutritional status.
Normal (n=581)
Overweight (n=121)
Obese (n=83)
Signiicant contrasts
Gender Mean σ Mean σ Mean σ F p
Boys TOT 47.7 0.40 47.9 0.85 44.7 1.04 3.100 0.046 N>O
BEH 46.4* 0.43 48.2 0.92 45.9 1.11 1.898 0.151
INT 47.8 0.46 47.4 0.98 47.0 1.19 0.166 0.847
PHY 48.2* 0.49 47.0 1.04 43.2 1.26 7.033 0.001 N>O
FRE 49.1* 0.38 48.4 0.81* 45.5 0.98 4.332 0.013 N>O
POP 48.8 0.45 48.4 0.95 44.2 1.15 5.504 0.004 N>O
HAP 48.6 0.41 48.8 0.87 46.1 1.06 1.883 0.153
Girls
TOT 47.4 0.38 46.6 0.87 44.7 1.05 3.196 0.041 N>O
BEH 50.4* 0.40 50.7 0.91 48.3 1.10 1.692 0.185
INT 48.6 0.42 48.8 0.96 47.0 1.16 0.805 0.447
PHY 46.5* 0.44 45.5 1.01 42.5 1.22 4.609 0.010 N>O
FRE 44.6* 0.38 44.2* 0.87 43.4 1.05 0.742 0.476
POP 49.4 0.42 47.3 0.95 46.6 1.15 4.570 0.011 N>O
HAP 47.7 0.42 48.7 0.97 44.7 1.17 3.917 0.020 N>O ; Ov>O
Prior to the discussion of self-concept (self-esteem), it is necessary to under-stand that this construct corresponds to the way each individual perceives and constructs his mental representations in response to past experiences (real and imaginary), and also to the situations, memories and feelings about himself and about others16,17.
On the basis of this concept, we irst observed that children and adoles-cents of the obese group had TOT scores below the average recommended by the instrument used. his observation is analyzed considering the efects of age on this variable.
With respect to the self-concept domains, the obese group presented PHY scores below the expected in both genders, with the observation of lower scores for girls. Song and Hattie18 reported that self-concept is con-structed by the interaction of domains related to physical appearance and athletic competence, which is referred to by the authors as presentation of self-concept.
Comparison between boys and girls showed signiicant diferences in the BEH, PHY and FRE domains, but only in the normal weight and over-weight groups, i.e., the perception of self-concept is similar in obese boys and girls. Another curious inding were the lower scores in girls, except for BEH. his result may be explained by the fact that girls’ perception of body image and anxiety is more inluenced by society when compared to boys, i.e., body image idealization is stronger for girls than boys19.
Within this line of research, Yanpinget al.20 investigated the body image perceptions of 9,100 Chinese children and young adolescents with a chronological age of 3 to 15 years and observed signiicant diferences between genders and within the age groups studied. Another study evalu-ated the association between physical activity and self-concept scores. he results showed a negative association between body fat percentage and self-concept scales. A positive association was observed between physical activity and self-concept scores in girls21.
In a study entitled “Are overweight children unhappy?”22, 864 children (mean age of 8.4 years) from 13 public schools in North Carolina, USA, were analyzed regarding depressive symptoms and overweight concerns. As results, no correlation between BMI and depressive symptoms was ob-served in boys, but there was a modest correlation in girls. Furthermore, no signiicant correlations were observed for boys and girls between the variables BMI and overweight concept.
he results reported in the study of Erickson et al.22 demonstrated a modest correlation between self-concept variables and overweight in girls. hese results were also observed in the study of Israel and Ivanova23, who found no diference in the three self-esteem dimensions studied, but girls always reported lower physical and social self-esteem than boys.
Obesity in children and adolescents Serassuelo et al.
irrespective of gender. Age was found to be a mediator of this process, with increasing age exerting a negative efect on the perception of self-concept.
Speciically, obese boys were more likely to develop a negative percep-tion in the BEH and FRE domains when compared to the normal weight group. On the other hand, girls were more likely to develop a negative perception in the INT, POP and HAP domains. hese results point to an impact of obesity on the perceptions of obese youngsters in the emotional and social spheres. Similar results have been reported by Assunção et al.4 who observed an impact of the acquisition of obesity during adolescence. Young people who became obese at 15 years, but were classiied as normal weight at 11 years, had greater behavioral and emotional problems.
Understanding the implications of these phenomena is necessary, but without dissociating the psychological, social and physiological phenomena that guide this phase of life which is characterized by inite transforma-tions from adolescence to adulthood. he preferences of society for a “slim” body are central to the etiology of the development of psychological and eating disorders, and this can be identiied in the valorization of the body instead of other characteristics24. As an example, this author highlights ethnic issues in which young people of the same age, but from diferent cultures, may be more or less likely to develop problems caused by weight gain and may also experience diiculty in itting current beauty standards.
In this line of thought, sociocultural inluences, particularly the media, play an important role in the construction of self-concept. Family, siblings and friends are part of the process and are dependent on social culture25.
A literature review26 investigated the impact of excess body weight on psychological characteristics of the subject and showed that age, gender and skin color, in addition to sociocultural issues, afect the results in the diferent studies proposed in the literature. Analysis of this large number of studies showed that there is a negative association between excess weight and behavioral issues, making it clear that in many cases the dependent variable, obesity, becomes a coadjuvant and other characteristics assume a central position in the process.
Considering the limitations of the study, i.e., its cross-sectional design and the lack of data about family context, the results corroborate the hy-pothesis of an association between obesity and the psychosocial behavior of young people.
CONCLUSION
REFERENCES
1. Swallen KC, Reither EN, Haas SA, Meier AM. Overweight, obesity, and health-related quality of life among adolescents: the national longitudinal study of ado-lescent health. Pediatrics 2005;115(2):340-7.
2. Scott KM, Brufaerts R, Simon GE, Alonso J, Angermeyer M, Girolamo G, et al. Obesity and mental disorders in general population: results from the world mental health surveys. Int J Obes 2008;32(1):192-200.
3. Griiths LJ, Dezateux C, Hill A. Is obesity associated with emotional and behavioral problems in children? Findings from the Millennium Cohort Study. Int J Pediatr Obes 2011;6(2-2):e423-32.
4. Assunção MCF, Muniz LC, Schäfer AA, Meller FO, Carús JP Quadros LCM, et al. Tornar-se obeso na adolescência pode trazer consequências à saúde mental? Cad Saúde Pública 2013;29(9):1859-66.
5. Schilder P,A Imagem do corpo: as energias construtivas da psique. São Paulo: Martins Fontes; 1999.
6. Novaes JV, O intolerável peso da feiúra. Rio de Janeiro: Garamond; 2006.
7. Russo R. Imagem corporal: construção através da cultura do belo. Movimento & Percepção 2005;5(6):80-90.
8. Suehiro ACB, Rueda FJM, Oliveira EZ, Pacanaro SV. Avaliação do autoconceito no contexto escolar: análise das publicações em periódicos brasileiros. Psicol Cienc Prof 2009;29(1):18-29.
9. Serassuelo JH, Bacarin DS, Ronque ERV, Oliveira SRS, Simões AC. A percepção do autoconceito e sua inluência no desempenho motor em crianças e adolescentes. Rev Educ Física /UEM 2012;23(1):15-23
10. Ricciardelli L, McCabe M. Children’s body image concerns and eating disturbance: a review of the literature. Clin Psychol Rev 2001;21(3);325-44.
11. Jay, M. Childhood obesity is not phat. J Pediatr 2004;144(5):A1.
12. Gordon CC, Chumlea WC, Roche AF. Stature, recumbent length, weight. In: Lohman TG, Roche AF, Martorel R, editors. Anthropometric standardizing refer-ence manual. Champaign, Human Kinetics; 1988. p.3-8.
13. Cole TJ, Bellizzi MC, Flegal KM, Dietz HW. Establishing a standard deini-tion for child overweight and obesity worldwide: internadeini-tional survey. BMJ 2006;320(6);1240-45.
14. ABEP - Associação brasileira de empresas de pesquisa. Dados com base no levan-tamento socioeconômico 2010 – IBOPE, 2010. Available at: <www.abep@abep. org [2013 Jul 10].
15. Piers EV,Harris DB, Herzberg DS. Harris children’s self-concept scale – Piers-Harris 2. Los Angeles: Western Psychological Services, 2002.
16. Tamayo A, Campos APM, Matos DR, Mendes GR, Santos JB, Carvalho NT. A in-luência da atividade física regular sobre o autoconceito. Estud Psicol 2001;6(2):157-65.
17. Faria L. Desenvolvimento do autoconceito físico nas crianças e nos adolescentes. Aná Psicológica 2005;23(4)361-71.
18. Song IS, Hattie J. Home environment, self-concept and academic achievement: A causal modeling approach. J Educ Psychol 1984;76(6):1269-81.
19. Hargreaves DA, Tiggemann M. Idealized media images and adolescent body image: “comparing” boys and girls. Body Image 2004;1(4):351-61.
20. Yanping L, Xiaoqi H, Wenjun M, Jin W, Guansheng M. Body image perceptions among Chinese children and adolescents. Body Image 2005;2(2)91-103.
Obesity in children and adolescents Serassuelo et al.
Corresponding author
Helio Serassuelo Junior Universidade Estadual de Londrina Centro de Educação Física e Esporte Rodovia Celso Garcia Cid, Pr 445 Km 380, Campus Universitário Cx. Postal 10.011, CEP 86.057-970, Londrina, PR, Brasil.
E-mail: [email protected]
22. Erickson SJ, Robinson TN, Haydal FK, Killen JD. Are overweight children unhappy? Arch Pediatr Adolesc Med 2000;154(9):931-5.
23. Israel AC, Ivanova M. Global and dimensional self-esteem in preadolescent and early adolescent children who are overweight: age and gender diferences. Int J Eating Disord 2002;31(4):424-29.
24. Littlewood R. Commentary: globalization, culture, body image and eating disor-ders. Cult Med Psychiatry 2004;28(4):597-602.
25. McCabe MP, Ricciardelli LA, Ridge D. “Who thinks I need a perfect body?” Per-ceptions and internal dialogue among adolescents about their bodies. Sex Roles 2006;55(5-6):409-19.