RBCDH
Licence Creative Commom
CC
1 Universidade Federal de Santa Catarina. Programa de Pós--Graduação em Educação Física. Florianópolis, SC. Brasil.
2 Universidade do Estado de Santa Catarina. Faculdade de Educação Física. Florianópolis, SC. Brasil.
3 Universidade Federal de Santa Catarina. Programa de Pós-Gradu-ação em Nutrição. Florianópolis, SC. Brasil.
Received: 27 July 2012 Accepted: 12 November 2012
Sensitivity and speciicity of body mass
index-based classiication systems for
overweight in children 7-10 years old
Sensibilidade e especiicidade dos sistemas de
classiicação para sobrepeso baseados no índice de
massa corporal em crianças de 7-10 anos de idade
Danielle Biazzi Leal1,2
Filipe Ferreira da Costa1
Maria Alice Altenburg de Assis1,3
Abstract – he objective of this study was to compare the sensitivity and speciicity of BMI-based classiication systems for detecting excess body fat in schoolchildren. A total of 2,795 schoolchildren aged 7 to 10 years were examined. Excess body fat was deined as the standardized residuals of sum of three skinfolds thickness ranking at or above the 90th percentile. he international BMI-based systems recommended by the Interna-tional Obesity Task Force (IOTF) and the World Health Organization (WHO-2007) were evaluated on the basis of their sensitivity and speciicity for detecting excess body fat and compared with a national BMI reference (Brazil-2006). he positive (LR+) and negative (LR-) likelihood ratios analysis was also used to compare the diagnostic accuracies of the three BMI criteria. he three classiication systems presented moderately high sensitivity (78.4-98.6%) and speciicity (75.9-91.6%) for both genders. Overall, the three classiica-tion systems showed both LR+ and LR- values consistent with a diagnosis of moderate evidence for overweight (LR+ above ive and LR- below 0.2). he results showed that the three BMI classiication systems can be used as screening instruments of excess body fat. However, the performance of the Brazil-2006 classiication system was superior because it showed the best balance between the diagnostic accuracy indices.
Key words: Adiposity; Body mass index; Children; Sensitivity and Speciicity.
BMI Classiication systems in the identiication of body fat Leal et al.
INTRODUCTION
Several nutritional status classiication systems of children and adolescents have been used to estimate the frequency of individuals at nutritional risk for having elevated body mass. he main issues that underlie the use of the Body Mass Index (BMI) to assess the nutritional status of people under 20 years old refer to the use of international or national reference population and the determination of critical values that separate healthy individuals from the unhealthy ones.
he evidences of the irst issue of using these references to assess the nutritional status of children and adolescents in each country indicate that the use of international references can cause distortions if the BMI does not have the same properties in both populations1. Critical values of the
classiication systems based on BMI-for-age used in many countries have been confronted with reference measurements for body fat2. In the absence
of a “gold standard” to measure body fat content, such as multicomponent models, these studies have typically used indirect methods (e.g. bioimped-ance, skinfolds) to deine the proportion of individuals with excess body fat on the basis of these measurements.
Previous studies on the diagnostic accuracy of BMI-based classiication systems when screening individuals with excess body fat have used statisti-cal analyses such as sensitivity and speciicity3-6, area under the Receiver
Operating Characteristic (ROC) curve7-10, and likelihood ratio7,10,11. In most
studies, a signiicantly higher sensitivity was reported for national refer-ences when compared with the referrefer-ences of the International Obesity Task Force (IOTF)3-5,7,8 or of the World Health Organization (WHO-2007)5, and
the opposite for speciicity3,5,8. Other studies have reported similar values
of speciicity between the IOTF reference and national reference data4,7.
Guidelines for treating and preventing pediatric obesity published by experts in the area have recommended the use of the BMI national refer-ence data to assess overweight and obesity in children and adolescents1,12.
herefore, the objective of this study was to evaluate the diagnostic accuracy of BMI reference values proposed for Brazilian children and adolescents (Brazil-2006)13 in discriminating excess body fat in a representative sample
of schoolchildren from Florianópolis-SC and compare it with the references internationally recommended by IOTF14 and WHO-200715.
METHODOLOGICAL PROCEDURES
Sample
his is a cross-sectional study with a probability sample of 7-10 year old schoolchildren from elementary schools in the city of Florianópolis (Santa Catarina). he study was conducted from September to November 2002. Sampling details can be found in another publication16. In summary, a
of the family. his article covers the measures of weight, height and three skinfolds (triceps, subscapular, and medial calf) of the children.
Of the 3,522 children selected in irst to fourth grade from elementary schools, the data of 209 were excluded because they did not have the age range of the study (<7.0 and >10.0 years), and another 377 were excluded due to the lack of information (child was absent or ill on the day of anthro-pometric assessment or refused to participate in the study). Parents signed a term of informed consent for their children to participate in this study, which was approved by the Ethics and Human Research Committee of the Federal University of Santa Catarina (protocol No. 037/02).
Anthropometric Measurements
he administrative department of each school provided information on age and gender. he BMI and the sum of three skinfolds thickness (ΣSFT) were selected to assess the nutritional status of the participants. he meas-urements of weight, height, and skinfold thickness were taken by trained evaluators using standard techniques recommended by Lohman et al.17
An-thropometric measurements were done with the children barefoot, wearing light clothes. Weight was measured by a portable digital scale with a capacity of up to 180 kg (MARTE, model PP), and height was measured with a tape measure attached to a wall without a baseboard. he BMI was calculated using the body weight (in kg) divided by height (in meters) squared.
he skinfold thickness measurement was conducted on three points on the body: triceps, subscapular, and medial calf using skinfold calipers (Cescorf) on the right side of the body. Measurements were performed twice and a third measurement was performed if skinfolds difered more than 2 mm. he average of the readings at each point or close to two readings was used for the analyses.
Due to the importance of age in body fat variation, values of the ΣSFT were modeled against age polynomials (age in full years, age2, and age3)
through the linear regression model weighted by the inverse of the variance. Using the model with the highest Pearson coeicient (R2), standardized
BMI Classiication systems in the identiication of body fat Leal et al.
same trend when considering the three critical values for excess body fat (data not shown). Although we are unsure whether 10% of the measure of body fat speciically identiies children with higher medical complications or health risks related to excess body fat, it is a statistical deinition which is consistent with other practices in pediatrics, and has been employed in previous studies9,10,18,19.
Statistical Analysis
Individuals were classiied as overweight (including obesity) according to three BMI-based classiication systems: IOTF, WHO-2007, and Brazil-2006. Excess body fat was deined based on the value of the 90th percentile of the body fat reference measurement. Sensitivity was deined as the percentage of children with excess body fat (children in the top 10% of body fat distri-bution based on ΣSFT-standardized residuals) classiied as overweight by BMI. Speciicity was deined as the percentage of children without excess body fat (children not in the top 10% of body fat distribution based on ΣSFT-standardized residuals) classiied as non-overweight by BMI.
Positive [sensitivity/(1-speciicity)] and negative [(1-sensitivity)/speci-icity] likelihood ratio stratiied by gender were calculated to express how many times more (or less) likely to ind a result of a test in sick people compared to those who do not have the disease. In the context of this study, it indicated how many times more likely is the diagnosis (with or without overweight) according to the three criteria of the BMI in individuals with excess body fat compared to those without excess body fat. Positive likeli-hood ratio (LR+) above 10 and negative likelilikeli-hood ratio (LR-) below 0.1 has provided diagnostics with convincing evidences, while values above ive and below 0.2 indicate moderate evidences of diagnosis20.
he level of signiicance was set at p<0.05. Statistical analyses were performed using SPSS 10.0 (Statistical Package for Social Sciences) and STATA version 10.0 (StataCorp, Lakeway Drive College Station).
RESULTS
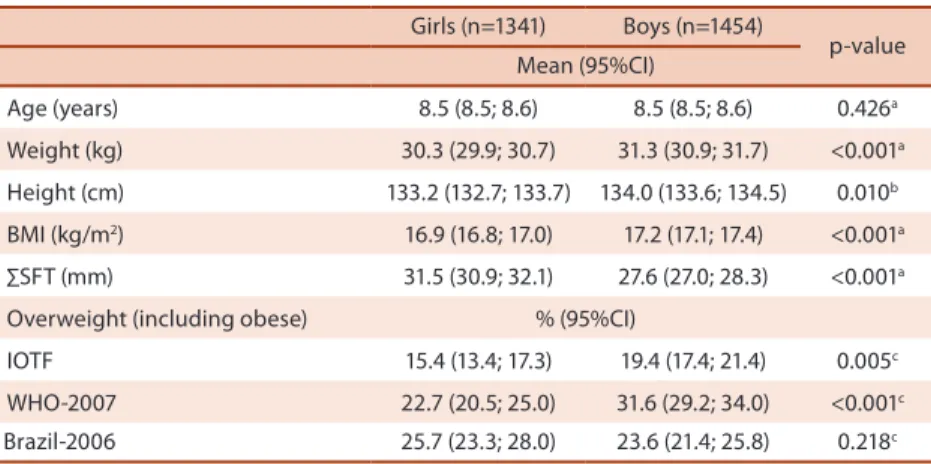
he anthropometric characteristics of the individuals and the prevalence of overweight (including obesity) according to the references analyzed are shown in Table 1, stratiied by gender. Compared to girls, boys were signii-cantly taller, heavier, and had a higher mean BMI. Girls had a signiisignii-cantly higher mean of the ΣSFT than boys. he lower frequencies of overweight were obtained with the IOTF reference for both genders. According to the IOTF and WHO-2007 references, boys were signiicantly more likely than their female counterparts to be overweight. No statistical diference was observed between the genders for overweight prevalence according to the Brazil-2006 reference.
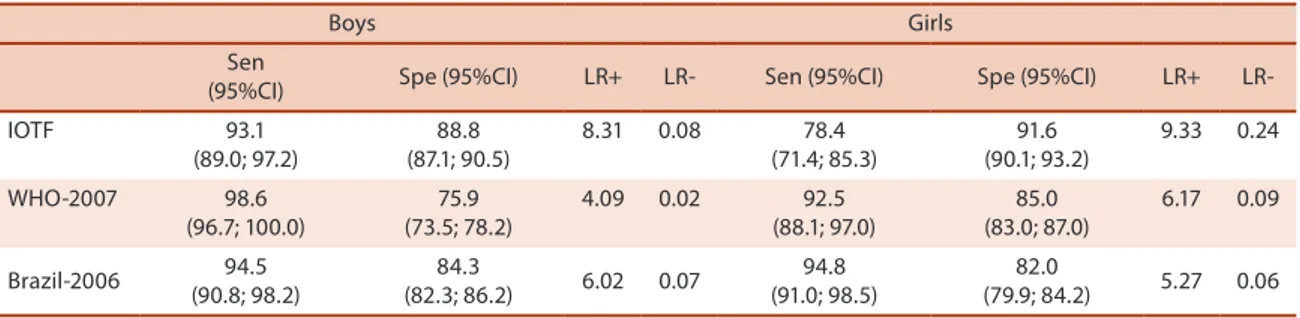
both genders. he speciicity of the WHO-2007 cut-ofs was moderate for boys (75.9%). When comparing the genders, the BMI cut-ofs , particularly those of the WHO-2007 and IOTF references, showed better sensitivity in boys and better speciicity in girls, whereas the Brazil-2006 reference showed otherwise. he IOTF classiication showed statistically signiicant diferences between genders for diagnostic sensitivity and the classiica-tion of WHO-2007 for speciicity. In contrast, no statistically signiicant diference between genders for sensitivity and speciicity was found when the Brazil-2006 classiication was used.
Table 1. Anthropometric measurements and frequencies of overweight (including obesity) using three references of BMI-for-age among 2795 schoolchildren, stratiied by gender
Girls (n=1341) Boys (n=1454)
p-value Mean (95%CI)
Age (years) 8.5 (8.5; 8.6) 8.5 (8.5; 8.6) 0.426a
Weight (kg) 30.3 (29.9; 30.7) 31.3 (30.9; 31.7) <0.001a
Height (cm) 133.2 (132.7; 133.7) 134.0 (133.6; 134.5) 0.010b
BMI (kg/m2) 16.9 (16.8; 17.0) 17.2 (17.1; 17.4) <0.001a
∑SFT (mm) 31.5 (30.9; 32.1) 27.6 (27.0; 28.3) <0.001a
Overweight (including obese) % (95%CI)
IOTF 15.4 (13.4; 17.3) 19.4 (17.4; 21.4) 0.005c
WHO-2007 22.7 (20.5; 25.0) 31.6 (29.2; 34.0) <0.001c
Brazil-2006 25.7 (23.3; 28.0) 23.6 (21.4; 25.8) 0.218c
BMI: Body mass index; ∑SFT: sum of three skinfolds thickness; IOTF: International Obesity Task Force; WHO: World Health Organization; 95%CI: 95% Conidence interval; a Student’s t test for equal variances; b Student’s t
test for diferent variances; c Chi-square test.
BMI Classiication systems in the identiication of body fat Leal et al.
DISCUSSION
he results of this study suggest that the three BMI classiication systems have good performance in identifying excess body fat in children aged seven to ten years. However, the cut-ofs of the national criterion showed the best balance between the diagnostic accuracy indices.
he classiication systems based on BMI-for-age analyzed by previous studies showed diferences in performance between genders. In general, better sensitivity was found for boys and better speciicity for girls5,8,11,18,21.
Several studies compared the diagnostic accuracy between national and international BMI references, and found better sensitivity using the national references5,7,8,21,24. he present study showed that the use of critical values for
classifying overweight using the Brazil-2006 reference had better diagnostic sensitivity than the IOTF international reference (94.8% vs. 78.4% for girls and 94.5% vs. 93.1% for boys).
For speciic comparisons with other observations we screened the literature to identify studies reporting sensitivity and speciicity values of BMI cut-ofs of at least one of the references used here and conducted in a population with a similar age to that in this study. In Brazil, the diagnostic accuracy of the same three classiication systems for overweight used in the present study was assessed in 1570 schoolchildren aged seven to 12 years in the city of Paraíba. he sensitivity and speciicity, using the body fat percentage as reference criteria (estimated by the sum of skinfolds) for IOTF were 86.3% and 94.7% for boys; 85.3% and 90.7% in girls, respectively. For WHO-2007, these igures were 64.7% and 97.9% in boys; 47.7% and 97.8% in girls. Using the Brazil-2006 classiication, sensitivity and speciicity values were 90.6% and 92.0% in boys; 97.2% and 84.8% in girls, respectively5.
In Switzerland, a study done with a national sample of children aged six to 12 years showed similar sensitivity and speciicity values for the IOTF criteria when compared with the results of the present study: using the body fat percentage, estimated from skinfolds, as reference standard, the IOTF sensitivity and speciicity were respectively 78.8% and 94.4% in boys, 83.8% and 92.3% in girls9. In a sample of British children seven years
old, the sensitivity and speciicity of the IOTF cut-ofs for overweight, using the top 5% of the distribution of body fat percentage (estimated
Table 2. Values of sensitivity, speciicity, and likelihood ratios for excess body fat for BMI-based references
Boys Girls
Sen
(95%CI) Spe (95%CI) LR+ LR- Sen (95%CI) Spe (95%CI) LR+
LR-IOTF 93.1
(89.0; 97.2)
88.8 (87.1; 90.5)
8.31 0.08 78.4
(71.4; 85.3)
91.6 (90.1; 93.2)
9.33 0.24
WHO-2007 98.6
(96.7; 100.0)
75.9 (73.5; 78.2)
4.09 0.02 92.5
(88.1; 97.0)
85.0 (83.0; 87.0)
6.17 0.09
Brazil-2006 94.5
(90.8; 98.2)
84.3
(82.3; 86.2) 6.02 0.07
94.8 (91.0; 98.5)
82.0
(79.9; 84.2) 5.27 0.06
studies may be explained by the children’s age, methods to measure body fat content, the deinition of cut-ofs for evaluation of excess body fat, and analytical approaches of the data.
he positive likelihood ratio had its highest values for the IOTF cut-ofs. he higher the value, the stronger the association between having a positive outcome for overweight and having excess body fat. A likelihood ratio of 9.33 means that for the cut-of of the IOTF reference, the chance of a positive result being true is almost ten times greater than the chance of it being false. he negative likelihood ratio had its most signiicant values for WHO-2007 in the case of boys and for cut-of of the Brazil-2006 reference for girls. he lower the value, the stronger the association between having a negative outcome for overweight and not having excess body fat. herefore, the three classiication systems showed both LR+ and LR- values consistent with moderate diagnostic evidence (LR+ above ive and LR- below 0.2). However, it is noteworthy that the LR+ of the WHO-2007 cut-ofs for boys (4.09) and LR- of the IOTF cut-ofs for girls (0.24) were borderline for what is considered ideal for public health interventions.
he inal choice of which classiication system should be adopted is conceptual, and includes issues related to ease of use, universal interpre-tation of results, and the ability of the cut-of values to predict the risk of future health problems. For international comparisons, the BMI references recommended by IOTF and WHO-2007 allows to identify prevalence rates globally acceptable and comparable. In Brazil, given the likely diferences in health risks related to certain BMI values between populations, the national reference is likely to be more appropriate.
Some of the important aspects of this study include the large sample size and the inclusion of the analysis of the likelihood ratio, which goes beyond sensitivity and speciicity. On the other hand, it should be noted that a reference measurement (gold standard) was not used for body fat due to the fact that this is a population-based study. he absolute meas-urement of skinfold thickness, despite the low reproducibility reported by other studies, is not based on predictive equations used to estimate the percentage of body fat, which are susceptible to errors26,27. Furthermore,
the use of standardized residuals of the measurement of skinfolds made this variable independent from the linear efect of age on variations in body fat. he skinfold thickness measurement has been used in other studies of diagnostic accuracy of the BMI as a reference measurement9,10,24,28,29.
CONCLUSION
BMI Classiication systems in the identiication of body fat Leal et al.
criteria the lower speciicity for boys. In addition, the performance of the Brazil-2006 classiication system proved to be more suitable for national trials that aim to identify overweight children with similar characteristics in this study because it showed the best balance among the diagnostic ac-curacy indices.
REFERENCES
1. Tomkins A. Measuring obesity in children: what standards to use? J Pediatr (Rio J) 2006;82(4):246-8.
2. Reilly JJ, Kelly J, Wilson DC. Accuracy of simple clinical and epidemiological deinitions of childhood obesity: systematic review and evidence appraisal. Obes Rev 2010;11(9):645-55.
3. Vieira ACR, Alvarez MM, Marins VMR, Sichieri R, Veiga GV. Accuracy of difer-ent body mass index reference values to predict body fat in adolescdifer-ents. Cad Saúde Pública 2006;22(8):1681-90.
4. Vitolo MR, Campagnolo PDB, Barros ME, Gama CM, Lopez FA. Evaluation of two classiications for overweight among Brazilian adolescents. Rev Saúde Pública 2007;41(4):653-6.
5. Silva KS, Lopes AS, Silva FM. Sensitivity and speciicity of diferent classiication criteria for excess weight in schoolchildren from João Pessoa, Paraíba, Brazil. Rev Nutr 2010;23(1):27-35.
6. Gläßer N, Zellner K, Kromeyer-Hauschild K. Validity of body mass index and waist circumference to detect excess fat mass in children aged 7-14 years. Eur J Clin Nutr 2011;65(2):151-9.
7. Neovius MG, Linné YM, Barkeling BS, Rossner SO. Sensitivity and speciicity of classiication systems for fatness in adolescents. Am J Clin Nutr 2004;80(3):597-603. 8. Fernandes RA, Rosa CSC, da Silva CB, Bueno DR, de Oliveira AR, Júnior IFF.
Desempenho de diferentes valores críticos de índice de massa corporal na iden-tiicação de excesso de gordura corporal e obesidade abdominal em adolescentes. Rev Assoc Med Bras 2007;53(6):515-9.
9. Zimmermann MB, Gübeli C, Püntener C, Molinari L. Detection of overweight and obesity in a national sample of 6–12-y-old Swiss children: accuracy and validity of reference values for body mass index from the US Centers for Disease Control and Prevention and the International Obesity Task Force. Am J Clin Nutr 2004;79(5):838-43.
10. Deurenberg-Yap M, Niti M, Foo LL, Ng SA, Loke KY. Diagnostic accuracy of an-thropometric indices for obesity screening among Asian adolescents. Ann Acad Med Singapore 2009;38(1):3-8.
11. Nichols SD, Cadogan F. BMI-based obesity cut-ofs and excess adiposity in a Carib-bean adolescent population of African origin. Eur J Clin Nutr 2009;63(2):253-8. 12. August GP, Caprio S, Fennoy I, Freemark M, Kaufman FR, Lustig RH, et al.
Pre-vention and treatment of pediatric obesity: an endocrine society clinical practice guideline based on expert opinion. J Clin Endocrinol Metab 2008;93(12):4576-99. 13. Conde WL, Monteiro CA. Body mass index cutof points for evaluation of nutrition-al status in Brazilian children and adolescents. J Pediatr (Rio J) 2006;82(4):266-72. 14. Cole TJ, Bellizzi MC, Flegal KM, Dietz WH. Establishing a standard deini-tion for child overweight and obesity worldwide: internadeini-tional survey. BMJ 2000;320(7244):1240-3.
15. de Onis M, Onyango AW, Borghi E, Siyam A, Nishida C, Siekmann J. Development of a WHO growth reference for school-aged children and adolescents. Bull World Health Organ 2007;85(9):660-7.
Corresponding author
Danielle Biazzi Leal Universidade Federal de Santa Catarina, Campus Universitário – Trindade.
Programa de Pós-graduação em Educação Física, Centro de Desportos, 88040-900 - Florianópolis. SC. Brasil E-mail: [email protected]
18. Fu WP, Lee HC, Ng CJ, Tay YK, Kau CY, Seow CJ, et al. Screening for childhood obesity: international vs population-speciic deinitions. Which is more appropri-ate? Int J Obes Relat Metab Disord 2003;27(9):1121-6.
19. Moreno LA, Blay MG, Rodríguez G, Blay VA, Mesana MI, Olivares JL, et al. AVENA-Zaragoza Study Group. Screening Performances of the International Obesity Task Force Body Mass Index Cut-Of Values in Adolescents. J Am Coll Nutr 2006;25(5):403-8.
20. Deeks JJ. Systematic reviews in health care: Systematic reviews of evaluations of diagnostic and screening tests. BMJ 2001;323(7305):157-62.
21. da Veiga GV, Dias PC. Anjos LA. A comparison of distribution curves of body mass index from Brazil and the United States for assessing overweight and obesity in Brazilian adolescents. Rev Panam Salud Pública 2001;10(2):79-85.
22. Yoo S, Lee S-Y. Kim K-N. Sung E. Obesity in Korean pre-adolescent school chil-dren: comparison of various anthropometric measurements based on bioelectrical impedance analysis. Int J Obes 2006;30(7):1086-90.
23. Oliveira FLC, Taddei JAAC, Escrivão MAMS, Cobayashi F, Barros ME, Vítolo MR, et al. Accuracy of obesity diagnosis in Brazilian adolescents: comparison of Cole et al and Must et al criteria with DXA percentage of fat mass. Nutr Hosp 2006;21(4):484-90.
24. Farias Júnior JC, Konrad LM, Rabacow FM, Grup S, Araújo VC. Sensitivity and speciicity of criteria for classifying body mass index in adolescents. Rev Saúde Pública 2009;43(1):53-9.
25. Reilly JJ, Dorosty AR, Emmett PM, Avon Longitudinal Study of Pregnancy and Childhood Study Team. Identiication of the obese child: adequacy of the body mass index for clinical practice and epidemiology. Int J Obes Relat Metab Disord 2000;24(12):1623-7.
26. Reilly JJ, Wilson J, Durnin JV. Determination of body composition from skinfold thickness: a validation study. Arch Dis Child 1995;73(4):305-10.
27. Roche AF, Siervogel RM, Chumlea WC, Webb P. Grading body fatness from limited anthropometric data. Am J Clin Nutr 1981;34(12):2831-8.
28. Chiara V, Sichieri R, Martins PS. Sensitivity and speciicity of overweight classiica-tion of adolescents, Brazil. Rev Saúde Pública 2003;37(2):226-31.