Body Mass Index as a Marker of Dyslipidemia in Children
Cláudia Cruz Lunardi e Édio Luiz Petroski
Universidade Federal de Santa Catarina, Florianópolis, SC - Brazil
Summary
Background: Obesity is very frequently associated with conditions such as dyslipidemia e diabetes.
Objective: To verify the diagnostic value of the cut-off points proposed by the International Obesity Task Force (IOTF) and Conde & Monteiro (C&M) for the screening and identification of dyslipidemia in children between 0 and 2 years of age.
Metods: The Body Mass Index (BMI) of 374 children of the school network of the city of Santa Maria-RS was ascertained. The children were selected in a stratified manner from a population of 4,083 children. Lipid levels (reference standard) were determined by means of analysis of total cholesterol (TC), LDL-C, HDL-C and triglycerides (TG). The cut-off points of the IOTF and C&M were used to classify the BMI. Descriptive statistics and analysis of sensitivity and specificity were employed.
Results: There was a statistical difference in excess weight prevalence between both proposals (24.7% and 28.6% for IOTF and C&M, respectively). A variation was observed in sensitivity (33% - 83%) and specificity (62% - 80%) between the cut-off points as to the detection of dyslipidemia. The percentage of false negatives was lower than the percentage of false positives.
Conclusion: The proposals may be used to screen elevated TC and LDL-C in male individuals. Either the IOTF or the C&M classification may be used to identify subjects without dyslipidemia, as these proposals presented high specificity. (Arq Bras Cardiol 2009;93():20-24)
Key words: Body mass index; students; sensitivity and specificity, dyslipidemia.
Mailing address: Cláudia Cruz Lunardi •
SCRN 704/705 BL D Ent 26 / 401, Asa Norte, 70.730-640, Brasília, DF - Brazil
E-mails: [email protected], [email protected], [email protected]
Article sent on October 09 2007; Revised article sent on November 7 2007; Accepted on February 26 2008.
Introduction
Obesity has great impact on cardiovascular diseases because it is very frequently associated with conditions such as dyslipidemia, arterial hypertension, insulin resistance and diabetes1,2. Excess weight in children has been rising to epidemic levels and seems to be the phenomenon that presents the greatest influence on negative changes in the lipid profile (elevated levels of total cholesterol – TC, triglycerides – TG, low density cholesterol – LDL-C and low levels of high density cholesterol – HDL-C) in children and adolescents3,4.
Epidemiologic studies have traditionally assessed excess weight5 by means of the body mass index (BMI)6,7. BMI curves for children and adolescents have been proposed by the International Obesity Task Force(IOTF), and were modeled based on a population aggregate from different countries, including Brazil8. Based on these curves, the identification of children and adolescents at risk for overweight and obesity would have as cut-off points BMIs of 25 and 30 kg/m² respectively, both adapted for each age group and gender.
Conde & Monteiro9 (C&M) have recently established BMI values for Brazilian children e adolescents. The data was extracted from the National Survey on Nutrition and Health of 1989 which was designed to verify the population’s health and nutritional conditions. Just like IOTF, C&M used the critical values of 25 and 30 kg/m² for overweight and obesity respectively in adulthood.
The concern about establishing the sensitivity and specificity of BMI relative to dyslipidemia is justified because in theory BMI cut-off points should identify the moment when the risk to health increases as obesity begins8. Knowledge of these reference values is particularly useful to detect the risk of developing diseases, both relative to nutritional surveillance and population-based studies of diagnosis10, with the advantage that it does not require invasive measures.
Therefore this study was designed to verify if the cut-off points proposed by IOTF and C&M can be used to screen and identify dyslipidemia in children aged between 10 and 12 years.
Methods
collections were carried out between August and December 2005.
The study was approved by the Research Ethics Committee of the Federal University of Santa Maria (UFSM) (CAAE 0018.0.243.000-05). The free and informed consent term (TCLE) was signed by the children’s parents or guardian.
The blood collection was carried out using a technique of the Clinical Analysis Laboratory of UFSM between 7:30 and 10 a.m. Four milliliters of blood were collected by venous puncture with vacuum tubes after 12 hours fast and placed in dry tubes for biochemical tests. The tests were conducted using the enzymatic colorimetric dosing method (TC, HDL-C and TG), using Hitachi’s 917 Automatic Analyzer (Boehringer Mannhein). LDL-C was calculated using the following formula: [(TCl – HDL-C)-(TG/5)].
Body mass (BM) and height (H) measurements were taken by one single evaluatork. A scale, of the Plena brand, with a resolution of 100 g and a metal stadiometer, of the Cardiomed brand, with a resolution of 1 cm were used.
Based on BM and H scores, the BMI was calculated as follows: BMI (kg/m-2) = BM (kg) / H2 (m).
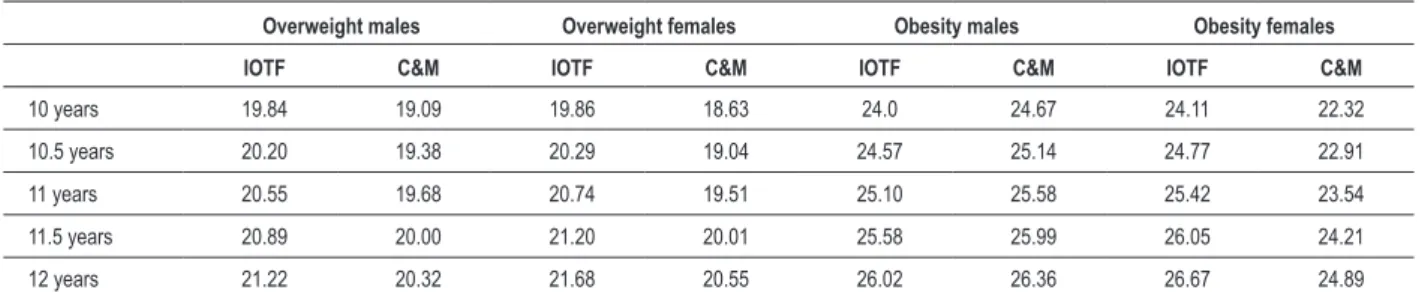
To analyze sensitivity and specificity the IOTF and C&M cut-off points were adopted (tab.1). These values correspond to the BMI reference values of 25 and 30 kg/m², adapted for age and gender, to identify overweight and obesity, respectively8,9. Blood analyses of TC, HDL-C, LDL-C and TGl were considered as the reference standards for the detection of dyslipidemia. Because the IOTF and C&M use different nomenclatures for overweight, the term excess weight will be used in this study to refer to “overweight+obesity”.
In order to categorize IOTF’s proposal, children from 10 to 10.25 years were considered as being 10 years old; 10.26 to 10.75 years as 10.5 years old; 10.76 to 11.25 years as 11 years old; 11.26 to 11.75 years as 11.5 years old and 11.76 to 12 years as 12 years old. As for C&M, in which classification is done in months, we adopted the same criterion: 10 to 10.25 years as 120.5 months; 10.26 to 10.75 years as 126.5 months; 10.76 to 11.25 years as 132.5 months; 11.26 to 11.75 years as 138.5 months and 11.76 to 12 years as 144.5 months.
In order to classify lipid levels, the reference values suggested by the 3rd Brazilian Guidelines on Dyslipidemia12 for children and adolescents (2 to 19 years of age) were
considered. The desirable values are: TC <170 mg/dl, HDL
Table 1 -Cut-off points (kg/m²) suggested by IOTF10 and C&M11 according to age group and gender
Overweight males Overweight females Obesity males Obesity females
IOTF C&M IOTF C&M IOTF C&M IOTF C&M
10 years 19.84 19.09 19.86 18.63 24.0 24.67 24.11 22.32
10.5 years 20.20 19.38 20.29 19.04 24.57 25.14 24.77 22.91
11 years 20.55 19.68 20.74 19.51 25.10 25.58 25.42 23.54
11.5 years 20.89 20.00 21.20 20.01 25.58 25.99 26.05 24.21
12 years 21.22 20.32 21.68 20.55 26.02 26.36 26.67 24.89
-C >35 mg/dl, LDL -C <110 mg/dl and TG <130 mg/dl;
borderline values (classified as normal in this study) for TC between 170 and 199 mg/dl; LDL-C between 110 and 129 mg/dl; elevated values for TC > 200 mg/dl; LDL-C > 130 mg/l; and TG > 130 mg/dl.
To analyze the sensitivity and specificity of indicators of excess fat (BMI) relative to altered lipid levels, cases of false positive, false negative, true negative and true positive have been considered (fig.1).
The data were submitted to the Kolgomorov-Smirnov test to test normality. Descriptive statistics (mean, standard deviation, minimum and maximum values) and data frequency were used. Possible differences between the genders were assessed using the “t” test for independent samples in view of the normality of data. The chi-square test was used to verify possible differences between the prevalences of excess weight. BMI cut-off points in the screening for lipid alterations were proposed using the ROC (Receiver Operating Characteristic) curve analysis. A confidence interval of 95% was considered. The analyses were conducted in the SPSS Version 10.0 statistics package.
This study was funded by the Research Support Fund of the Federal University of Santa Maria (GAP nº 017574).
Results
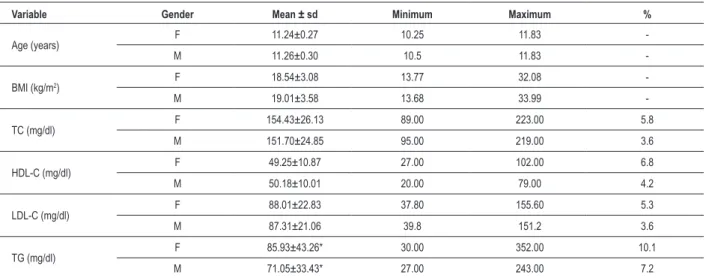
The study assessed 374 children, of which 208 were girls (56%) and 166 were boys (44%). Table 2 provides the descriptive characteristics of the sample including mean, standard deviation, minimum and maximum values of the variables analyzed and the prevalence of lipid alterations. Upon analyzing the prevalences of overweight and obesity relative to these authors, we verified that, according to IOTF, 14.7% and 5.1% of the subjects assessed were overweight or obese, respectively. These percentages differed statistically
(p<0.05) from C&M’s proposal, in which 21.4% of the subjects
presented overweight and 7.2% presented obesity. A greater occurrence of excess weight was found when the C&M cut-off points (28.6%) were compared with the IOTF (19.8%) cut-off points. No case of low weight was observed in either one of the classifications.
Table 2 – Descriptive data of the lipid proile of children in Santa Maria, RS, 2005
Variable Gender Mean ± sd Minimum Maximum %
Age (years) F 11.24±0.27 10.25 11.83
-M 11.26±0.30 10.5 11.83
-BMI (kg/m2) F 18.54±3.08 13.77 32.08
-M 19.01±3.58 13.68 33.99
-TC (mg/dl) F 154.43±26.13 89.00 223.00 5.8
M 151.70±24.85 95.00 219.00 3.6
HDL-C (mg/dl) F 49.25±10.87 27.00 102.00 6.8
M 50.18±10.01 20.00 79.00 4.2
LDL-C (mg/dl) F 88.01±22.83 37.80 155.60 5.3
M 87.31±21.06 39.8 151.2 3.6
TG (mg/dl) F 85.93±43.26* 30.00 352.00 10.1
M 71.05±33.43* 27.00 243.00 7.2
Where: *Signiicant statistical difference (p<0.05), “t” test for independent samples; sd - standard deviation; % - prevalence of alterations.
Figure 1 -Model for sensitivity and speciicity analyses of BMI anthropometric indicators relative to lipid levels, where: sensitivity (%)= A/(A+C)x100 and speciicity
(%)=D(/B+D)x10013.
According to the ROC curve, the ideal cut-off points (best association between sensitivity and specificity) to identify lipid alterations for females and males respectively in the age group at hand are: TC (16.7 and 19.3 kg/m²); HDL-C (19.9 and 14.0 kg/m²); LDL-C (18.7 and 19.3 kg/m²); and TG (19.3 and 19.3 kg/m²). For females, the cut-off points suggested for LDL-C and TC are substantially lower than those proposed for HDL-C and TG, as well as than the normal values of IOTF and C&M. In males, there was greater variability, especially for HDL-C which is lower than other serum indicators.
Discussion
The consequences of elevated cholesterol in addition to other risk factors constitute a public health problem worldwide. From a clinical point of view, early surveillance and detection of risk factors associated with dyslipidemia are key factors for
preventive actions especially those relative to excess weight in children. Excess weight in children can be controlled by helping children achieve and maintain adequate weight for height, gender and age through primary care actions6.
This study used the IOTF and C&M proposals to assess the nutritional condition of children. Among the classifications
there was a statistically significant difference (p<0.05) between
the prevalences of overweight and obesity . According to IOTF, 14.7% and 5.1% of the subjects were classified as overweight and obese respectively; according to C&M these prevalences increase to 21.4% and 7.2%.
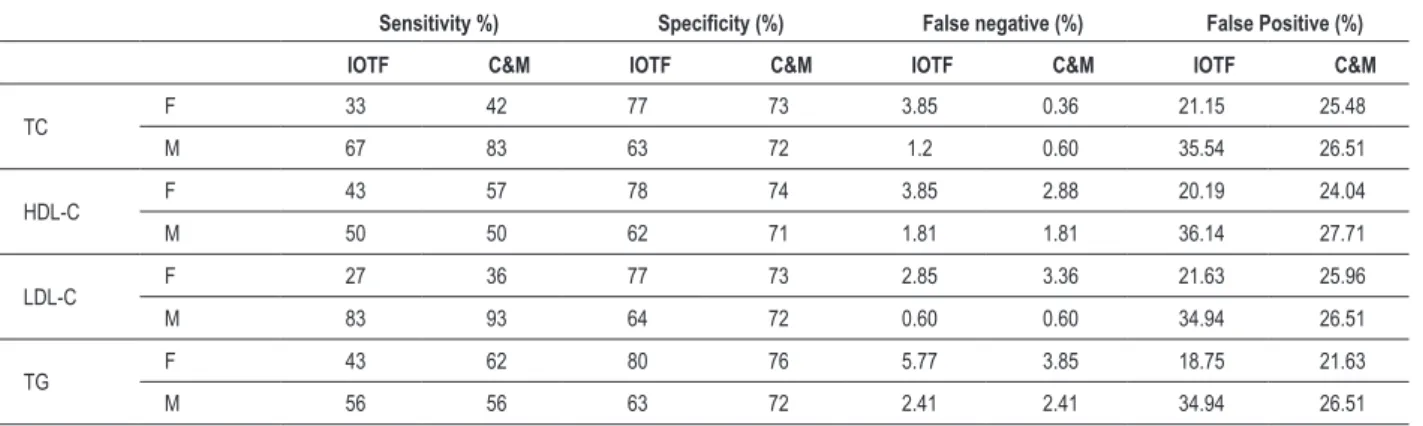
Table 3 – Sensitivity, speciicity, false positive (FP) and false negative (FN) of BMI values proposed by IOTF e C&M concerning lipid levels of children aged between 10 and 12 years
Sensitivity %) Speciicity (%) False negative (%) False Positive (%)
IOTF C&M IOTF C&M IOTF C&M IOTF C&M
TC F 33 42 77 73 3.85 0.36 21.15 25.48
M 67 83 63 72 1.2 0.60 35.54 26.51
HDL-C F 43 57 78 74 3.85 2.88 20.19 24.04
M 50 50 62 71 1.81 1.81 36.14 27.71
LDL-C F 27 36 77 73 2.85 3.36 21.63 25.96
M 83 93 64 72 0.60 0.60 34.94 26.51
TG F 43 62 80 76 5.77 3.85 18.75 21.63
M 56 56 63 72 2.41 2.41 34.94 26.51
years) and Brasília7 (6 to 10 years) (11.72% and 11.05% respectively). However, the studies conducted in São Paulo and Rio de Janeiro used different protocols as compared with those used in this study; Pelotas and Brasília used the IOTF classification.
Varied sensitivity (33% to 83%) and specificity (62% to 80%) was observed in both proposals analyzed (tab.3). The C&M classification presented sensitivity values above those of IOTF’s for both genders, demonstrating that the C&M proposal presents greater discrimination power to identify ill subjects (with dyslipidemia).
As for specificity, the IOTF classification presented greater diagnostic value for females while C&M worked better for males as to the detection of non-ill subjects.
FN values were low for IOTF and C&M, thus allowing for the verification that there is incidence of dyslipidemic subjects (ill) who are considered eutrophic. There was a high number of FP, thus suggesting a trend towards the occurrence of dyslipidemia in non-ill subjects. The possibility of classifying subjects as ill when they are actually not so (FP) is a limitation of both the IOTF and C&M proposals. However, this wouldn’t present a great problem, since healthy children could participate, together with ill ones in preventive educational programs.
This study verified the diagnostic value of the cut-off points proposed by IOTF and C&M as to the identification of dyslipidemia in children aged between 10 and 12 years. Early diagnosis is important since cardiovascular risk factors are characteristics that tend to persist until adulthood17. Screening tests should be of low cost, easy to apply, non-invasive and with high sensitivity (to minimize the number of false negatives). Diagnostic tests, however, should present higher specificity18.
In this study, according to the IOTF classification, when used as a screening method for TC and LDL-C in males, only one child out of 100 was wrongly classified (FN). As a dyslipidemia diagnostic method in females, it classified 20 children as ill when they are actually not ill (FP). C&M, in turn, classified just two individuals wrongly relative to TC
and LDL-C for males and four female children relative to altered TG (screening power - FN).
In view of the above, and following recommendations proposed by Tomkins19, the values recommended by C&M are recommended to implement planning and monitoring nationwide since the cut-off points are based on a Brazilian set of data and proved to be more sensitive and specific than the IOTF proposal as regards the detection of dyslipidemia.
There are still gaps in the literature relative to studies involving obesity, cardiovascular diseases and dyslipidemia in younger populations, especially as concerns screening and diagnostic methods. This study is a preliminary one as concerns the use of BMI as a dyslipidemia marker in children; however, the number of studies focusing on this will certainly increase because metabolic alterations and the consequences of obesity, which used to be evident only in adults, are increasingly seen in childhood and adolescence20. The detection of dyslipidemia in this age group is essential since the cholesterol level in children is a predictor of the cholesterol level in adults21.
This study also verified that both proposals can be used to screen elevated TC and LDL-C in males, since these proposals presented high sensitivity (67% to 97%) and low percentage of FN (0.6% to 1.2%), thus indicating that only one out of 100 children may be classified as non-ill when they are actually dyslipidemic. As concerns females, only C&M proved to have a good screening power, and this only for elevated TG.
In the diagnosis of subjects without dyslipidemia, both the IOTF and the C&M classification can be used since both present high specificity.
Acknowlegements
References
1. Kannel WB, Wilson PW, Nam BH, D’Agostino RB. Risk stratification of obesity as a coronary risk factor. Am J Cardiol. 2002; 90: 697-701.
2. Tonstad S, Hjermann I. A high risk score for coronary heart disease is associated with the metabolic syndrome in 40-year-old men and women. J Cardiovasc Risk. 2003; 10: 129-35.
3. Manios Y, Kolotourou M, Moschonis G, Sur H, Keskin Y, Kocaoglu B, et al. Macronutrient intake, physical activity, serum lipids and increased body weight in primary schoolchildren in Istanbul. Pediatr Int. 2005; 47 (2): 159-66.
4. Ballesteros MN, Cabrera RM, Saucedo MS, Aggarwal D, Shachter NS, Fernandez ML. High in take of saturated fat and early occurrence of specific biomarkers may explain the prevalence of chronic disease in northern Mexico. J Nutr. 2005; 135 (1): 70-3.
5. Grillo LP, Crispim SP, Siebert AN, Andrade ATW, Rossi A, Campos IC. Perfil lipídico e obesidade em escolares de baixa renda. Rev Bras Epidemiol. 2005; 8 (1): 75-81.
6. Coronelli CL, Moura EC. Hipercolesterolemia em escolares e seus fatores de risco. Rev. Saúde Públ. 2003; 37 (1): 24-31.
7. Giugliano R, Melo ALP. Diagnóstico de sobrepeso e obesidade em escolares: utilização do índice de massa corporal segundo padrão internacional. J Pediatr. 2004; 80 (2): 129-34.
8. Cole TJ, Bellizzi MC, Flegal KM, Dietz WH. Establishing a standard definition for child overweight and obesity worldwide: international survey. BMJ. 2000; 320: 1240-3.
9. Conde WL, Monteiro CA. Body mass index cutoff points for evaluation of nutritional status in Brazilian children and adolescents. J Pediatr (Rio J). 2006; 82 (4): 266-72.
10. Ferreira MG, Valente JG, Gonçalves-Silva RMV, Sichieri R. Acurácia da circunferência da cintura e da relação cintura/quadril como preditores de dislipidemias em estudo transversal de doadores de sangue de Cuiabá, Mato Grosso, Brasil. Cad Saúde Pública. 2006; 22 (2): 307-14.
11. Alvarez BR, Pavan AL. Alturas e Comprimentos. In: Petroski EL (ed). Antropometria: técnicas e padronizações. Porto Alegre: Palotti; 2003. p. 31-45.
12. Sociedade Brasileira de Cardiologia. III Diretrizes brasileiras sobre dislipidemias e diretrizes de prevenção da aterosclerose do Departamento de Aterosclerose da SBC. Arq Bras Cardiol. 2001; 77(supl 3): 1-191.
13. Massad E. A teoria bayesiana no diagnóstico médico. In: Massad E, Menezes RX, Silveira PSP, Ortega NRS. Métodos quantitativos em medicina. Barueri (SP): Manole; 2004. p.189-205.
14. Albano RD, Souza SB. Estado nutricional de adolescentes: “risco de sobrepeso” e “sobrepeso” em uma escola pública do Município de São Paulo. Cad Saúde Pública. 2001; 17 (4): 941-7.
15. Dutra CL, Araújo CL, Bertoldi AD. Prevalência de sobrepeso em adolescentes: um estudo de base populacional em uma cidade no sul do Brasil. Cad Saúde Pública. 2006; 22 (1): 151-62.
16. Anjos LA, Castro IRR, Engstrom EM, Azevedo AMF. Crescimento e estado nutricional em amostra probabilística de escolares no Município do Rio de Janeiro, 1999. Cad Saúde Pública. 2003; 19(supl 1): S171-S179.
17. Freedman DS, Khan LK, Serdula MK, Dietz WH, Srinivasan SR, Berenson GS. The relation of childhood BMI to adult adiposity: the Bogalusa Heart Study. Pediatrics. 2005; 115: 22-7.
18. Menezes AMB, Santos IS. Curso de epidemiologia básica para pneumologistas: 4ª parte: epidemiologia clínica. J Pneumol. 1999; 25 (6): 321-6.
19. Tomkins A. Measuring obesity in chidren:what standards to use? J Pediatr. 2006; 82 (4): 246-8.
20. Lima S, Arais R, Almeida R, Souza Z, Pedrosa L. Perfil lipídico e peroxidação de lipídios no plasma em crianças e adolescente com sobrepeso e obesidade. J Pediatr. 2004; 80(1): 23-8.
21. Brotons C, Riber A, Percih RM, Abrodos D, Magana P, Pablo S, et al. Worldwide distribution of blood lipids and lipoproteins in childhood and adolescence: a review study. Atherosclerosis. 1998; 139: 1-9.
Potential Conflict of Interest
No potential conflict of interest relevant to this article was reported.
Sources of Funding
This study was partially funded by Fundo de Incentivo a
Pesquisa da Universidade Federal de Santa Maria.
Study Association