Delivery Mode, Duration of Labor, and Cord
Blood Adiponectin, Leptin, and C-Reactive
Protein: Results of the Population-Based Ulm
Birth Cohort Studies
Chad A. Logan1, Larissa Thiel1, Rebecca Bornemann1, Wolfgang Koenig2, Frank Reister3, Hermann Brenner4, Dietrich Rothenbacher1, Jon Genuneit1,5*
1Institute of Epidemiology and Medical Biometry, Ulm University, Ulm, Germany,2Department of Internal Medicine II—Cardiology, University Medical Center Ulm, Ulm, Germany,3Department of Gynecology and Obstetrics, University Medical Center Ulm, Ulm, Germany,4Division of Clinical Epidemiology and Aging Research, German Cancer Research Center (DKFZ), Heidelberg, Germany,5‘In-FLAME’the International Inflammation Network, World Universities Network (WUN), Ulm, Germany
Abstract
Background
Numerous studies have reported associations between delivery mode and health outcomes in infancy and later life. Previous smaller studies indicated a relationship between delivery mode and newborn inflammation potentially constituting a mediating factor. We aimed to determine the influence of delivery mode and duration of labor on cord blood concentrations of adiponectin, leptin, and high-sensitivity C-reactive protein (hs-CRP).
Methods
In the Ulm SPATZ Health Study, 934 singleton newborns and their mothers were recruited during their hospital stay in the University Medical Center Ulm, Southern Germany, from 04/2012-05/2013. Inflammatory biomarkers were measured by ELISAs (n = 836). Delivery mode was analyzed categorically (elective cesarean (reference), active labor delivery: emergency cesarean, assisted vaginal, and spontaneous vaginal); duration of labor contin-uously. Following log-transformation, linear regression was used to estimate geometric means ratios (GMR) adjusted for potential confounders for the effects of delivery mode and duration of labor on each biomarker separately. Independent replication was sought in the similarly conducted Ulm Birth Cohort Study recruited from 11/2000-11/2001.
Results
Individually, active labor delivery modes as well as increasing duration of labor were associ-ated with higher leptin and hs-CRP concentrations. After mutual adjustment, the associa-tions with delivery modes were attenuated but those for duration of labor remained statistically significant (GMR (95%CI) 1.10 (1.00; 1.21) and 1.15 (1.04; 1.27) for leptin and OPEN ACCESS
Citation:Logan CA, Thiel L, Bornemann R, Koenig W, Reister F, Brenner H, et al. (2016) Delivery Mode, Duration of Labor, and Cord Blood Adiponectin, Leptin, and C-Reactive Protein: Results of the Population-Based Ulm Birth Cohort Studies. PLoS ONE 11(2): e0149918. doi:10.1371/journal. pone.0149918
Editor:Victor Sanchez-Margalet, Virgen Macarena University Hospital, School of Medicine, University of Seville, SPAIN
Received:September 8, 2015
Accepted:February 5, 2016
Published:February 22, 2016
Copyright:© 2016 Logan et al. This is an open access article distributed under the terms of the
Creative Commons Attribution License, which permits unrestricted use, distribution, and reproduction in any medium, provided the original author and source are credited.
hs-CRP per hour of labor, respectively). No significant adjusted associations were observed between delivery modes and adiponectin concentrations. These findings were replicated in an independent birth cohort study.
Conclusions
Cord blood leptin and hs-CRP concentrations were associated with duration of labor rather than delivery mode. Further research is warranted to investigate these associations with additional cytokines involved in inflammatory response to delineate the inflammatory profile. Subsequently, research on determinants of these associations and their role in develop-ment of chronic disease is needed.
Introduction
Numerous studies have identified possible associations between delivery mode and a variety of health outcomes in childhood and later life including overweight and obesity,[1,2] type 1 diabe-tes[3], asthma,[4–6] atopic dermatitis,[7] allergic sensitivity,[8] celiac disease,[9] and inflam-matory bowel disease[10]. One potential biological mechanism which may link the singular event of childbirth to some of these diseases could involve differences in the gut microbiota of cesarean born infants.[11–14] Nevertheless, delivery mode may also serve as a proxy for other risk factors present during fetal development or around the time of birth which may contribute to the association.[15–17]
Several studies have identified associations between adiponectin, leptin, or CRP levels as biomarkers of inflammation in cord blood and early indicators of chronic disease including incidence of lower respiratory tract infections and wheeze,[18,19] infant growth rate,[20] as well as, weight gain and adiposity.[21] These studies suggest that inflammatory processes trig-gered by delivery itself or by events occurring during the prenatal period may be another possi-ble connection between delivery mode and subsequent disease. However, only three previous studies have principally investigated associations between elective cesarean delivery compared to active labor delivery modes (spontaneous and assisted vaginal and emergency cesarean) and these biomarkers in either cord blood or maternal serum.[22–24] Due to limited sample size and design limitations, these studies were not able to account for multiple potential confound-ers. Furthermore, it remains unclear whether differences are limited to onset of labor or if they also exist between active labor delivery modes.
To close these gaps, we aimed to determine whether associations exist between delivery modes and cord blood adiponectin, leptin, and CRP concentrations while adjusting for several confounders within the context of a large population-based birth cohort study. A further objec-tive was to evaluate the roles of duration of labor, anesthesia, and induction of labor as poten-tial mediators of these associations. Independent replication was sought in a second birth cohort study.
Methods
The Ulm SPATZ Health Study was approved by the ethics board of Ulm University (No. 311/ 11). The Ulm Birth Cohort Study (UBCS) was approved by the ethics boards of Ulm University (No. 98/2000) and of the Physicians’Boards of the states Baden-Wuerttemberg and Bavaria. Participation was voluntary and written informed consent obtained in each case.
Funding:The Ulm SPATZ Health Study was funded through an unrestricted grant by the Medical Faculty of Ulm University. The Ulm Birth Cohort Study was supported by grants of the German Research Council (BR 1704/3-1, BR1704/3-2, BR1704/3-3). The funders had no role in study design, data collection and analysis, decision to publish, or preparation of the manuscript.
Study design and population
In the Ulm SPATZ Health Study newborns and their mothers were recruited during their hos-pital stay following delivery in the University Medical Center Ulm, Southern Germany, between 04/2012 and 05/2013.[25] Exclusion criteria were outpatient delivery, maternal age <18 years, insufficient knowledge of the German language, and transfer of the newborn to
intensive care immediately after delivery. At baseline, the cohort included 1,006 newborns of 970 mothers (49% of eligible families, 934 singletons and 36 twin pairs).
In the Ulm Birth Cohort Study newborns and their mothers were recruited during their hos-pital stay following delivery in the University Medical Center Ulm between 11/2000 and 11/ 2001.[26] Exclusion criteria were outpatient delivery, maternal age<18 years, insufficient knowledge of the German, Russian or Turkish language, gestational age<32 weeks, birth-weight<2500g and transfer of the newborn to intensive care immediately after delivery. At baseline, the cohort included 1,090 newborns of 1,066 mothers (67% of eligible families, 1,042 singletons and 24 twin pairs).
For the purposes of this analysis, the study populations were restricted to singletons. Expo-sure, outcome, and confounder definitions as well as statistical methods were identical for both studies unless specifically stated otherwise.
Exposure definition
Delivery mode, duration and medical induction of labor, and administration of anesthesia were ascertained from electronic hospital records. For analysis purposes, delivery mode was consolidated into the following categories (i) elective cesarean section, (ii) vaginal spontaneous, (iii) emergency cesarean [secondary cesarean, emergency cesarean section, or express cesarean section], or (iv) assisted vaginal delivery [vacuum extraction or forceps]. All delivery modes except elective cesarean section followed onset of labor and were thus active labor deliveries. Duration of labor was estimated as a continuous variable based on the time of onset of labor which was self-reported by the mother at the time of admission to the hospital and time of birth recorded by the hospital. Duration was imputed as zero if the mother gave birth by elec-tive cesarean section. In SPATZ, one child was excluded due to missing delivery mode informa-tion. Labor was considered induced if hospital records reported the mother receiving
prostaglandin (or misoprostol), castor oil, or oxytocin. Administration of anesthesia was assumed if any of the following procedures were reported: single shot or catheter spinal anes-thesia, pudendal nerve block, epidural catheter, general anesanes-thesia, or patient controlled anal-gesia (PCA) pump with remifentanil.
Outcome definition
Cord blood was collected in S-Monovette 7.5 ml serum-gel tubes (Sarstedt AG & Co, Nüm-brecht, Germany), by midwives or obstetricians shortly after delivery, centrifuged, and stored in a refrigerator until further processing and long-term storage at -80°C by trained study per-sonnel. In SPATZ, average time until long-term storage was 2.4 days (sd = 0.8 days). Adiponec-tin, leptin (both R&D Systems GmbH, Wiesbaden, Germany), and high-sensitivity CRP (hs-CRP, Immunodiagnostik AG, Bensheim, Germany) concentrations were measured by ELISA (SPATZ: n = 837; UBCS: n = 900). Biomarker measurements reported as below detection limit were imputed to the lower detection limit. Hs-CRP levels above 200μg/L have been associated
with amniotic fluid infection, therefore subjects with hs-CRP measurements above 200μg/L
(SPATZ: n = 23; UBCS: n = 53) were excluded from the analysis.[27]
SPATZ, all three markers were measured in the latter research lab in 07-08/2013 with the same equipment and by the same technician as in UBCS. For SPATZ, median duration of long-term storage of frozen cord blood was 300 days (25thpercentile: 211, 75thpercentile: 392) and was correlated with adiponectin concentration (rSpearman= -0.18, p<0.001). Therefore we
standard-ized values by regressing adiponectin concentration against duration of storage using local polynomial regression (PROC LOESS, SAS 9.3). Hs-CRP levels differed between both studies with the whole distribution shifted by approximately 10μg/L towards higher levels in UBCS
(Fig 1). With identical lab and technician as well as similar standard curves and controls in both studies we attribute this to the longer duration of long-term storage in UBCS (up to 9 years vs. up to 1.25 years in SPATZ) with evaporation and subsequent concentration of serum.
Putative confounding variables
Demographic data were collected using a self-administered maternal questionnaire during the hospital stay following delivery. Clinical data related to the child’s delivery were obtained from electronic hospital records. Clinical data related to the mother’s pregnancy were additionally obtained from routine paper documentation; obstetricians in Germany are required to issue to their patients when pregnancy is clinically established and which are generally updated at each clinical visit during pregnancy.
Variables considered as potential confounders pertaining to the child included gender [male, female], birthweight [continuously or categorized as<3000g, 3000g-3499g, 3500g-3999g,4000g], gestational age [weeks], birth season [winter (Dec-Feb), spring (Mar-May), summer (Jun-Aug), fall (Sept-Nov)], cord blood-pH [continuously], base excess [continu-ously], and APGAR score at 1 minute after delivery [7;<7]. Potential confounding variables considered pertaining to the mother included duration of school education [>11 years,11 years], smoking during pregnancy [yes, no], frequency of maternal alcohol consumption in the year before pregnancy [units per week 0,<1, 1, or>1; 1 unit = 0.5L beer, 0.25L wine, 0.1L Fig 1. High-sensitivity C-reactive protein distribution in UBCS and SPATZ.^
arithmetic mean value.
sparkling wine, or 0.2L schnapps], first trimester body mass index (BMI) [kg/m2], preeclamp-sia [yes, no], maternal age [continuously], and parity [number of previous births of a fetus24 weeks gestation categorized as 0, 1, or>1]. For SPATZ only, HbA1C measured during the hos-pital stay after delivery [categorized as<5.7 or5.7] was additionally available. First trimester BMI was calculated based on weight measured during the mother’s first obstetric appointment at which pregnancy was clinically established if the appointment took place prior to week 15 of pregnancy (SPATZ: n = 805, mean = 9 wks, sd = 2 wks; UBCS: n = 854, mean = 8.4wks, sd = 2.6wks) or self-reported weight before pregnancy (SPATZ: n = 19; UBCS: n = 46).
Statistical analyses
In order to assess whether the study populations were representative for the full study cohort, 95% confidence intervals were calculated for proportions within categorical variables and means of continuous variables for all demographic characteristics of the full cohort. Demo-graphic proportions and means of the corresponding variables within the study population were then compared to determine if any characteristics contained values outside of the confi-dence limits.
Independent associations of putative confounders with each inflammatory marker were tested using Pearson chi-square tests, Kruskal-Wallis tests, and Spearman correlation tests to assess categorical-categorical, categorical–continuous, and continuous-continuous variable pairs, respectively. Putative confounders changing the effect component of the crude geometric means ratio of more than one main exposure associated with at least one inflammatory marker by more than 15% were accounted for as covariates in all models independent of the respective inflammatory marker. Child gender was included in all models although it did not fulfill the above criteria.
Following log-transformation due to the right skewed distribution of the inflammatory markers, linear regression was used to estimate adjusted geometric means ratios (GMR) for the associations of delivery mode and duration of labor (per additional hour) separately with each biomarker. Models were then mutually adjusted for delivery mode and duration of labor to investigate the contribution of both variables to the observed associations. Further analyses restricted to vaginal spontaneous deliveries were conducted to analyze the effects of medically induced labor and anesthesia. Observations with missing data were excluded from adjusted analyses. All statistical analyses were performed with SAS19.3 (The SAS Institute, Cary, NC, USA).
Results
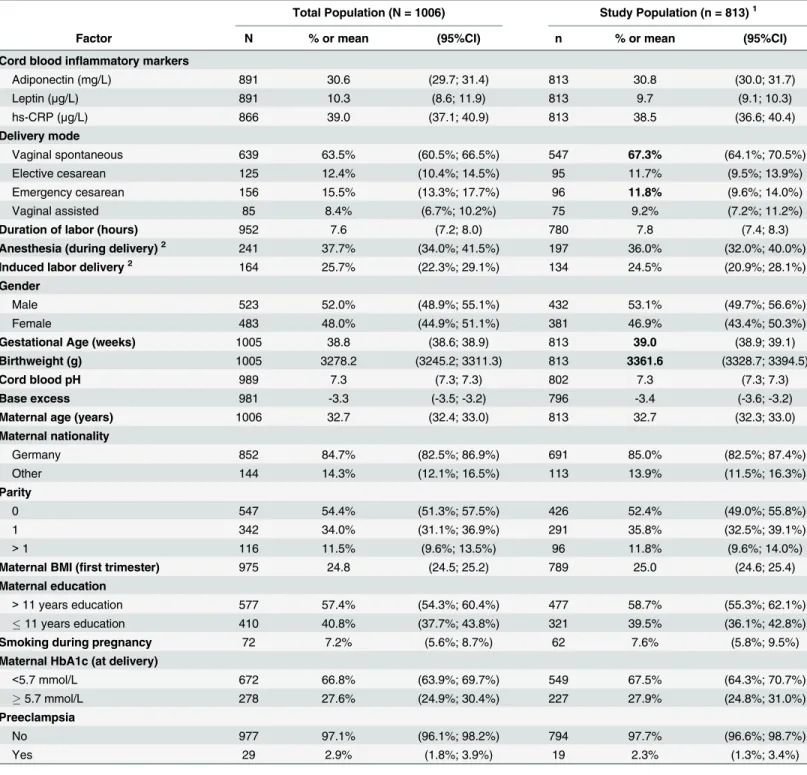
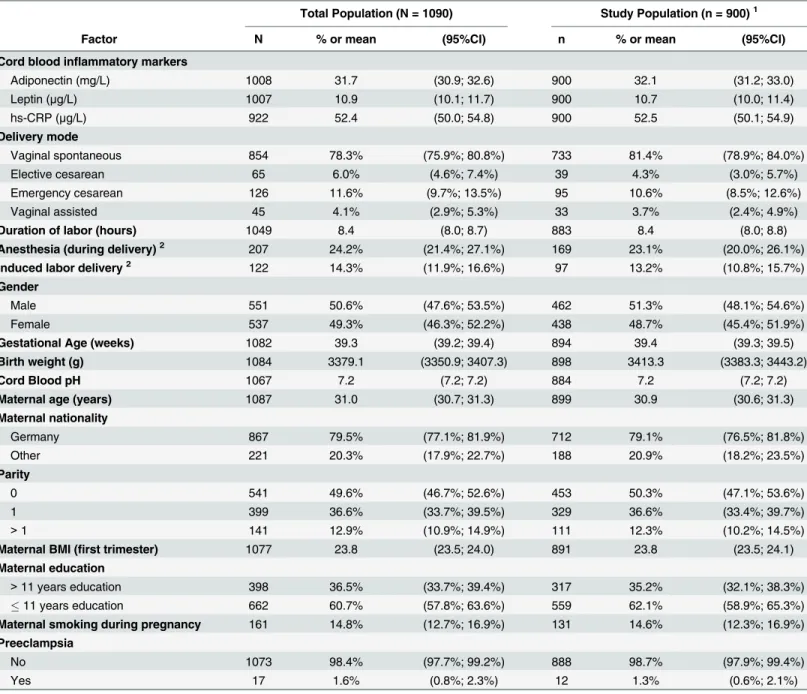
Tables1(SPATZ) and2(UBCS) display demographic details of the full study cohort compared to the study population included in the analysis dataset. The SPATZ study population con-tained lower proportions of children delivered by emergency cesarean and with birthweight below 3000g. Consequently, mean birthweight, body length, and gestational age were higher and the proportion of mothers who received anesthesia was slightly lower in the study popula-tion. These differences were primarily attributable to exclusion of twin births. The proportions of missing data for any given variable did not significantly differ between full cohort and study population (data not shown).
Delivery mode and duration of labor were statistically significantly associated with leptin and hs-CRP and in SPATZ in addition with adiponectin. Gestational age and birthweight were con-founders for all three inflammatory markers. Maternal lifestyle characteristics (first trimester Table 1. Characteristics of the SPATZ study population.
Total Population (N = 1006) Study Population (n = 813)1
Factor N % or mean (95%CI) n % or mean (95%CI)
Cord blood inflammatory markers
Adiponectin (mg/L) 891 30.6 (29.7; 31.4) 813 30.8 (30.0; 31.7)
Leptin (μg/L) 891 10.3 (8.6; 11.9) 813 9.7 (9.1; 10.3)
hs-CRP (μg/L) 866 39.0 (37.1; 40.9) 813 38.5 (36.6; 40.4)
Delivery mode
Vaginal spontaneous 639 63.5% (60.5%; 66.5%) 547 67.3% (64.1%; 70.5%)
Elective cesarean 125 12.4% (10.4%; 14.5%) 95 11.7% (9.5%; 13.9%)
Emergency cesarean 156 15.5% (13.3%; 17.7%) 96 11.8% (9.6%; 14.0%)
Vaginal assisted 85 8.4% (6.7%; 10.2%) 75 9.2% (7.2%; 11.2%)
Duration of labor (hours) 952 7.6 (7.2; 8.0) 780 7.8 (7.4; 8.3)
Anesthesia (during delivery)2 241 37.7% (34.0%; 41.5%) 197 36.0% (32.0%; 40.0%)
Induced labor delivery2 164 25.7% (22.3%; 29.1%) 134 24.5% (20.9%; 28.1%)
Gender
Male 523 52.0% (48.9%; 55.1%) 432 53.1% (49.7%; 56.6%)
Female 483 48.0% (44.9%; 51.1%) 381 46.9% (43.4%; 50.3%)
Gestational Age (weeks) 1005 38.8 (38.6; 38.9) 813 39.0 (38.9; 39.1)
Birthweight (g) 1005 3278.2 (3245.2; 3311.3) 813 3361.6 (3328.7; 3394.5)
Cord blood pH 989 7.3 (7.3; 7.3) 802 7.3 (7.3; 7.3)
Base excess 981 -3.3 (-3.5; -3.2) 796 -3.4 (-3.6; -3.2)
Maternal age (years) 1006 32.7 (32.4; 33.0) 813 32.7 (32.3; 33.0)
Maternal nationality
Germany 852 84.7% (82.5%; 86.9%) 691 85.0% (82.5%; 87.4%)
Other 144 14.3% (12.1%; 16.5%) 113 13.9% (11.5%; 16.3%)
Parity
0 547 54.4% (51.3%; 57.5%) 426 52.4% (49.0%; 55.8%)
1 342 34.0% (31.1%; 36.9%) 291 35.8% (32.5%; 39.1%)
>1 116 11.5% (9.6%; 13.5%) 96 11.8% (9.6%; 14.0%)
Maternal BMI (first trimester) 975 24.8 (24.5; 25.2) 789 25.0 (24.6; 25.4)
Maternal education
>11 years education 577 57.4% (54.3%; 60.4%) 477 58.7% (55.3%; 62.1%)
11 years education 410 40.8% (37.7%; 43.8%) 321 39.5% (36.1%; 42.8%)
Smoking during pregnancy 72 7.2% (5.6%; 8.7%) 62 7.6% (5.8%; 9.5%)
Maternal HbA1c (at delivery)
<5.7 mmol/L 672 66.8% (63.9%; 69.7%) 549 67.5% (64.3%; 70.7%)
5.7 mmol/L 278 27.6% (24.9%; 30.4%) 227 27.9% (24.8%; 31.0%)
Preeclampsia
No 977 97.1% (96.1%; 98.2%) 794 97.7% (96.6%; 98.7%)
Yes 29 2.9% (1.8%; 3.9%) 19 2.3% (1.3%; 3.4%)
1Study population excludes multiple births (twins), subjects with missing in
flammatory marker measurements or delivery mode information, and subjects with hs-CRP>200μg/L
2Restricted to vaginal spontaneous deliveries
BMI, education, and smoking status) were more closely associated with leptin and hs-CRP than with adiponectin. Among vaginal spontaneous deliveries, anesthesia during delivery and medically induced labor were associated with higher concentrations of leptin and hs-CRP while no significant association was found with adiponectin.
Crude and adjusted model results are presented in Tables5(SPATZ) and6(UBCS). After adjustment, leptin and hs-CRP concentrations were higher among newborns delivered by active labor delivery vs. elective cesarean section. Associations were also statistically significant Table 2. Characteristics of the UBCS study population.
Total Population (N = 1090) Study Population (n = 900)1
Factor N % or mean (95%CI) n % or mean (95%CI)
Cord blood inflammatory markers
Adiponectin (mg/L) 1008 31.7 (30.9; 32.6) 900 32.1 (31.2; 33.0)
Leptin (μg/L) 1007 10.9 (10.1; 11.7) 900 10.7 (10.0; 11.4)
hs-CRP (μg/L) 922 52.4 (50.0; 54.8) 900 52.5 (50.1; 54.9)
Delivery mode
Vaginal spontaneous 854 78.3% (75.9%; 80.8%) 733 81.4% (78.9%; 84.0%)
Elective cesarean 65 6.0% (4.6%; 7.4%) 39 4.3% (3.0%; 5.7%)
Emergency cesarean 126 11.6% (9.7%; 13.5%) 95 10.6% (8.5%; 12.6%)
Vaginal assisted 45 4.1% (2.9%; 5.3%) 33 3.7% (2.4%; 4.9%)
Duration of labor (hours) 1049 8.4 (8.0; 8.7) 883 8.4 (8.0; 8.8)
Anesthesia (during delivery)2 207 24.2% (21.4%; 27.1%) 169 23.1% (20.0%; 26.1%)
Induced labor delivery2 122 14.3% (11.9%; 16.6%) 97 13.2% (10.8%; 15.7%)
Gender
Male 551 50.6% (47.6%; 53.5%) 462 51.3% (48.1%; 54.6%)
Female 537 49.3% (46.3%; 52.2%) 438 48.7% (45.4%; 51.9%)
Gestational Age (weeks) 1082 39.3 (39.2; 39.4) 894 39.4 (39.3; 39.5)
Birth weight (g) 1084 3379.1 (3350.9; 3407.3) 898 3413.3 (3383.3; 3443.2)
Cord Blood pH 1067 7.2 (7.2; 7.2) 884 7.2 (7.2; 7.2)
Maternal age (years) 1087 31.0 (30.7; 31.3) 899 30.9 (30.6; 31.3)
Maternal nationality
Germany 867 79.5% (77.1%; 81.9%) 712 79.1% (76.5%; 81.8%)
Other 221 20.3% (17.9%; 22.7%) 188 20.9% (18.2%; 23.5%)
Parity
0 541 49.6% (46.7%; 52.6%) 453 50.3% (47.1%; 53.6%)
1 399 36.6% (33.7%; 39.5%) 329 36.6% (33.4%; 39.7%)
>1 141 12.9% (10.9%; 14.9%) 111 12.3% (10.2%; 14.5%)
Maternal BMI (first trimester) 1077 23.8 (23.5; 24.0) 891 23.8 (23.5; 24.1)
Maternal education
>11 years education 398 36.5% (33.7%; 39.4%) 317 35.2% (32.1%; 38.3%)
11 years education 662 60.7% (57.8%; 63.6%) 559 62.1% (58.9%; 65.3%)
Maternal smoking during pregnancy 161 14.8% (12.7%; 16.9%) 131 14.6% (12.3%; 16.9%)
Preeclampsia
No 1073 98.4% (97.7%; 99.2%) 888 98.7% (97.9%; 99.4%)
Yes 17 1.6% (0.8%; 2.3%) 12 1.3% (0.6%; 2.1%)
1Study population excludes multiple births (twins), subjects with missing in
flammatory marker measurements or delivery mode information, and subjects with hs-CRP>200μg/L
2Restricted to vaginal spontaneous deliveries
for all active delivery modes individually except for hs-CRP in UBCS which was confined to assisted vaginal deliveries. Increasing duration of labor was also statistically significantly associ-ated with higher concentrations of leptin and hs-CRP. In models mutually adjusted for delivery mode and duration of labor, delivery mode was no longer associated with either leptin or hs-CRP whereas the association of duration of labor with these outcomes remained. No associa-tions were observed between delivery mode or duration of labor and adiponectin concentra-tions in the adjusted models. Similar point estimates were observed for duration of labor in models restricted to active labor delivery modes using vaginal spontaneous labor as the refer-ence group (data not shown).
Following restriction to vaginal spontaneous deliveries, the associations of duration of labor with leptin and hs-CRP remained similar [SPATZ: GMR (95%CI): 1.10 (0.99; 1.22) and 1.10 (0.99; 1.23); UBCS: 1.12 (1.02; 1.23) and 1.12 (1.03; 1.22); per hour of labor respectively]. In SPATZ, medically induced labor was associated with higher concentrations of hs-CRP [1.17 (1.01; 1.36)]. These point estimates were slightly stronger following mutual adjustment. Administration of anesthesia had no effect on any inflammatory marker. This was reversed in UBCS where only administration of anesthesia was marginally associated with higher concen-trations of hs-CRP [1.12 (1.00; 1.25)]. However, in mutually adjusted models this effect was attenuated.
Discussion
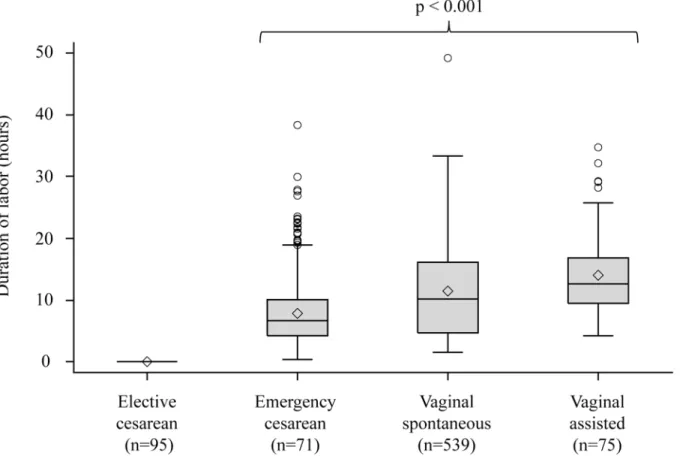
Though several previous studies have assessed cesarean delivery as a potential confounder in the association between inflammatory markers and disease[28], we found only three studies Fig 2. Duration of labor distribution by delivery mode in SPATZ.*Kruskal-Wallis p-value among active labor delivery modes;^arithmetic mean value.
that primarily investigated association between both pre- and post-onset of labor delivery modes and either adiponectin, leptin, or CRP measured in either cord blood or newborn serum. Our results were mostly consistent with associations reported for lower leptin[24] and CRP concentrations[23] among elective cesarean deliveries. Although, our results did not sup-port the findings of Hermansson et al. who resup-ported significant association between elective cesarean birth and lower concentrations of adiponectin.[22]
Mean adiponectin as well as leptin concentrations were higher in our study populations than those reported in other studies for elective cesarean and vaginal delivery.[22,24] However, between our two cohorts the distributions of the biomarker concentrations were very similar. The aforementioned differences were likely attributable to differences in study populations and unlikely to have influenced results from adjusted models after accounting for a number of demographic confounders.
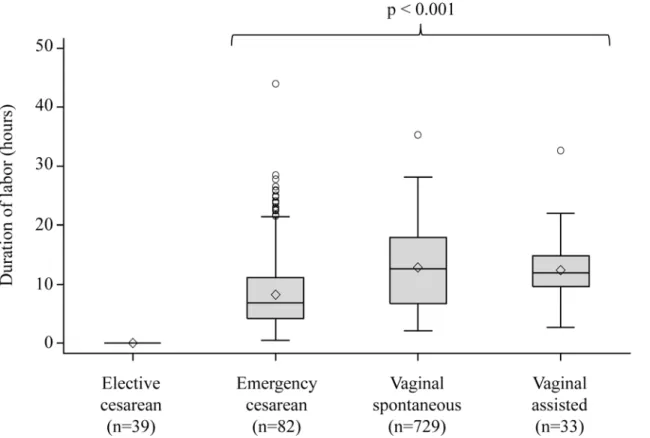
The results of our study may have been influenced by the following factors. First, we observed a consistent decrease in adiponectin concentration results with increasing sample storage duration in SPATZ likely attributable to long-term storage effect. To account for this, we standardized on storage duration. Second, duration of labor was imputed as zero for elective cesarean delivery and calculated using self-reported onset of labor for active deliveries. Mutu-ally adjusted models restricted to active labor deliveries showed no change in point estimate for duration of labor indicating imputed zero duration did not influence full model results (data not shown). Similarly, results from sensitivity analyses excluding subjects with extreme or sus-picious labor durations were not significantly different from among all subjects (data not shown). Third, we could not fully assess whether cord blood inflammatory markers were influ-enced by subclinical infections for which treatment was not prescribed. In order to reduce this Fig 3. Duration of labor distribution by delivery mode in UBCS.*Kruskal-Wallis p-value among active labor delivery modes;^arithmetic mean value.
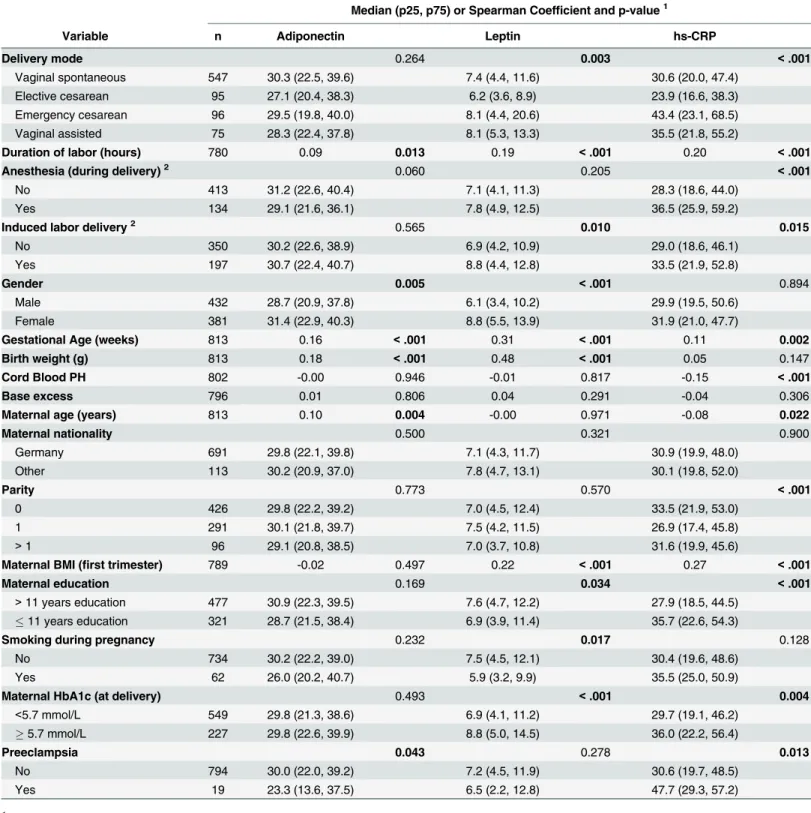
possibility, our study population excluded newborns transferred to intensive care immediately after delivery and the analysis was further restricted to children with hs-CRP levels below Table 3. Bivariate associations with cord blood adiponectin, leptin, and hs-CRP in SPATZ.
Median (p25, p75) or Spearman Coefficient and p-value1
Variable n Adiponectin Leptin hs-CRP
Delivery mode 0.264 0.003 <.001
Vaginal spontaneous 547 30.3 (22.5, 39.6) 7.4 (4.4, 11.6) 30.6 (20.0, 47.4)
Elective cesarean 95 27.1 (20.4, 38.3) 6.2 (3.6, 8.9) 23.9 (16.6, 38.3)
Emergency cesarean 96 29.5 (19.8, 40.0) 8.1 (4.4, 20.6) 43.4 (23.1, 68.5)
Vaginal assisted 75 28.3 (22.4, 37.8) 8.1 (5.3, 13.3) 35.5 (21.8, 55.2)
Duration of labor (hours) 780 0.09 0.013 0.19 <.001 0.20 <.001
Anesthesia (during delivery)2 0.060 0.205
<.001
No 413 31.2 (22.6, 40.4) 7.1 (4.1, 11.3) 28.3 (18.6, 44.0)
Yes 134 29.1 (21.6, 36.1) 7.8 (4.9, 12.5) 36.5 (25.9, 59.2)
Induced labor delivery2 0.565 0.010 0.015
No 350 30.2 (22.6, 38.9) 6.9 (4.2, 10.9) 29.0 (18.6, 46.1)
Yes 197 30.7 (22.4, 40.7) 8.8 (4.4, 12.8) 33.5 (21.9, 52.8)
Gender 0.005 <.001 0.894
Male 432 28.7 (20.9, 37.8) 6.1 (3.4, 10.2) 29.9 (19.5, 50.6)
Female 381 31.4 (22.9, 40.3) 8.8 (5.5, 13.9) 31.9 (21.0, 47.7)
Gestational Age (weeks) 813 0.16 <.001 0.31 <.001 0.11 0.002
Birth weight (g) 813 0.18 <.001 0.48 <.001 0.05 0.147
Cord Blood PH 802 -0.00 0.946 -0.01 0.817 -0.15 <.001
Base excess 796 0.01 0.806 0.04 0.291 -0.04 0.306
Maternal age (years) 813 0.10 0.004 -0.00 0.971 -0.08 0.022
Maternal nationality 0.500 0.321 0.900
Germany 691 29.8 (22.1, 39.8) 7.1 (4.3, 11.7) 30.9 (19.9, 48.0)
Other 113 30.2 (20.9, 37.0) 7.8 (4.7, 13.1) 30.1 (19.8, 52.0)
Parity 0.773 0.570 <.001
0 426 29.8 (22.2, 39.2) 7.0 (4.5, 12.4) 33.5 (21.9, 53.0)
1 291 30.1 (21.8, 39.7) 7.5 (4.2, 11.5) 26.9 (17.4, 45.8)
>1 96 29.1 (20.8, 38.5) 7.0 (3.7, 10.8) 31.6 (19.9, 45.6)
Maternal BMI (first trimester) 789 -0.02 0.497 0.22 <.001 0.27 <.001
Maternal education 0.169 0.034 <.001
>11 years education 477 30.9 (22.3, 39.5) 7.6 (4.7, 12.2) 27.9 (18.5, 44.5)
11 years education 321 28.7 (21.5, 38.4) 6.9 (3.9, 11.4) 35.7 (22.6, 54.3)
Smoking during pregnancy 0.232 0.017 0.128
No 734 30.2 (22.2, 39.0) 7.5 (4.5, 12.1) 30.4 (19.6, 48.6)
Yes 62 26.0 (20.2, 40.7) 5.9 (3.2, 9.9) 35.5 (25.0, 50.9)
Maternal HbA1c (at delivery) 0.493 <.001 0.004
<5.7 mmol/L 549 29.8 (21.3, 38.6) 6.9 (4.1, 11.2) 29.7 (19.1, 46.2)
5.7 mmol/L 227 29.8 (22.6, 39.9) 8.8 (5.0, 14.5) 36.0 (22.2, 56.4)
Preeclampsia 0.043 0.278 0.013
No 794 30.0 (22.0, 39.2) 7.2 (4.5, 11.9) 30.6 (19.7, 48.5)
Yes 19 23.3 (13.6, 37.5) 6.5 (2.2, 12.8) 47.7 (29.3, 57.2)
1p-values reported as Kruskal-Wallis for categorical variables and Spearman Sum Rank for continuous variables 2Restricted to vaginal spontaneous deliveries
200μg/L.[27] Finally, our study populations included few women who had preeclampsia
which has been associated with higher cord blood leptin concentrations.[29] Exclusion of these women did not alter the observed associations (data not shown).
Table 4. Bivariate associations with cord blood adiponectin, leptin, and hs-CRP in UBCS.
Factor Median (p25, p75) or Spearman Coefficient and p-value1
n Adiponectin Leptin hs-CRP
Delivery mode 0.144 <.001 0.019
Vaginal spontaneous 733 30.8 (22.5, 41.1) 7.9 (4.4, 13.3) 40.4 (25.8, 64.4)
Elective cesarean 39 25.3 (20.3, 33.9) 4.5 (2.6, 7.9) 31.7 (24.6, 46.7)
Emergency cesarean 95 29.3 (20.6, 38.3) 7.6 (4.2, 16.6) 46.3 (28.9, 82.7)
Vaginal assisted 33 32.7 (24.0, 36.0) 6.7 (2.7, 10.8) 44.7 (30.8, 63.8)
Duration of labor (hours) 883 0.03 0.369 0.14 <.001 0.19 <.001
Anesthesia (during delivery)2 0.888 0.037
<.001
No 564 30.6 (22.5, 41.0) 7.8 (4.2, 12.5) 39.0 (25.4, 59.3)
Yes 169 32.1 (22.4, 41.2) 8.6 (5.0, 15.5) 50.5 (30.0, 78.9)
Induced labor delivery2 0.053 0.181 0.011
No 636 31.2 (22.8, 41.3) 7.9 (4.3, 13.0) 39.7 (25.7, 61.5)
Yes 97 27.0 (19.9, 39.6) 8.8 (5.0, 16.8) 47.8 (30.2, 77.2)
Gender 0.237 <.001 0.997
Male 462 30.6 (21.4, 39.6) 6.1 (3.6, 10.7) 41.4 (26.5, 65.0)
Female 438 30.5 (22.8, 41.2) 9.8 (5.3, 15.9) 40.1 (26.0, 65.6)
Gestation period (weeks) 894 0.14 <.001 0.24 <.001 0.17 <.001
Birth weight (g) 898 0.12 <.001 0.40 <.001 0.08 0.019
Cord Blood PH 884 -0.05 0.148 -0.05 0.167 -0.11 <.001
Base excess 866 -0.03 0.328 0.01 0.775 -0.03 0.437
Maternal age (years) 899 -0.09 0.007 0.00 0.898 -0.04 0.229
Maternal nationality 0.143 0.283 0.101
Germany 712 30.4 (21.4, 40.2) 7.6 (4.2, 13.0) 39.9 (25.9, 64.4)
Other 188 32.9 (24.3, 41.1) 8.1 (4.5, 14.0) 45.4 (28.8, 70.6)
Parity 0.857 0.212 0.283
0 453 31.1 (21.5, 41.2) 8.0 (4.1, 13.4) 41.5 (26.8, 65.8)
1 329 30.2 (22.0, 39.6) 7.3 (4.4, 12.3) 39.1 (25.8, 62.8)
>1 111 29.3 (23.5, 38.8) 8.4 (4.4, 15.6) 46.6 (25.8, 71.3)
Maternal BMI (first trimester) 891 0.05 0.144 0.16 <.001 0.21 <.001
Maternal education 0.028 0.260 0.061
>11 years education 317 29.1 (20.7, 39.3) 7.8 (5.0, 12.5) 38.9 (25.8, 59.8)
11 years education 559 31.4 (23.0, 41.3) 7.5 (3.9, 13.3) 42.4 (27.0, 67.6)
Maternal smoking during pregnancy 0.754 0.017 0.035
No 768 30.6 (22.3, 40.6) 7.9 (4.4, 13.3) 39.9 (26.0, 63.6)
Yes 131 31.3 (22.3, 38.6) 6.2 (3.6, 12.3) 48.1 (27.2, 73.6)
Preeclampsia 0.709 0.528 0.295
No 888 30.6 (22.3, 40.4) 7.8 (4.2, 13.2) 40.4 (26.0, 64.6)
Yes 12 29.4 (20.6, 40.2) 7.1 (3.4, 10.9) 44.5 (31.6, 79.3)
1p-values reported as Kruskal-Wallis for categorical variables and Spearman Sum Rank for continuous variables 2Restricted to vaginal spontaneous deliveries
In contrast to previous efforts, our analysis has notable strengths. Our study populations were much larger, allowing control for multiple confounding variables. Furthermore, we were able to analyze the effects of duration of labor, anesthesia, and induction as potential mediators of the association with delivery mode. Moreover, our analyses were aided by our ability to clas-sify vaginal deliveries into“spontaneous”and“assisted”subgroups between which duration of labor was clearly different. Finally, we were able to demonstrate very similar findings in two independent cohorts conducted with similar if not identical methodology. Of note, shifts in the prevalences of several demographic, lifestyle, and delivery-related factors occurred between Table 5. Crude and adjusted model results for adiponectin, leptin, and CRP by mode of delivery in SPATZ.
Crude Adjusted1 Mutually Adjusted2
Geometric Means Ratio (95% CI) p-value F-Test p-value3 Geometric Means Ratio (95% CI) p-value F-Test p-value3 Geometric Means Ratio (95% CI) p-value F-Test p-value3 Adiponectin
Mode of Delivery
Elective Cesarean 1.00 reference 1.00 reference 1.00 reference
Vaginal Spontaneous
1.06 (0.96; 1.17)
0.23 0.21 1.04 (0.93; 1.16)
0.50 0.40 0.98 (0.83; 1.15) 0.78 0.50 Emergency Cesarean 0.97 (0.86; 1.10)
0.67 0.21 0.96 (0.84; 1.10)
0.55 0.40 0.92 (0.75; 1.12)
0.38 0.50
Vaginal Assisted 1.01 (0.88; 1.15)
0.94 0.21 0.98 (0.84; 1.15)
0.84 0.40 0.91 (0.73; 1.13)
0.39 0.50
Duration of Labor (per hour)
1.04 (1.00; 1.07)
0.05 - 1.02 (0.98;
1.06)
0.41 - 1.03 (0.97;
1.10)
0.29
-Leptin
Mode of Delivery
Elective Cesarean 1.00 reference 1.00 reference 1.00 reference
Vaginal Spontaneous
1.15 (0.95; 1.40)
0.15 0.02 1.27 (1.07; 1.50)
0.006 0.002 1.05 (0.82; 1.35) 0.69 0.40 Emergency Cesarean 1.46 (1.13; 1.88)
0.003 0.02 1.44 (1.16; 1.73)
<0.001 0.002 1.19 (0.88; 1.61)
0.25 0.40
Vaginal Assisted 1.28 (0.98; 1.67)
0.07 0.02 1.49 (1.17; 1.89)
0.001 0.002 1.17 (0.84; 1.63)
0.36 0.40
Duration of Labor (per hour)
1.15 (1.07; 1.23)
<0.001 - 1.14 (1.07; 1.21)
<0.001 - 1.10 (1.00; 1.21)
0.05
-CRP
Mode of Delivery
Elective Cesarean 1.00 reference 1.00 reference 1.00 reference
Vaginal Spontaneous
1.20 (1.03; 1.40)
0.02 <.001 1.28 (1.07; 1.52)
0.006 <.001 0.97 (0.75;
1.26) 0.83 0.44 Emergency Cesarean 1.61 (1.32; 1.98)
<0.001 <.001 1.58 (1.29; 1.94)
<0.001 <.001 1.12 (0.82;
1.53)
0.47 0.44
Vaginal Assisted 1.42 (1.14; 1.76)
0.002 <.001 1.47 (1.15; 1.89)
0.002 <.001 1.04 (0.74;
1.47)
0.82 0.44
Duration of Labor (per hour)
1.16 (1.10; 1.22)
<0.001 - 1.16 (1.09; 1.24)
<0.001 - 1.15 (1.04; 1.27)
0.005
-1Models adjusted for gender, gestational age, birthweight, pre-pregnancy BMI, education, smoking, cord blood pH, base excess, and HbA1c 2
Mutually adjusted models include all above covariates and log transformed duration of labor.
3
P-value for combined delivery modes (i.e. active labor) against the reference category calculated as probability of the F-statistic
both studies. In SPATZ, mothers more often had elective cesarean delivery, medical induction of labor, and administration of anesthesia. Furthermore, maternal smoking prevalence during pregnancy decreased, maternal age and education increased, and maternal BMI before preg-nancy slightly increased over time. Also, in the later Ulm SPATZ Health Study we observed similar overall adiponectin and leptin concentrations and a similar but shifted hs-CRP distri-bution. Replication despite these differences strengthens our findings.
Our results imply that duration of labor rather than delivery mode may be primarily respon-sible for increased concentrations of leptin and hs-CRP. Our results support those of a smaller Table 6. Crude and adjusted model results for adiponectin, leptin, and CRP by mode of delivery in UBCS.
Crude Adjusted1 Mutually Adjusted2
Geometric Means Ratio (95% CI) p-value F-Test p-value3 Geometric Means Ratio (95% CI) p-value F-Test p-value3 Geometric Means Ratio (95% CI) p-value F-Test p-value3 Adiponectin
Mode of Delivery
Elective Cesarean 1.00 reference 1.00 reference 1.00 reference
Vaginal Spontaneous
1.18 (1.01; 1.38)
0.040 0.144 1.07 (0.90; 1.27)
0.419 0.555 1.06 (0.86; 1.30) 0.611 0.549 Emergency Cesarean 1.11 (0.93; 1.34)
0.247 0.144 1.00 (0.82; 1.21)
0.996 0.555 0.97 (0.76; 1.25)
0.840 0.549
Vaginal Assisted 1.10 (0.88; 1.38)
0.391 0.144 1.06 (0.83; 1.35)
0.634 0.555 1.04 (0.78; 1.38)
0.795 0.549
Duration of Labor (per hour)
1.03 (0.99; 1.08)
0.164 - 1.01 (0.96;
1.06)
0.763 - 1.01 (0.95;
1.07)
0.824
-Leptin
Mode of Delivery
Elective Cesarean 1.00 reference 1.00 reference 1.00 reference
Vaginal Spontaneous
1.74 (1.32; 2.31)
<.001 <.001 1.56 (1.20; 2.01)
<.001 0.001 1.23 (0.90; 1.68) 0.198 0.068 Emergency Cesarean 1.95 (1.41; 2.69)
<.001 <.001 1.75 (1.31; 2.34)
<.001 0.001 1.39 (0.96; 2.01)
0.082 0.068
Vaginal Assisted 1.41 (0.94; 2.11)
0.096 <.001 1.29 (0.89; 1.86)
0.176 0.001 0.96 (0.63; 1.47)
0.852 0.068
Duration of Labor (per hour)
1.21 (1.12; 1.31)
<.001 - 1.18 (1.10; 1.27)
<.001 - 1.14 (1.04; 1.25)
0.006
-CRP
Mode of Delivery
Elective Cesarean 1.00 reference 1.00 reference 1.00 reference
Vaginal Spontaneous
1.18 (0.96; 1.45)
0.111 0.021 1.13 (0.91; 1.41)
0.252 0.087 0.89 (0.68; 1.15) 0.372 0.391 Emergency Cesarean 1.37 (1.08; 1.73)
0.010 0.021 1.23 (0.96; 1.56)
0.100 0.087 0.90 (0.66; 1.23)
0.525 0.391
Vaginal Assisted 1.41 (1.05; 1.89)
0.023 0.021 1.42 (1.05; 1.93)
0.024 0.087 1.05 (0.73; 1.50)
0.792 0.391
Duration of Labor (per hour)
1.16 (1.10; 1.23)
<.001 - 1.12 (1.06; 1.19)
<.001 - 1.14 (1.05; 1.23)
0.001
-1Models adjusted for gender, gestational age, birthweight, pre-pregnancy BMI, education, smoking, cord blood pH, base excess, and HbA1c 2
Mutually adjusted models include all above covariates and log transformed duration of labor.
3
P-value for combined delivery modes (i.e. active labor) against the reference category calculated as probability of the F-statistic
Korean study which reported correlation between duration of labor and cord blood leptin con-centration among vaginal spontaneous deliveries.[30] Though it remains unclear why leptin levels may increase during labor, previous research suggests adiponectin and leptin secreted by both the placenta and fetal adipocytes may signal release of pro-inflammatory cytokines which are then thought to stimulate production of CRP in placental tissue during labor.[31,32]
Although we were able to control for some prenatal factors by including gestational age and birthweight in our models, we could not fully account for all factors that may be associated with duration of labor and neonatal inflammation. Therefore, it remains unclear if duration of labor is part of the causal pathway for previously reported associations between cord blood inflammatory markers and disease or if it is simply a proxy for other unmeasured factors pres-ent during or prior to delivery. Subsequpres-ent analyses should consider the effect of additional fac-tors, such as fetal growth and placental defects on levels of inflammatory biomarkers in cord blood. Also, administration of anesthesia and medical induction of labor may warrant further investigation given the mixed findings in our studies and the limited ability to explore these factors among assisted vaginal and emergency cesarean sections due to our sample sizes. More-over, further cytokines should be investigated to understand the kinetics of the inflammatory response and the inflammatory profile potentially triggered by duration of labor.
Our results may benefit clinical practice where CRP screening is a common tool for diagnos-ing neonatal infection. Current guidelines for interpretdiagnos-ing CRP concentrations are vague, lead-ing to wide variation in treatment strategies among physicians.[33] Given our findings, future studies seeking standardized methods of interpreting CRP as a biomarker for infection should include duration and induction of labor as potential confounding variables.
Conclusion
In this study, we observed that cord blood leptin, and hs-CRP concentrations were primarily associated with duration of labor rather than delivery mode. Further research is warranted to investigate surrounding factors and whether duration of labor may explain associations observed between mode of delivery and health outcomes later in life. Evaluation of these factors may also improve the interpretation of CRP as a biomarker for infection in the neonate.
Acknowledgments
We thank the midwives, nurses and obstetricians of the Department of Gynecology and Obstetrics, University Medical Center Ulm for their study support. The authors would also like to thank Mrs. Gerlinde Trischler for providing excellent technical assistance.
Author Contributions
Conceived and designed the experiments: CAL JG HB DR. Performed the experiments: CAL JG LT RB. Analyzed the data: CAL JG. Contributed reagents/materials/analysis tools: LT RB WK FR. Wrote the paper: CAL LT RB WK FR HB DR JG.
References
1. Li H, Zhou Y, Liu J. The impact of cesarean section on offspring overweight and obesity: a systematic review and meta-analysis. Int J Obes 2005. 2013; 37: 893–899. doi:10.1038/ijo.2012.195
2. Wang L, Alamian A, Southerland J, Wang K, Anderson J, Stevens M. Cesarean section and the risk of overweight in grade 6 children. Eur J Pediatr. 2013; 172: 1341–1347. doi:10.1007/s00431-013-2043-2 PMID:23708216
4. Bager P, Wohlfahrt J, Westergaard T. Caesarean delivery and risk of atopy and allergic disease: meta-analyses. Clin Exp Allergy. 2008; 38: 634–642. doi:10.1111/j.1365-2222.2008.02939.xPMID: 18266879
5. Leung JYY, Li AM, Leung GM, Schooling CM. Mode of delivery and childhood hospitalizations for asthma and other wheezing disorders. Clin Exp Allergy. 2015; 45: 1109–1117. doi:10.1111/cea.12548 PMID:25845852
6. Sevelsted A, Stokholm J, Bønnelykke K, Bisgaard H. Cesarean section and chronic immune disorders.
Pediatrics. 2015; 135: e92–98. doi:10.1542/peds.2014-0596PMID:25452656
7. Lee S-Y, Yu J, Ahn K-M, Kim KW, Shin YH, Lee K-S, et al. Additive effect between IL-13 polymorphism and cesarean section delivery/prenatal antibiotics use on atopic dermatitis: a birth cohort study (COCOA). PloS One. 2014; 9: e96603. doi:10.1371/journal.pone.0096603PMID:24848505 8. Negele K, Heinrich J, Borte M, von Berg A, Schaaf B, Lehmann I, et al. Mode of delivery and
develop-ment of atopic disease during the first 2 years of life. Pediatr Allergy Immunol. 2004; 15: 48–54. PMID: 14998382
9. Decker E, Engelmann G, Findeisen A, Gerner P, Laass M, Ney D, et al. Cesarean delivery is associ-ated with celiac disease but not inflammatory bowel disease in children. Pediatrics. 2010; 125: e1433–
1440. doi:10.1542/peds.2009-2260PMID:20478942
10. Bager P, Simonsen J, Nielsen NM, Frisch M. Cesarean section and offspring’s risk of inflammatory bowel disease: a national cohort study. Inflamm Bowel Dis. 2012; 18: 857–862. doi:10.1002/ibd.21805 PMID:21739532
11. Grönlund MM, Lehtonen OP, Eerola E, Kero P. Fecal microflora in healthy infants born by different methods of delivery: permanent changes in intestinal flora after cesarean delivery. J Pediatr Gastroen-terol Nutr. 1999; 28: 19–25. PMID:9890463
12. West CE, Jenmalm MC, Prescott SL. The gut microbiota and its role in the development of allergic dis-ease: a wider perspective. Clin Exp Allergy. 2015; 45: 43–53. doi:10.1111/cea.12332PMID:24773202 13. Collado MC, Rautava S, Isolauri E, Salminen S. Gut microbiota: a source of novel tools to reduce the
risk of human disease? Pediatr Res. 2015; 77: 182–188. doi:10.1038/pr.2014.173PMID:25335085 14. Sanz Y, Olivares M, Moya-Perez A, Agostoni C. Understanding the role of gut microbiome in metabolic
disease risk. Pediatr Res. 2015; 77: 236–244. doi:10.1038/pr.2014.170PMID:25314581 15. Barker DJ. In utero programming of chronic disease. Clin Sci Lond Engl 1979. 1998; 95: 115–128.
16. Cho CE, Norman M. Cesarean section and development of the immune system in the offspring. Am J Obstet Gynecol. 2013; 208: 249–254. doi:10.1016/j.ajog.2012.08.009PMID:22939691
17. Hyde MJ, Modi N. The long-term effects of birth by caesarean section: The case for a randomised con-trolled trial. Early Hum Dev. 2012; 88: 943–949. doi:10.1016/j.earlhumdev.2012.09.006PMID: 23036493
18. Morales E, Guerra S, García-Esteban R, Guxens M, Alvarez-Pedrerol M, Bustamante M, et al. Maternal C-reactive protein levels in pregnancy are associated with wheezing and lower respiratory tract infec-tions in the offspring. Am J Obstet Gynecol. 2011; 204: 164.e1–9. doi:10.1016/j.ajog.2010.08.056 19. Rothenbacher D, Weyermann M, Fantuzzi G, Brenner H. Adipokines in cord blood and risk of wheezing
disorders within the first two years of life. Clin Exp Allergy. 2007; 37: 1143–1149. doi: 10.1111/j.1365-2222.2007.02759.xPMID:17651143
20. Kaar JL, Brinton JT, Crume T, Hamman RF, Glueck DH, Dabelea D. Leptin levels at birth and infant growth: the EPOCH study. J Dev Orig Health Dis. 2014; 5: 214–218. doi:10.1017/
S204017441400021XPMID:24901661
21. Mantzoros CS, Rifas-Shiman SL, Williams CJ, Fargnoli JL, Kelesidis T, Gillman MW. Cord Blood Leptin and Adiponectin as Predictors of Adiposity in Children at 3 Years of Age: A Prospective Cohort Study. Pediatrics. 2009; 123: 682–689. doi:10.1542/peds.2008-0343PMID:19171638
22. Hermansson H, Hoppu U, Isolauri E. Elective caesarean section is associated with low adiponectin lev-els in cord blood. Neonatology. 2014; 105: 172–174. doi:10.1159/000357178PMID:24434868 23. Ishibashi M, Takemura Y, Ishida H, Watanabe K, Kawai T. C-Reactive Protein Kinetics in Newborns:
Application of a High-Sensitivity Analytic Method in Its Determination. Clin Chem. 2002; 48: 1103–
1106. PMID:12089183
24. Yoshimitsu N, Douchi T, Kamio M, Nagata Y. Differences in umbilical venous and arterial leptin levels by mode of delivery. Obstet Gynecol. 2000; 96: 342–345. PMID:10960623
26. Weyermann M, Beermann C, Brenner H, Rothenbacher D. Adiponectin and leptin in maternal serum, cord blood, and breast milk. Clin Chem. 2006; 52: 2095–2102. doi:10.1373/clinchem.2006.071019 PMID:16990422
27. Yoon BH, Romero R, Shim JY, Shim SS, Kim CJ, Jun JK. C-reactive protein in umbilical cord blood: a simple and widely available clinical method to assess the risk of amniotic fluid infection and funisitis. J Matern Fetal Neonatal Med. 2003; 14: 85–90. doi:10.1080/jmf.14.2.85.90PMID:14629087
28. Luo Z-C, Nuyt A-M, Delvin E, Fraser WD, Julien P, Audibert F, et al. Maternal and fetal leptin, adiponec-tin levels and associations with fetal insulin sensitivity. Obes Silver Spring Md. 2013; 21: 210–216. doi: 10.1002/oby.20250
29. Odegård RA, Vatten LJ, Nilsen ST, Salvesen KA, Austgulen R. Umbilical cord plasma leptin is
increased in preeclampsia. Am J Obstet Gynecol. 2002; 186: 427–432. PMID:11904602
30. Jo HH, Hwang SJ, Kim MR, Kim JH, Lew YO, Lim YT, et al. Correlation between the duration of labor and leptin concentration in cord blood. Korean J Obstet Gynecol. 2005; 48: 709–715.
31. Lappas M. Insulin-like growth factor-binding protein 1 and 7 concentrations are lower in obese pregnant women, women with gestational diabetes and their fetuses. J Perinatol. 2015; 35: 32–38. doi:10.1038/ jp.2014.144PMID:25078866
32. Malek A, Bersinger NA, Di Santo S, Mueller MD, Sager R, Schneider H, et al. C-reactive protein produc-tion in term human placental tissue. Placenta. 2006; 27: 619–625. doi:10.1016/j.placenta.2005.05.009 PMID:16026834