EXTREME
HYDRO-METEOROLOGICAL
PHENOMENA
ON
THE
HYDROGRAPHICAL
BASIN
OF
TIMI
ù
RIVER
(1965-2009)
ANDREEA MIHAELA ARBA
1Abstract. -Extreme hydro-meteorological phenomena on the hydrographical basin of Timiú river (1965-2009). The study of extreme hydro-meteorological phenomena or of the climatic and hydrological risks involve a wide range of issues, which should start with the climatic and hydrological data and should end with the monitoring of the risk factors, in order to pass from the diagnosis analysis to the prognosis one. We intended to draw up such a comprehensive study as well because it combines the classical methodology (field research, deductive, inductive, historical methods) with the specific methodology of the Geographical Informational Systems (G.I.S.). To analyse the hydro-meteorological phenomena on the basin, we used the climatic and hydrological data collected on the field from 6 meteorological stations and from 5 hydrometric stations, during a common period of 45 years (1965-2009). The extreme hydro-meteorological phenomena which were identified on the basin and which were analysed in the study herein are: the extreme temperatures, the periods with pluviometric surplus, the heavy rains, the drought and dryness phenomena, as well as the floods.
Key words: extreme hydro-meteorological phenomena, climatic risks,
hydrological risks, Timiú river basin.
1.
I
ntroduction
The concept of extreme hydro-meteorological phenomena may be confused with the concept of hazard, taking into account that these extreme hydro-meteorological phenomena occur unexpectedly, cannot be predicted and are responsible for a series of rapid transformations that occur in the relief morphology. The specialty literature mentions the hazards as a potential source of danger, being associated with the natural or anthropogenic processes and phenomena that can affect the quality of the environment and can cause material or human losses (Zăvoianu, et. al., 1994, Grecu, Florina, 2004, Armaú, 2005).
1 West University of Timiúoara, Faculty of Chemistry, Biology and Geography, Department of
The hydro-climatic hazards or the extreme hydro-meteorological phenomena are part of the exogenetic hazards category, where the types of hazards have been grouped according to the systemic element whose dynamic induces the manifestation of the hazard, but also according to the agent causing and maintaining it (Stângă, 2007, p. 32). The extreme hydro-meteorological category includes: extreme temperatures;periods with pluviometric surplus; heavy rains;drought and dryness phenomena; storms, tornadoes and cyclones; other phenomena with special impact (hoar-frost, rime, glaze, fog, etc.); floods (Stângă, 2007, pp. 36-40).
All these phenomena have a very important role in the current shaping of the relief on the hydrographical basin, because these may accelerate a series of geomorphological processes (ravining, landslides, river bed changes, etc.) that may have consequences on the morphology and the morphometry of the studied basin, during long periods of time.
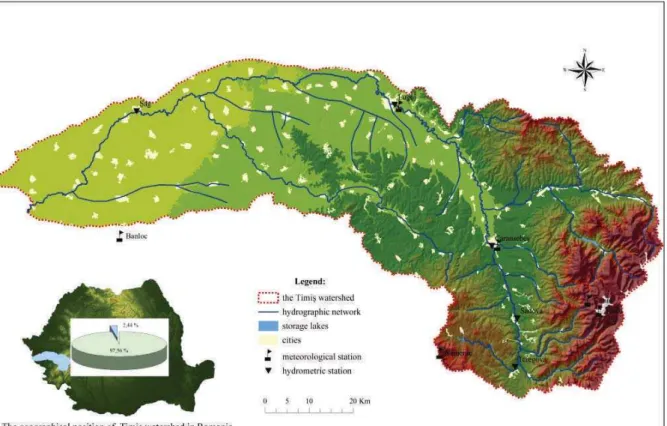
Timiú river, the main hydrographical artery from the western part of Romania, springs from Semenic Mountains, from approximately 1135 m altitude, collecting its waters from the mountainous area represented by: Banat Mountains, ğarcu Mountains, Godeanu Mountains and Poiana Ruscă Mountains, as well as the piedmont hills of Lugoj and Pogăniú, summing up a total surface of the hydrographical basin in our country of 5,795 km2, meaning approximately 2.44 % of the territory (fig. 1.) (Munteanu, Rodica, Maria, 1998, p. 9).
2.
Methodology
In order to analyse the extreme hydro-meteorological phenomena on the hydrographical basin of Timiú river, we collected climatic data (temperature, precipitations and heavy rains) and hydrological data (water discharge: minimum, maximum and average), from 6 meteorological stations (Semenic, ğarcu, Cuntu, Caransebeú, Lugoj and Banloc) and from 5 hydrometric stations on Timiú river (Teregova, Sadova, Caransebeú, Lugoj and ùag), during a common period of 45 years, from 1965 until 2009 (fig. 1).
These data were necessary to shape a general image related to the general climate and hydrological features of the basin, but also to correctly interpret the extreme hydro-meteorological phenomena, such as: extreme temperatures, periods with pluviometric surplus, heavy rains, drought and dryness phenomena, as well as floods. So we used several statistical methods for processing and interpreting data, for: calculating average values, identify the extreme values (absolute minimum and absolute maximum), making correlations between meteorological and hydrological parameters, calculating deviations, etc.
3.
Results
The types of hazards, which classify in the extreme hydro-meteorological phenomena category, may be classified in several categories, according to the factors triggering their occurrence, as it may be understood from the denomination of these phenomena. These may be grouped in two large categories, as follows: extreme climatic phenomena and extreme hydrological phenomena.
The extreme climatic phenomena from the Timiú river basin are represented by: extreme temperatures, periods with pluviometric surplus, heavy rains, drought and dryness periods, storms, cyclones and other special impact phenomena (hoar-frost, rime, glaze, fog, etc.).
Most of the times, the extreme variations of the meteorological phenomena, especially those of the air temperature and the precipitation quantity, are the basis of the unbalances occurred in the hydro-meteorological conditions, triggering the drought periods, affecting especially the agriculture, or the rainy periods, affecting the flows and producing floods, with serious consequences on the environment and the economy.
The analysis of extreme temperatures, of the absolute maximums as well as the absolute minimums, is very important because it shows the actual limits between which the air temperature ranges on the basin.
the sunny weather and drought phenomenon predominance, determined by invasions of tropical heat, which trigger high positive deviations of the air temperature compared to the normal one, many times with a unique or climatic record feature.
If we associate reduced precipitation quantities to these high temperatures, then the essential conditions for the occurrence of drought and dryness phenomena are fulfilled, constituting an important climatic risk for the analysed area (Stanciu, Eugenia, 2002, p. 76).
The certain occurrence interval of these maximum temperature values during the year is the interval ranging between 1 May and 15 September, and the highest frequency of their occurrence is recorded in the months of July and August. The high values of the air temperature, especially the absolute maximum values may cause associated risk phenomena during the hot air period, such as: heavy rains, hail storms, etc., depending on the convection intensity, having a special impact on the environment and the human society.
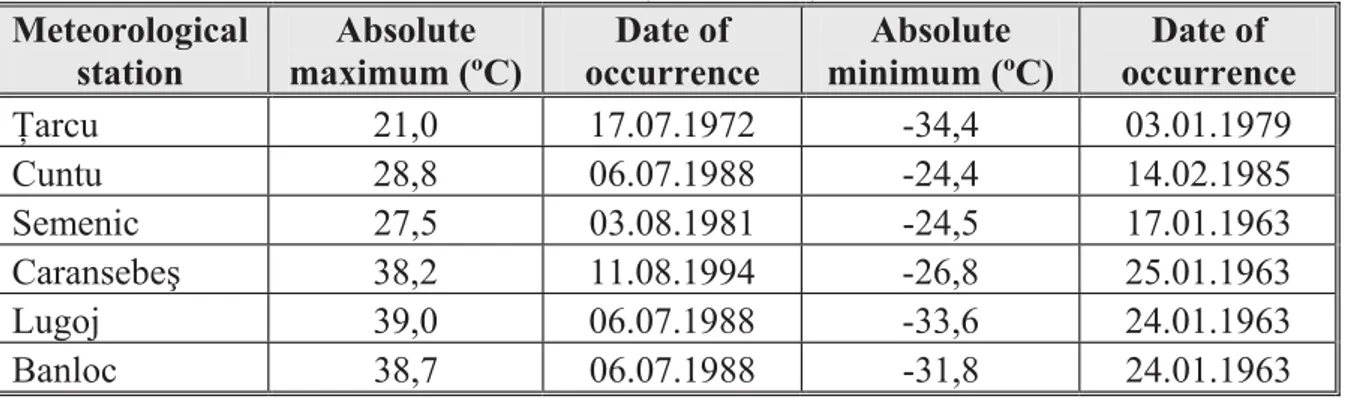
The highest values of the absolute maximum temperature (1960-1999) were recorded in July of 1988 at 3 of the 6 meteorological stations studied (39º C at Lugoj, 38.7º C at Banloc, and 28.8º C at Cuntu), and at the other 3 stations in: July 1972 at ğarcu (21º C), August 1981 at Semenic (27.5º C) and August 1994 at Caransebeú (38.2º C) (table 1).
Table 1. The extreme values of air temperature at the meteorological stations from the basin (1960-1999).
Meteorological station
Absolute maximum (ºC)
Date of occurrence
Absolute minimum (ºC)
Date of occurrence
ğarcu 21,0 17.07.1972 -34,4 03.01.1979
Cuntu 28,8 06.07.1988 -24,4 14.02.1985
Semenic 27,5 03.08.1981 -24,5 17.01.1963
Caransebeú 38,2 11.08.1994 -26,8 25.01.1963
Lugoj 39,0 06.07.1988 -33,6 24.01.1963
Banloc 38,7 06.07.1988 -31,8 24.01.1963
Source: Stanciu, Eugenia, 2002.
The minimum absolute values of air temperature occur in anticyclone conditions, when the East-European anticyclone ridge extends over Central and South-East Europe (Stanciu, Eugenia, 2002, p. 76), as well as by the negative thermal singularities and the cold waves that carry the polar air and the Arctic continental air from Greenland or from the Euro-Asian continent (the Greenland anticyclone and the East-European cyclone, rarely the Siberian cyclone) (Bogdan, Octavia, Niculescu, Elena, 1999, p. 30).
these phenomena is recorded in January, being considered the coldest month of the year in the hydrographical basin studied.
The reduced values of air temperature (the absolute minimum temperatures and the seasonal or monthly deviations) may have a negative impact, under various forms, from the negative effects on agriculture, caused by the late spring frosts or the early autumn frosts, causing the destruction of plants or of the cultures, up to the negative effects on the population, caused by the high thermal variations within a short interval, with the occurrence of risks for persons suffering from cardio-vascular disorders or of respiratory viroses.
The highest values of absolute minimum temperature (1960-1999) were recorded in January of 1963 at 4 of the 6 meteorological stations studied (-24.5º C at Semenic, -26.8º C at Caransebeú, -33.6º C at Lugoj and -31.8º C at Banloc), and at the other 2 stations in: January 1979 at ğarcu (-34.4º C) and February 1985 at Cuntu (-24.4º C) (table 1).
The analysis of the values referring to the absolute extreme interval reveals the fact that its value decreases as the altitude increases. Thus, taking into account the period 1960-1999, the absolute extreme interval varies, in the field area, between 74º C at Banloc and 72.6º C at Lugoj, and, in the mountainous area, between 52º C at Semenic and 55.4º C at ğarcu.
All these values, both maximum and minimum temperatures, as well as the absolute extreme intervals, confirm the fact that the hydrographical basin of Timiú river has a moderate climate feature, with oceanic influences from the West of the continent and Submediterranean from the South-West, with small variations, which have an extreme feature from one period to another, and with a quite reduced frequency.
The periods with pluviometric surplus are the consequence of the occurrence and the persistence of synoptic situations characterised by the predominance of some low-pressure areas, triggering the occurrence of humidity surplus (Bogdan, Octavia, Niculescu, Elena, 1999, quoted by Moldovan, 2003, p. 149).
The extremely rich atmospheric precipitations, produced on the basin over time, during the start period of monitoring the rivers and up to the present, have generated the overflow of Timiú river and its main tributaries, during several years, famous for the significant floods that have affected this area. The especially rainy years, which triggered extreme hydrological phenomena within this hydrographical space, such as floods, were: 1912, 1940, 1955, 1966, 1970, 1975, 1978, 1980, 1991, 1993, 1995, 1996, 1997 and 2005.
In order to identify the extremely rainy years and the periods with pluviometric surplus from the analysed period, firstly we calculated and, then, we interpreted the values of the Standardised Precipitation Index (SPI) for the 45 years of the studied period (1965-2009), at all the meteorological stations on the basin, by using statistical methods. Thus, the SPI values resulted from each station helped us identify 9 years with a very high pluviometric surplus: 1966, 1968, 1969, 1970, 1974, 1980, 1999, 2005 and 2007.
The frequency of the years with different SPI values are described in table 2, showing that the frequency values vary significantly, the highest value of 22.2% being recorded at the field meteorological stations (Lugoj and Banloc), and the lowest values at the Caransebeú meteorological station (15.5%). Moreover, the only meteorological station where the frequency of the years with pluviometric surplus (22.22%) exceeds the pluviometric defective years (13.3%) is the Banloc station. A reason could be the fact that it is located in the close proximity of the western extremity of the basin, closer to the oceanic influences from the west, than the other stations.
Table 2. The frequency of years with pluviometric surplus, according to the SPI values (1965-2009)
Meteor. station
Deficit ISP: -1
Normal ISP: -0,99
… 0,99
Moderately humid SPI: 1 .. 1,49
Very humid SPI: 1,5 … 1,99
Extremely humid SPI: 2
Total surplus
ğarcu 9 (20 %) 28 (62,2 %) 5 (11,2 %) 2 (4,4 %) 1 (2,2 %) 8 (17,8 %) Cuntu 9 (20 %) 28 (62,2 %) 4 (8,9 %) 4 (8,9 %) - 8 (17,8 %)
Semenic 9 (20 %) 28 (62,2 %) 4 (8,9 %) 2 (4,4 %) 2 (4,4 %) 8 (17,8 %) Caransebeú 8 (17,8 %) 30 (66,7 %) 2 (4,4 %) 4 (8,9 %) 1 (2,2 %) 7 (15,5 %)
Lugoj 10 (22,2
%) 25 (55,6 %) 6 (13,3 %) 2 (4,4 %) 2 (4,4 %)
10 (22,2 %)
Banloc 6 (13,3 %) 29 (64,5 %) 8 (17,8 %) - 2 (4,4 %) 10 (22,2 %)
Source: Data processed from the Archive of the Regional Meteorological Centre (R.M.C.) Banat-Criúana, Timiúoara
The heavy rains are responsible for the discharge in a very short time of large quantities of water, exceeding the infiltration and transportation capacity, as well as determining the occurrence of the humidity surplus, the erosion of soils and the formation of floods.
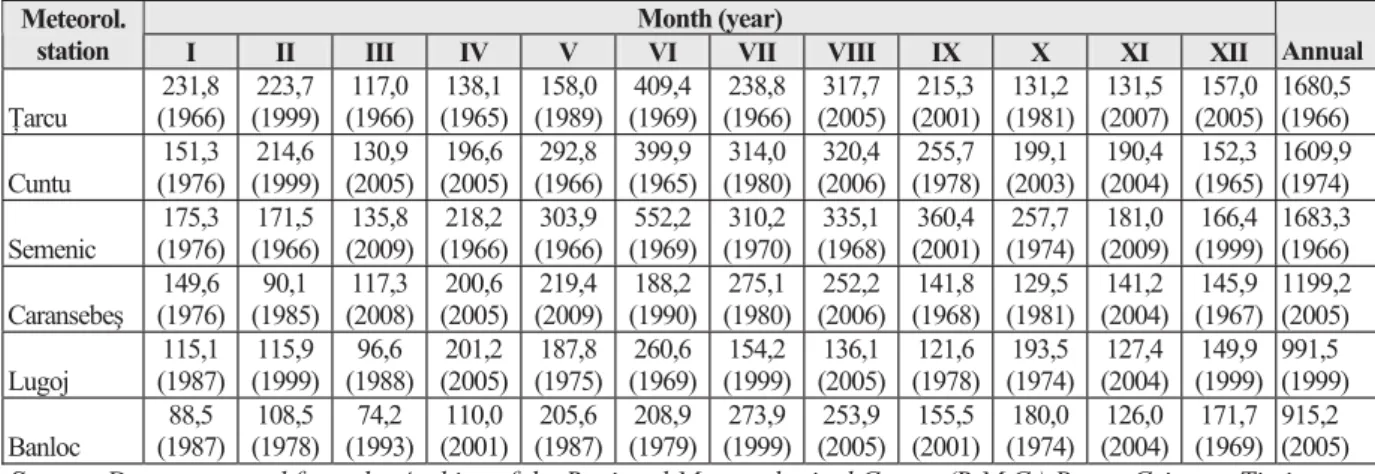
The identification of possible heavy rains fallen at various meteorological stations may be performed by analysing the monthly and annual maximum quantities of precipitations recorded at the meteorological stations on the basin. In the period analysed (1965-2009), the maximum precipitation quantities, the monthly and annual ones, from each meteorological station, recorded significant variations, as one may notice from the analysis of table 3. During the studied period, the largest annual quantity of precipitations, fallen on the entire basin, was recorded at the Semenic meteorological station, in 1966 and was of 1683.3 mm.
Table 3. The annual and monthly maximum extreme quantities of precipitations recorded at the stations on the basin (1965-2009).
Month (year) Meteorol.
station I II III IV V VI VII VIII IX X XI XII Annual
ğarcu 231,8 (1966) 223,7 (1999) 117,0 (1966) 138,1 (1965) 158,0 (1989) 409,4 (1969) 238,8 (1966) 317,7 (2005) 215,3 (2001) 131,2 (1981) 131,5 (2007) 157,0 (2005) 1680,5 (1966) Cuntu 151,3 (1976) 214,6 (1999) 130,9 (2005) 196,6 (2005) 292,8 (1966) 399,9 (1965) 314,0 (1980) 320,4 (2006) 255,7 (1978) 199,1 (2003) 190,4 (2004) 152,3 (1965) 1609,9 (1974) Semenic 175,3 (1976) 171,5 (1966) 135,8 (2009) 218,2 (1966) 303,9 (1966) 552,2 (1969) 310,2 (1970) 335,1 (1968) 360,4 (2001) 257,7 (1974) 181,0 (2009) 166,4 (1999) 1683,3 (1966) Caransebeú 149,6 (1976) 90,1 (1985) 117,3 (2008) 200,6 (2005) 219,4 (2009) 188,2 (1990) 275,1 (1980) 252,2 (2006) 141,8 (1968) 129,5 (1981) 141,2 (2004) 145,9 (1967) 1199,2 (2005) Lugoj 115,1 (1987) 115,9 (1999) 96,6 (1988) 201,2 (2005) 187,8 (1975) 260,6 (1969) 154,2 (1999) 136,1 (2005) 121,6 (1978) 193,5 (1974) 127,4 (2004) 149,9 (1999) 991,5 (1999) Banloc 88,5 (1987) 108,5 (1978) 74,2 (1993) 110,0 (2001) 205,6 (1987) 208,9 (1979) 273,9 (1999) 253,9 (2005) 155,5 (2001) 180,0 (1974) 126,0 (2004) 171,7 (1969) 915,2 (2005)
Source: Data processed from the Archive of the Regional Meteorological Centre (R.M.C.) Banat-Criúana, Timiúoara
Due to the fact that the heavy rains may have a special influence on the environment, it is very important to take into account in their analysis the climate parameters that size them, among which, according to the Hellman criterion, we may include: the average intensity, the total duration, as well as the quantity of water fallen (Stanciu, Eugenia, 2005, p. 162).
From the analysis of the heavy rains occurred on the basin, during a period of 30 years (1970-1999), we found that, almost every year, most of the stations record heavy rains, and that the year with the most frequent heavy rains recorded was 1998 (3 heavy rains at Semenic and 2 at Banloc), characterised by a pronounced instability. Other years with numerous heavy rains were: 1982, 1977, 1990 and 1991.
The periods with pluviometric surplus and the abundant precipitations are responsible for triggering several risk phenomena with an impact on the natural environment, such as: the erosion of the slopes, the mud sliding, the movement of large quantities of deposits, floods, etc., reason for which the analysis of such extreme phenomena is very important (Stanciu, Eugenia, 2005, p. 135).
The drought and dryness phenomena are the most complex climate phenomena, because these are caused by several main factors, among which: the absence of atmospheric precipitations, the reduced water reserve from the soil accessible to plants, the air humidity and temperature, the intense evaporation, the wind speed, etc. (Bogdan, Octavia, Niculescu, Elena, 1999, p. 115).
The pluviometric defective periods are those time intervals characterised by the lack or the drastic decrease of the precipitation quantities, which may trigger the risky climatic phenomenon, called drought, with a negative impact on human lives (Bryant, 1991, quoted by Moldovan, 2003, p. 152).
Among the multitude of factors that lead to the setting of these phenomena, the most important is the absence of atmospheric precipitations, which are due to the main anticyclone weather, determined by the predominance of the stationary baric anticyclone formations, with a large extension in Europe, influencing even the entire territory of Romania (Bogdan, Octavia, Niculescu, Elena, 1999, p. 116).
According to the evolutional phases of the sections and according to the water flow, we may differentiate several types of drought: the atmospheric drought, the paedological drought, the underground drought, the hydrological drought (potamological) and the hydraulic drought (Lambert and collab., 1990, quoted by Moldovan, 2003, p. 153).
From the climatic interpretation of droughts, we understand that the dry period is characterised by the absence of precipitations for 5 consecutive days, or by their presence, but in a very low quantity, without managing to exceed the daily average, and the dry period is determined by reduced quantities of precipitations, without managing to exceed 10.1 mm for 14 consecutive days during the cold season or for at least 10 consecutive days during the hot season (Donciu, 1928, quoted by Stanciu, Eugenia, 2002, p. 262).
The atmospheric drought represents a period with a significant deficit of precipitations or characterised by their total absence, in areas where normally this is not characteristic feature. Thus, it is directly related to the precipitation and temperatures regime, which recorded irregular high variations at each meteorological station on the hydrographical basin of Timiú river, as mentioned before.
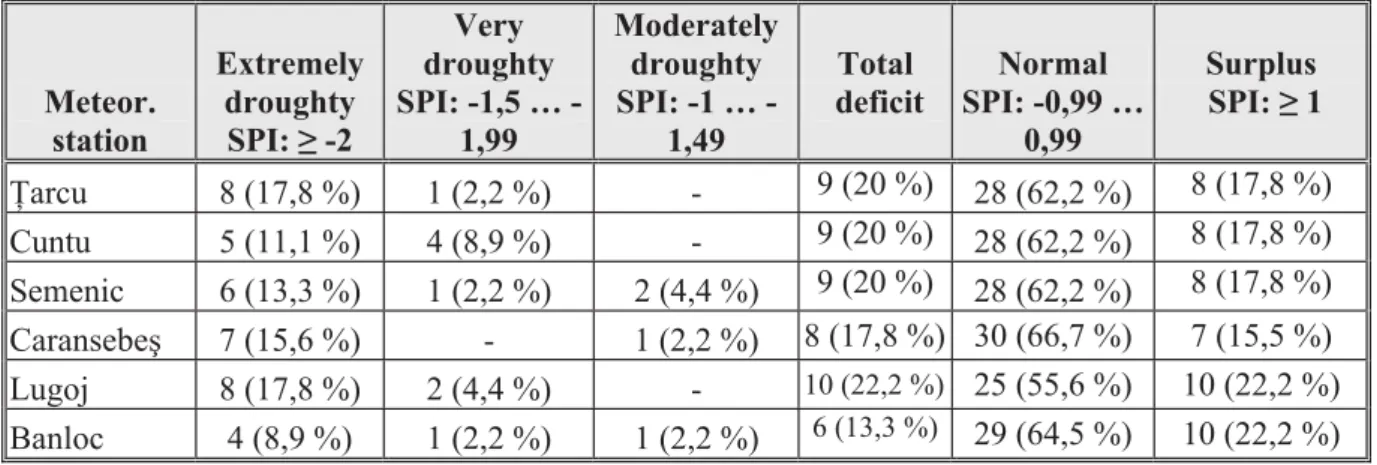
Regarding the frequency of pluviometric defective years, recorded at each meteorological station, from table 4, we notice that the largest frequency is recorded at the meteorological station from Lugoj, with 10 years (22.2 %), from the total of 45 years analysed, followed by the mountainous stations (ğarcu, Cuntu, and Semenic) with 9 pluviometric defective years (20 %), then a frequency of 8 years (17.8 %), recorded at the station at Caransebeú, and, finally, the smallest frequency, recorded in 6 cases, (13.3 %), the Banloc station, located at the lowest altitude. During the studied period, the smallest annual quantity of precipitations, fallen on the entire basin, was recorded at the Banloc meteorological station, in 2000 and was of 297.3 mm.
The fact that the Banloc meteorological station has a reduced frequency regarding the number of pluviometric defective years is explained through its position, in the western extremity of the basin, much more exposed to the oceanic masses of air, coming from the west side of the continent, than the other meteorological stations from the basin.
Table 4. The frequency of pluviometric defective years, according to the SPI values (1965-2009)
Meteor. station
Extremely droughty
SPI: -2
Very droughty SPI: 1,5 …
-1,99
Moderately droughty SPI: 1 …
-1,49
Total deficit
Normal SPI: -0,99 …
0,99
Surplus SPI: 1
ğarcu 8 (17,8 %) 1 (2,2 %) - 9 (20 %) 28 (62,2 %) 8 (17,8 %) Cuntu 5 (11,1 %) 4 (8,9 %) - 9 (20 %) 28 (62,2 %) 8 (17,8 %) Semenic 6 (13,3 %) 1 (2,2 %) 2 (4,4 %) 9 (20 %) 28 (62,2 %) 8 (17,8 %)
Caransebeú 7 (15,6 %) - 1 (2,2 %) 8 (17,8 %) 30 (66,7 %) 7 (15,5 %) Lugoj 8 (17,8 %) 2 (4,4 %) - 10 (22,2 %) 25 (55,6 %) 10 (22,2 %)
Banloc 4 (8,9 %) 1 (2,2 %) 1 (2,2 %) 6 (13,3 %) 29 (64,5 %) 10 (22,2 %)
Source: Data processed from the Archive of the Regional Meteorological Centre (R.M.C.) Banat-Criúana, Timiúoara
During the year, the largest pluviometric deficit is recorded in spring, in March and April, in autumn, especially in September and, in summer, in July and August. Certain months with a pluviometric deficit characterised at the same time several meteorological stations, like the months of April of 2007 and December of 1972, meaning that these climatic records did not have a local feature, but they were extended to the entire surface of the basin.
The category of extreme hydrological phenomena is represented by the hydrological drought and floods, but not entirely, because these phenomena may often be determined by certain climatic factors as well. For instance, although the floods are elements of the water dynamic, the agent that regulates this dynamic is, most of the times, of climatic origin (heavy precipitations or high temperatures determine the sudden melting of snows). The correct analysis of the extreme hydrological phenomena means considering the hydrological factors, as well as the climatic ones, which may trigger and influence the occurrence of these phenomena.
The hydrological drought is determined by the climatic abnormalities, which manifest as climatic changes in small areas, especially determined by the increase in temperature around the world. The drought may be defined as an abnormal period of dry weather, persisting for a long time in order to produce serious hydrological unbalances or as a period with a soil humidity deficit with a requirement of insufficient water for plants, animals and people. The supplies with surface and underground waters are under the normal average.
Due to the fact that the atmospheric drought was analysed before in the section related to the extreme climatic phenomena, triggered by a series of factors that are identical with the ones triggering the hydrological drought, we shall not discuss this type of drought in the current section.
Floods represent extreme hydrological phenomena generated by high waters or floods. The knowledge of flood genesis and production mechanisms offers the possibility of preventing and fighting the effects caused by these extreme phenomena.
The floods involve the temporary coverage with water of a land section as a consequence of the water level increase of a river, a lake or another mass of water. From a hydrological point of view, a flood can represent any water level increase or a flow over a level exceeding the minor river bed banks, however, according to some people, the term is used in a wrong way and it is confused with the one of flash floods (MustăĠea, quoted by Stângă, 2007, p. 39).
As a consequence of a wide range of relief forms comprised on the hydrographical basin of Timiú and determining a classification of the climatic parameters, as well as the result of the basin's exposure to the advection of the western, northern and south-western masses of air, in the area, high waters and flash floods occur during the whole year.
The majority of the floods occur in this region during spring, when the sudden melting of the snow or heavy rains occur on the water saturated soils. Most of the times, the two factors can combine or the warm rains can melt the snow accumulated during winter, leading to the formation of flash floods in this part of the country.
of large surfaces of land, thus producing numerous damages and even death, in some unfortunate cases.
The oldest floods occurred in this hydrographical space and recorded in certain historic documents of the time, without knowing clear hydrological data on these, are the ones from 1753. Then, the following major flash floods that affected Banat took place in: 1816, 1859, 1906, 1912, 1966, 1970, 1989, 1999 and 2000. The last and the worst floods of the last 43 years were the ones occurred in 2005, which were caused by: large precipitation quantities from the period, generated by the heavy cyclonic activity on the whole continent, the high air temperature, as well as the water quantity coming from the sudden melting of the snow.
By analysing the major floods produced in the hydrometric basin of Timiú river, in the last 250 years, we can notice that their regularity is of approximately 30 years, there existing cases when they occurred at intervals of several years (the floods from 2000, followed by the ones from 2005). Due to the fact that the floods occurred in this space represent a frequent natural event, which may have strong negative effects, the improvement of the flood fighting strategy through the implementation of the concept of "more space for rivers", the consolidation and the elevation of the dams where necessary and the application of non-structural measures of managing the floods are recommended (Stănescu, Drobot, 2006).
Records of the extreme hydro-meteorological phenomena
The extreme hydro-meteorological phenomena are located at the extreme limit (maximum or minimum possible) of variation and are represented by the highest and the lowest value of a relatively short series of statistical data (Bogdan, Octavia, Niculescu, Elena, 1999, p. 18-19).
Most of the times, the concept of extreme phenomena, either climatic or hydrologic, is confused with the synonym term of climatic and hydrologic records, meaning the climax in the evolution of these types of phenomena.
To identify the climatic and hydrologic records that caused large material damages and numerous deaths, we should consider the longest period of time, because the longer the period, the more significant is the record and the potential destructive consequences caused by it.
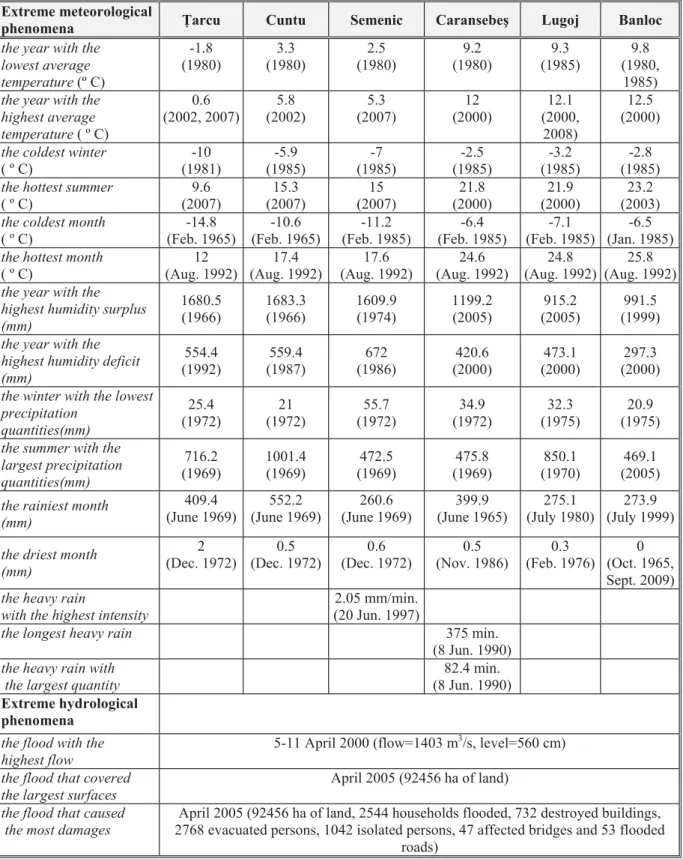
Table 5. Records of the extreme hydro-meteorological phenomena recorded on the Timiú river basin.
Extreme meteorological
phenomena ğarcu Cuntu Semenic Caransebeú Lugoj Banloc
the year with the lowest average temperature (º C)
-1.8 (1980) 3.3 (1980) 2.5 (1980) 9.2 (1980) 9.3 (1985) 9.8 (1980, 1985)
the year with the highest average temperature ( º C)
0.6 (2002, 2007) 5.8 (2002) 5.3 (2007) 12 (2000) 12.1 (2000, 2008) 12.5 (2000)
the coldest winter
( º C)
-10 (1981) -5.9 (1985) -7 (1985) -2.5 (1985) -3.2 (1985) -2.8 (1985)
the hottest summer
( º C)
9.6 (2007) 15.3 (2007) 15 (2007) 21.8 (2000) 21.9 (2000) 23.2 (2003)
the coldest month
( º C)
-14.8 (Feb. 1965) -10.6 (Feb. 1965) -11.2 (Feb. 1985) -6.4 (Feb. 1985) -7.1 (Feb. 1985) -6.5 (Jan. 1985)
the hottest month
( º C)
12 (Aug. 1992) 17.4 (Aug. 1992) 17.6 (Aug. 1992) 24.6 (Aug. 1992) 24.8 (Aug. 1992) 25.8 (Aug. 1992)
the year with the highest humidity surplus (mm) 1680.5 (1966) 1683.3 (1966) 1609.9 (1974) 1199.2 (2005) 915.2 (2005) 991.5 (1999)
the year with the highest humidity deficit (mm) 554.4 (1992) 559.4 (1987) 672 (1986) 420.6 (2000) 473.1 (2000) 297.3 (2000)
the winter with the lowest precipitation quantities(mm) 25.4 (1972) 21 (1972) 55.7 (1972) 34.9 (1972) 32.3 (1975) 20.9 (1975)
the summer with the largest precipitation quantities(mm) 716.2 (1969) 1001.4 (1969) 472.5 (1969) 475.8 (1969) 850.1 (1970) 469.1 (2005)
the rainiest month (mm) 409.4 (June 1969) 552.2 (June 1969) 260.6 (June 1969) 399.9 (June 1965) 275.1 (July 1980) 273.9 (July 1999)
the driest month (mm) 2 (Dec. 1972) 0.5 (Dec. 1972) 0.6 (Dec. 1972) 0.5 (Nov. 1986) 0.3 (Feb. 1976) 0 (Oct. 1965, Sept. 2009)
the heavy rain
with the highest intensity
2.05 mm/min.
(20 Jun. 1997)
the longest heavy rain 375 min. (8 Jun. 1990)
the heavy rain with the largest quantity
82.4 min.
(8 Jun. 1990)
Extreme hydrological phenomena
the flood with the highest flow
5-11 April 2000 (flow=1403 m3/s, level=560 cm)
the flood that covered the largest surfaces
April 2005 (92456 ha of land)
the flood that caused the most damages
April 2005 (92456 ha of land, 2544 households flooded, 732 destroyed buildings, 2768 evacuated persons, 1042 isolated persons, 47 affected bridges and 53 flooded
4.
Conclusions
The frequency of the natural hazards of hydro-meteorological origin, occurred on the hydrographical basin of Timiú river, during 1965-2009, according to the meteorological and hydrologic data statistically processed, is quite high. The most frequent phenomena recorded in the basin of Timiú river are: the extreme temperatures (60%), followed by a deficit of precipitations (28.89%), by the extremely humid periods (20%), by the heavy rains (20%) and by the floods (13.34%).
From a climatic point of view, the western region of the country, where the hydrographical basin of Timiú river is located, dominated by moderate oceanic influences, records a relatively low frequency, duration and intensity of the drought and dryness phenomena, compared to other parts of the country, but the frequency of the extremely humid periods is higher than in other parts of the country.
The years with precipitation deficit as well as the rainy ones, having a climatic record feature, should not be neglected, because they represent important climatic risks, especially for economy.
Regarding the extreme hydrologic phenomena, such as the floods, their negative effects could have been reduced, considering the fact that the hydrographical basin of Timiú river has a complex hydrotechnical fitting, being among the first regions in the country where such hydrotechnical works were executed. However, the floods recently occurred, the ones from: 2000 and 2005, were extraordinary, being caused by important quantities of precipitations fallen in a very short interval of time and the sudden melting of the snow. In order to avoid such similar calamitous situations, we should: raise the awareness of the public opinion regarding the correct perception of the flood risk and the responsibilities of communities and the local administrations from the Timiú river basin, the achievement of studies related to the areas that may be flooded, as well as of flood risk maps and the re-evaluation of the necessary measures for the protection against floods.
REFERENCES
1. Armaú, Iuliana, (2005) – Precizări terminologice: hazard, risc, vulnerabilitate, Terra, year XXXII-XXXIV (LII-LIV), Bucharest, pp. 195-200;
2. Bogdan, Octavia, Niculescu, Elena, (1999) – Riscurile climatice din România, Institute of Geography, Romanian Academy, Printed by Sega – InternaĠional Company, Bucharest, 280 p.;
4. Moldovan, F., (2003) – Fenomene climatice de risc, Echinox Publishing, Cluj Napoca, 210 p.;
5. Munteanu, Rodica, Maria, (1998) – Bazinul hidrografic al râului Timiú - studiu hidrologic, Mirton Publishing, Timiúoara, 210 p.;
6. Stanciu, Eugenia, (2002) – PrecipitaĠiile atmosferice din Banat (aspecte de risc), phD thesis (manuscript), Intitute of Geography, Romanian Academy, Bucharest, 328 p.; 7. Stanciu, Eugenia, (2005) – PrecipitaĠiile atmosferice din Banat (aspecte de risc),
Eurostampa Publishing, Timiúoara, 216 p.;
8. Stănescu, V., Al., Drobot, R., (2006) - Hydrometeorological characterisation of the flood from the period 14 – 30 April 2005 in the Timiú – Bega River Basin, Water Observation and Information System for Balkan Countries (BALWOIS) Conference, May 23–26, 2006, Ohrid, Macedonia;
9. Stângă, I., C., (2007) – Riscurile naturale. NoĠiuni úi concepte, Press of “Alexandru Ioan Cuza” University, Iaúi, 112 p.;
10. Zăvoianu, I., Dragomirescu, ù., (1994) – Asupra terminologiei folosite în studiul fenomenelor naturale extreme, Studii úi cercetări de Geografie, XLI, pp. 59-65;