99
Transactions of the VŠB – Technical University of Ostrava, Mechanical Series No. 1, 2013, vol. LIX
article No. 1943
Hana SRBOVÁ*, Ivan PIRNER**, Robert ZEMČÍK***, Rostislav MEDLÍN****
ANALYSIS OF FIBER DISTRIBUTION AND VOLUME RATIO OF UNIDIRECTIONAL COMPOSITE FOR MICROMODELS
ANALÝZA ROZLOŽENÍ A OBJEMOVÉHO PODÍLU VLÁKENJEDNOSM ROVÉHO KOMPOZITU PRO MIKROMODELY
Abstract
This work focuses on assessment of real fiber and matrix volume ratios of unidirectional fiber composites which will be used while designing corresponding micromodels. Scanning electron microscopy (SEM) was employed on samples with polished cross-sections. Obtained images of various parts of the composite cross-sections are analyzed by convolution with a circular binary mask and a suitably chosen spatial function using Matlab and its Image processing toolbox. The output of this analysis are center positions and radii of all fibers. Subsequently, the fiber and matrix volume ratios are easily determined.
Abstrakt
Tato práce je zam řena na zjišt ní skutečných objemových podílů vláken a matrice u jednosm rových vláknových kompozitů. Výsledky této analýzy budou dale využity při návrhu geometrie mikromodelu. Snímky nalešt ných průřezů kompozitových vzorků byly pořízeny pomocí řádkovacího elektronového mikroskopu. Získané snímky různých částí průřezů jsou analyzovány pomocí konvoluce s binární maskou a prostorovou funkcí s využitím softwaru Matlab a jeho Image processing toolboxu. Výstupem této analýzy jsou polohy středů a polom rů jednotlivých vláken zachycených na snímku. Hledané objemové podíly vláken a matrice jsou následn získány jednoduchým vztahem.
Keywords
image, cross-section, image processing, carbon, fiber
1 INTRODUCTION
All methods of fabricating unidirectional fiber reinforced composites result in a nonuniform distribution of fibers in the matrix (Fig.1 shows a typical cross-section). The fiber distribution affects the mechanical properties of the composite. In [1] the local stress fields and damage initiation in dependence on the fiber distribution are investigated. Although the fiber volume ratio f determines
the geometry of composite micromodels and subsequently the identified homogenized material
* Ing., Department of Mechanics, Faculty of Applied Sciences, University of West Bohemia, Univerzitní 8,
Plzeň, tel. Ě+420ě 37 763 2308, e-mail: [email protected]
**
Ing., Department of Cybernetics, Faculty of Applied Sciences, University of West Bohemia, Univerzitní 8,
Plzeň, tel. Ě+420ě ě 37 763 2584, e-mail: [email protected]
***
Ing., Ph.D., Department of Mechanics, Faculty of Applied Sciences, University of West Bohemia,
Univerzitní8, Plzeň, tel. Ě+420ě 37 763 2336, e-mail: [email protected]
****Ing., New Technologies - Research Centre in the West Bohemian Region, University of West Bohemia,
100
properties [2], it is a problem to determine it precisely. For example a finished fiber composite article made by transfer molding method typically ranges between approximately f =0,5 and f =0,6 [3].
2 EXPERIMENT
Five specimens were cut out from five different carbon/epoxy plates using water jet. Each plate was made of different number of autoclaved prepreg layers of different thickness. The specimens were fixed in epoxy and their cross-sections polished on a low speed polishing machine.
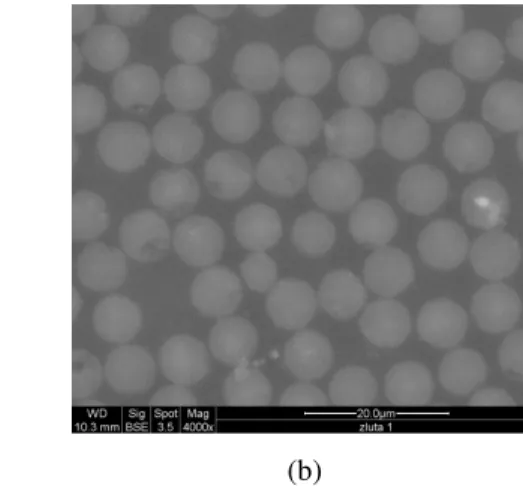
Grayscale images of various parts of cross-sections were obtained using a scanning electron microscopy. The composite cross-section was enlarged 1000 times (Fig. 1a) and 4000 times (Fig 1b).
(a) (b)
Fig. 1 Cross-section of a unidirectional fibrous carbon/epoxy composite
(a) enlarged 1000 times, (b) enlarged 4000 times
3 IMAGE PREPROCESSING
The grayscale image matrix with pixel intensity values ranging from 0 to 255 is preprocessed by dilation. Dilated image
f
x
,
y
is obtained as
x
y
f
g
x
y
f
x
x
y
y
g
x
y
x
y
D
B
f
,
,
max
(
,
)
(
,
)
,
(1)where:
x
y
g
,
– binary structuring matrix, (5×5) of ones, with rectangular domainD
B [4],y
x
,
– pixel coordinates.4 FIBER CENTER DETECTION
The preprocessed image (Fig. 2a), a circle binary mask of the minimum fiber cross-section size (Fig. 2b) and a discrete spatial matrix (Fig. 2c) are transformed with two dimensional discrete Fourier transform
,
,
)
,
(
1 0 1 0 πi 2
N n M m M my N nxe
y
x
f
v
u
F
(2) where:
u
v
101
N
M
,
– matrix dimensions [5].Fig. 2 (a) Preprocessed image (M×N = 883×1024)
Fig. 2 (b) Circular binary mask (M×N = 883×1024)
Fig. 2 (c) Bilinear ruled surface function non-zero in square
subdomain
Matrix in spatial frequencies obtained by discrete convolution
u
v
H
u
v
Q
u
v
F
v
u
G
(
,
)
,
,
,
, (3)where
H
u
,
v
is binary mask (Fig. 2(b)) andQ
u
,
v
is matrix (Fig. 2(c)) transformed by Fourier transform (2) [4] and its local maxima are considered as the fiber center positions.5 RADIUS AND AREA DETECTION
Further, a cluster analysis was applied on the input grayscale image segmented by thresholding. Cluster analysis is an iterative process where a set of objects (pixels in this case) in one group (cluster) are more similar to each other than to those in other groups. In this case a hierarchical clustering method was used to group the pixels to the initial cluster centroid positions in this case the identified fiber center positions. Fiber area S corresponds to the number of pixels assigned to its center (Fig. 3). Fiber radius r is approximated by
π
S
r
. (4)102
6 RESULTS
Tab. 1 Results of analysed image
Fiber volume ratio f 0.62
Arithmetic mean of fiber radii
r
51.58 pixelsFiber radii standard deviation (r) 5.05 pixels
7 CONCLUSIONS
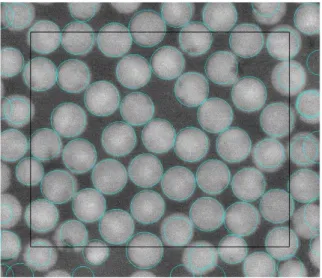
Fig. 4 Identified fibers and reduced part of image
Figure 4 shows the identified fibers on the input image. The analysis of fiber center position and diameter gives more precise results at the inner part of the cross section image. Therefore, data for further micromodel modeling are taken into account from a reduced part of the image. The fiber area on the reduced part has been divided by the reduced image area to obtain the fiber volume ratio.
ACKNOWLEDGEMENT
The work was elaborated in support of GA P101/11/0288, SGS-2013-036 and the CENTEM project, reg. no. CZ.1.05/2.1.00/03.0088 that is cofunded from the ERDF within the OP RDI programme of the Ministry of Education, Youth and Sports.
REFERENCES
[1] SORENSON, B. F. & TARLEJA, R.: Effects of nonuniformity of fiber distribution on thermally-induced residual stresses and cracking in ceramic matrix composites. Mechanics of Materials. 1993, vol. 16, pp. 351-363, ISSN 0167-6636
[2] LAŠ, V.: Mechanics of Composite Materials (in Czech), University of West Bohemia, Pilsen, 2008, ISBN 978-80-7043-689-9
[3] REAVELY, R. T. & Kim, W..: Method of fabricating fiber reinforced composite articles by resin transfer molding, United States Patent. Patent no. 4988469, Date of Patent Jan. 29, 1991
[4] Mathworks. (2013). User's Guide (R2013a). from www.mathworks.com/help/