Abstract— This work presents a new classification for the failure profiles in maintenance. This paper reviews original works of different authors in the area of maintenance and discusses new evidence or prior evidence to conclude that a new classification is necessary. This work progresses to use this new information in the management of industrial installations maintenance and include a guide to an effectiveness use of the new profiles.
Index Terms— failures, maintenance, profiles, reliability-centered-maintenance.
I. INTRODUCTION
N the middle of the 20th century the new technologies in the nuclear power plants, airplanes, nuclear submarines, aerospace devices they led to the need to develop tools that enable the safe use of these technologies. In particular from the airline industry grew out a systematic approach for the development of maintenance had become known as Reliability Centered Maintenance (RCM). The focus in this approach was put into the reliability of the components, the subsystems and the system. The RCM is based on a several questions:
What functions and standard performance of the equipment in its current operating context?
What functional failures might occur to fulfill its mission?
What causes every functional failure? What happens when each failure occurs? What is every failure is important?
What can you do to predict or prevent every failure?
Manuscript received March 23, 2015; revised April 9, 2015. This work was supported in part by the CONICET (Consejo Nacional de Investigaciones Científicas y Técnicas) and SeCTyP (Secretaría de Ciencia, Tecnolgía y Posgrado) of the Universidad Nacional de Cuyo, Argentina.
J.E. Núñez Mc Leod is with CONICET and Engineering Faculty of the Universidad Nacional de Cuyo, Mendoza, CO KFA5502, Argentina (phone: +54 261 4135000 ext. 2135; fax: +54 261 4380120; email: [email protected]).
P. Baziuk is with CONICET and Engineering Faculty of the Universidad Nacional de Cuyo, Mendoza, CO KFA5502, Argentina (phone: +54 261 4135000 ext. 2187; fax: +54 261 4380120; email: [email protected]).
R.D. Calvo Olivares is with CONICET and Engineering Faculty of the Universidad Nacional de Cuyo, Mendoza, CO KFA5502, Argentina (phone: +54 261 4135000 ext. 2100; fax: +54 261 4380120; email: [email protected]).
S.S. Rivera is with Engineering Faculty of the Universidad Nacional de Cuyo, Mendoza, CO KFA5502, Argentina (phone: +54 261 4135000 ext. 2135; fax: +54 261 4380120; email: [email protected]).
.
What should be done if a suitable proactive task cannot be found?
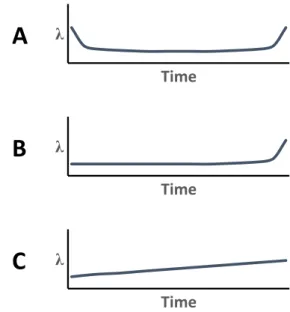
United Airlines made a work pioneer in this field setting the general framework and specific guidelines for the realization of this type of study. They studied the relationship between the failure rate (conditional failure probability) and operation times of the aircraft [1]. A first conclusion that emerged from that work was the characterization of the failure profiles of the various components of aircraft. These profiles took into account the components subject to wearout and which not. The Fig. 1 shows the failures profiles for equipments or components where the failure rate is related to the aged.
The profile A is the typical bathtub figure and it is associated with single components or mechanical equipment or installation design last in the 19th or early in the 20th centuries. This profile is the basis of livelihood of the classical approach to the aging of the components of equipment. It has assumed the existence of three parts in the graph. The so-called first child or infant death occurs in the first times of use of the equipment. It is characterized by the decrease in the time of the failure rate. The second part, is characterized by the failure rate constant in time, i.e. that the failure occurs randomly without depending on the operation time. Random failures occur once the latent defects have been removed. And finally, the third part is the final wearout of equipment or stage of old age, characterized by a fast
Failure Profiles for Maintenance in Industrial
Facilities
Jorge E. Núñez Mc Leod, Pedro Baziuk, Romina D. Calvo and Selva S. Rivera, Members, IAENG
I
λ
Time
λ
Time
λ
Time
A
B
C
Fig. 1. Failures rates, λ, versus time for components with aged process. The
A is the typical bathtub figure and began with a decremented failure rate in the early times of functioning.
growth of the failure rate.
The profile B is characterized by not having the first stage of the profile A and the profile C is characterized by a continuous increment of the failure rate.
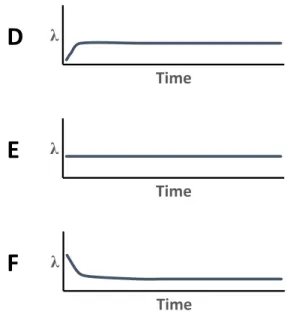
The Fig. 2 shows the failures profiles for equipments or components where the failure rate is random, i.e. the occurrence of the failure is not related with the age of the component.
The profile D initially shows a growth of the failure rate to reach a maximum value that will remain stable. Profile E is always stable y the profile E initially shows a decrement of the failure rate to reach a minimum value that will remain stable.
These six profiles are used from ´60s in the 20th century up to today to explain the maintenance decision.
II. THE IMPORTANCE OF THE FAILURE PROFILES
If the maintenance decisions are based on the belief in the validity of the failure rates profiles, it is relevant to research on applicability of each one of them in real cases. Several studies were done in this matter. Those results may be summarized in Table 1.
The A, B and C profiles are related with the aging in the
component. The A profiles identified the first approach to the failure rate evolution in time.
But, Table I shows that the A, B and C profiles only represent no more than 29% percent (in the case of SUBMEPP). Moreover, in the case of SSMD report B and C profiles were not found.
No evidence of wearout was found at least in 71% of the cases (SUBMEPP), 89% UAL, 92% Broberg, 77% MSDP and 93% SSMD.
It is important this generalized conclusion of all studies, regardless of the field. If the maintenance strategy is based on fixed time between maintenance and most of the equipment responds to random failure period, such a strategy makes no sense.
Over the decades of the 60´s and 70´s produced a fundamental shift in the importance of failure rates profiles. Shown in table 1 as being relevant F profile left to yield its place to the E profile (i.e., the best manufacturing techniques and quality control produced the elimination of early failures in a large number of components).
III. THE NEW PROFILES
T. Allen in [4] analysed the reliability data of a SSN 688 Class Salvage Air Valves and adjusted the profile using a fits linear and a 2nd order polynomial approximations. The result of both generated the vision of an A or C profile. However taking the same data and performing a set of 3rd order gets a better correlation (see Fig. 3).
But this profile does not conform correctly to any previously seen. And it is right to be so. Component shows in principle a worsening of their failure rate, then a period of the random failure and finally a period of failure due to wearout related to the aging.
These valves are installed under conditions of use that rapidly increasing the componente failure rate. It is simply an adaptation to the installation. Subsequently it should maintain stable fault rate during a period of time, given by the original design, and finally start the process of wearout normal due to the extreme conditions of use in the sea.
Other examples deliver the same results.
We conclude that this behavior is correct and not clearly shown by the profiles A, B or C. That is why we will propose as a new profile with its own characteristics. Fig 4. Shows the new profile proposed.
λ
Time
λ
Time
λ
Time
D
E
F
Fig. 2. Failures rates, λ, versus time for components with random failures.
TABLEI
PROFILE FAILURE RATES IN REAL CASES
UAL 1978
Broberg 1973
MSDP 1982
SSMD 1993
SUBMEPP 2001
A 4% 3% 3% 6% 2%
B 2% 1% 17% 10%
C 5% 4% 3% 17%
D 7% 11% 6% 9%
E 14% 15% 42% 60% 56%
F 68% 66% 29% 33% 6%
Notes: UAL is for United Airlines report [1] and Broberg report [2] were based on aircraft data. MSDP report [3] and SUBMEPP report [4] were based on navy vessel components and SSMD report [5] were based on electronic components.
y = 4E-05x3- 0,0008x2+ 0,0054x + 0,0215
R² = 0,2823
0 0,05 0,1 0,15 0,2
1 3 5 7 9 11 13 15 17 19
On the other hand a review of the information available on profiles of failure rates alerts us about the description, almost natural; the evolution of the failures rates for systems [6], [9] is not similar to the F profile. The profile used is not reflected on the A to F profiles. In the new profiles occurs during childhood, a marked variation in the failure rate (in the first case occurs an increase and in the second case a peak occurs in the system failure rate). This behavior can be interpreted in different ways (e.g. intervention in the elimination of failures latent when occur, the adaptations of the engineering when the problems occur with the installation to specific environmental conditions, etc.).
The Fig. 5 shows the new profile proposed. IV. PROFILES CLASSIFICATION
New profiles are the first to age-related profiles, while the second relates to profiles of random failure rates. Try to insert them only complicate the preexisting classification and would not help to clarify the new classification. For this reason it is preferable to propose a new classification along with the new profiles.
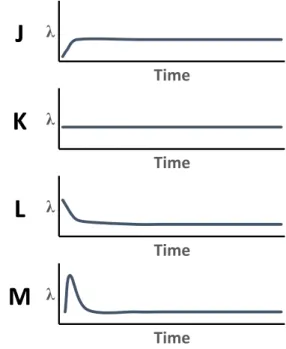
Profiles A to D will be profiles where fault rate is related to the age of component (see Fig. 7), while profiles J to M will be profiles with periods of random failure rates (see Fig. 8). For a reason of logical order the new profile of Fig. 5 it will be inserted as E and the previous E will now be profile D. As for the new profile seen in Fig. 6 will be M profile.
The new set of profiles has a major relationship with the results found in the practice of maintenance in the last decades and allows a better breakdown of behaviors of complex machinery. In this sense we can imagine a typical case of equipment for power generation (see Fig. 9). We caution that such graphic is now the combination of 3 profiles of failure rates. Profiles M, D and B, which result from interpreting fig. 9 from left to right.
We must understand that this interpretation has limited scope; but properly used can allow a most direct dialogue between the maintenance equipment. We can think of the profiles of the failures rates like basic figures for the construction of more complex blocks. And then, to use the
possibility of deconstruction in the root cause analysis for the adequate implementation of maintenance procedures.
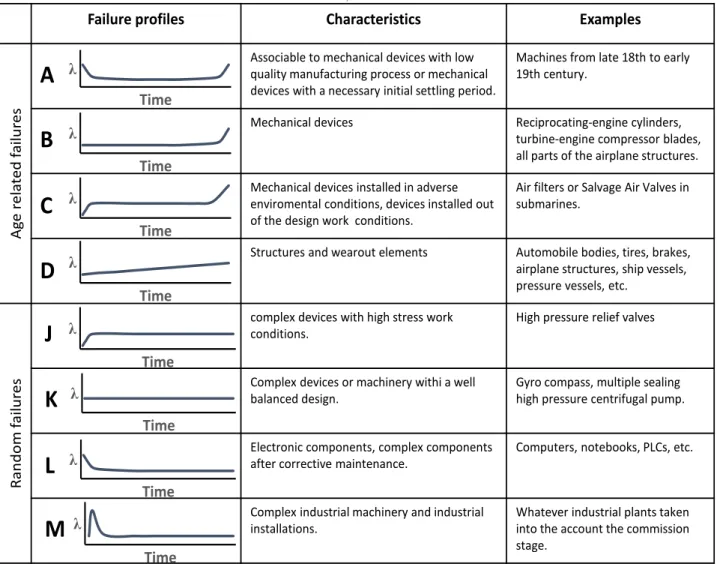
Table 2 shows the new classification with the main characteristics and some examples. Some examples was taken from [1], [4], [10].
λ
Time
Fig. 5. New profile proposed with two stage of strong aging.
λ
Time
Fig. 6. New profiles proposed with early unstability.
λ
Time
C
λ
Time
A
λ
Time
B
λ
Time
D
Fig. 7. New profile classification proposed for failure rates related with the age of the component.
λ
Time
M
λ
Time
J
λ
Time
K
λ
Time
L
Fig. 8. New profile classification proposed for random failure rates.
λ
Time
Fig. 9. The graph shows the behavior of the complex machine and their interpretation results straight forward. The figure is a combination of M, D and B profiles.
V. MAINTENANCE STRATEGIES
Taking into account the results of Table I, we warned that between 11% and 29% of the components are candidates for maintenance strategies related to the age of the component or its operation time. On the other hand in most of the cases of real life, 71% to 93%, components show profiles related to the period of random failure rates. So it cannot be benefited from a limit on operating age.
In 1998, Labib [11] introduced the maintenance Decision-Making Grid (DMG) where the performances of the worst machines are placed in a table with both criterions, frequency of failures and downtime (see Table III). Additional works introduced the DMG as a tool of CMMS [12-13] and even incorporating fuzzy logic decision making [15].
Operate to failure (OTF). Operate up to failure means not to make any safe maintenance planning ensure that there are sufficient resources to carry out repairs appropriate after the failure of the installation. Skill levels upgrade (SLU). A required upgrade of technicians skill levels for machinery failures that are easy to repair.
Condition-based maintenance (CBM). This maintenance is performed after one or more indicators show that equipment is going to fail or that equipment performance is deteriorating.
Design-out maintenance (DOM). The maintenance department would work on the engineering of this installation to modify the frequency of the failure and the downtime of the production.
Fixed time maintenance (FTM). Maintenance is carried out at regular intervals or by time, or facility overhauls, operation cycles, etc. Five alternatives are discriminated against in [11].
We must bear in mind that one of the main conclusions of the Table I was that most of the components of an installation were not benefiting from the FTM type strategies. Conversely should guide the selection of strategies towards the type of CBM. But historically the costs of this last strategy limited its application. But today the
TABLEII
PROFILE FAILURE CLASSIFICATION, CHARACTERISTICS AND EXAMPLES
Failure profiles Characteristics Examples
Ag
e
rel
a
ted
fai
lu
res
Associable to mechanical devices with low quality manufacturing process or mechanical devices with a necessary initial settling period.
Machines from late 18th to early 19th century.
Mechanical devices Reciprocating-engine cylinders, turbine-engine compressor blades, all parts of the airplane structures.
Mechanical devices installed in adverse enviromental conditions, devices installed out of the design work conditions.
Air filters or Salvage Air Valves in submarines.
Structures and wearout elements Automobile bodies, tires, brakes, airplane structures, ship vessels, pressure vessels, etc.
Ran
d
o
m
fai
lu
res
complex devices with high stress work conditions.
High pressure relief valves
Complex devices or machinery withi a well balanced design.
Gyro compass, multiple sealing high pressure centrifugal pump.
Electronic components, complex components after corrective maintenance.
Computers, notebooks, PLCs, etc.
Complex industrial machinery and industrial installations.
Whatever industrial plants taken into the account the commission stage.
λ
Time
A
λ
Time
B
λ
Time
C
λ
Time
D
λ
Time
J
λ
Time
K
λ
Time
L
λ
Time
M
TABLEIII DECISION MAKING GRID
Downtime
LOW MEDIUM HIGH
Fr
eq
u
en
cy LOW OTF FTM CBM
MEDIUM FTM FTM FTM
development of microelectronics of low-cost, wireless information transmission, increased power signal processing, it opens a new window of opportunity to improve the performance of the facilities. In this sense the possibility of applying CBM to a greater number of problematic components in the installation must be taken into account. To do so should consider as a first alternative in the DMG table (see Table IV).
VI. DISCUSSION
The worst equipment in the installation is present in the DMG table. This is important since then an average frequency of occurrence or an average downtime impact may be relevant to the installation.
Also although the CBM was initiated, due to costs, restricted to equipment whose failure had high risk for operators, the public and/or the environment, the falling prices in sensing and transmission of information systems allows us to think about expanding the set of installation components subject to CBM.
On the other hand an extension of CBM in the installation will lead to an improvement in the reliability of the production system, a decrease in maintenance costs and a decrease in maintenance tasks. This last becomes increasingly relevant. A number of studies show that facing the improvement of reliability of control systems, human error in maintenance takes on greater importance in the availability of industrial installations [16-21]. The famous phrase If it ain´t broke, don´t fix it become more relevant.
VII. CONCLUSIONS
Based on the exhibition on profiles of component failure rates of different facilities it can be concluded that:
a.New failure rates proposed, allow complete with findings from practice the proposed primitives profiles already 4 decades ago.
b.The new C profile faithfully interprets the behavior of new equipment that must adapt to their conditions of operation in its first stage and after a variable period of random failure begins a process of wearout.
c.The new profile M faithfully interprets the behavior of complex equipment or installations which in its first stage evidence a significant amount of latent failures.
d.The new classification allows managing in a more intuitive and didactic component failure profiles.
In terms of research on the appearance of the different failure rates profiles of real cases, it can be concluded that: a.The high population of the failure rates with random final
periods allows us to identify as a better strategy of maintenance the CBM, whenever technically and economically appropriate for installation.
b.The reduction in the cost of equipment condition monitoring allows us to think about broadening the implementation of the CBM to equipment fairly problematic.
c.The DMG update will provide the facility with additional benefits in the management of the maintenance.
VIII. FURTHER WORKS
Additional work will be carried out in relation to the current impact of the profiles of failure rates of different types of components in the more sensitive areas of the industry (e.g. power generation, aerospace, transportation, etc.).
It will work on the relationship of human error rate and its impact on the profiles of component failure rates.
We will work to obtain a quantitative measure of the actual impact on the costs of the current implementation of CBM.
REFERENCES
[1] F.S. Nowlan and H.F. Heap, Reliability-Centered Maintenance, United Airlines Report, USA, 1978.
[2] Broberg, Broberg´s report, USA, 1973, cited in Failure Diagnosis & Performance Monitoring, Vol. 11 edited by L.F. Pau, published by Marcel-Dekker, 1981.
[3] MSDP Studies, Age Reliability Analysis Prototype Study, American
Management Systems, U.S. Naval Sea Systems Command Surface Warship Directorate, USA, 1993.
[4] T.M. Allen, U.S. Navy of Submarine Maintenance Data and the
Development of Age and Reliability Profiles, Departament of Defense,
USA, 2001.
[5] SSMD report, USA, 1993, cited in Reliability-Centered Maintenance
Handbook, United State Navy, USA, 2007.
[6] Wind turbine bathtub curve, Outsmart, Available: www.out-smart.nl /Fnl/projectmanagementdiensten/.
[7] Bathtub curve, Siveco, China, Available: http://www.sivecochina. com/en/newsletter/
[8] M. Brown, Applying The Predictive Approach To Maintenance, Available: http://www.achrnews.com/articles/90029-applying-the-predictive-approach-to-maintenance.
[9] K. Kim, Effects of manufacturing defects on the device failure rate, Journal of the Korean Statistical Society, 42 (4), Elsevier, 2013. [10] B. Bertsche, Reliability in Automotive and Mechanical Engineering:
Determination of Component and System Reliability, Springer-Verlag, Germany, 2008
[11] A.W. Labib, A logistics approach to managing the millennium information systems problem, Logistic Information Management, 11 (5), 1998.
[12] A.W. Labib, World-class maintenance using a computerized maintenance management system, Journal of Quality in Maintenance Engineering, 4 (1), 1998.
[13] A.W. Labib, A decision analysis model for main tenance policy selection using a CMMS, Journal of Quality in Maintenance Engineering, 10 (3), 2004.
[14] O. Fernandez, R. Walmsley, D.J. Petty, and A.W. Labib, A decision support maintenance management system development and TABLEIV
DECISION MAKING GRID II
Downtime
LOW MEDIUM HIGH
Fr
eq
u
en
cy LOW OTF CBM/FTM CBM
MEDIUM FTM CBM/FTM CBM/FTM
implementation, International Journal of Quality and Reliability Management, 20 (8), 2003.
[15] T. Zulkifli, S.P. Anton, M.A. Burhanuddin, and A. Habibullah, Maintenance Decision Support Fuzzy System in Small and Medium Industries using Decision Making Grid, The International IEEE Conference on Advanced Computer Theory and Engineering
(ICACTE’08). Thailand, 2008.
[16] B.S. Dhillon, Human Reliability, Error, and Human Factors in Engineering Maintenance: with reference to aviation and power generation, CRC Press, 2009.
[17] P. Pyy, K. Laakso, and L. Reiman, Human Error in Maintenance Actions, an Experience based Study, Advances in Safety and Reliability, C. Guedes Soares (ed.), Elsevier, 1997.
[18] N.B. Sarter and R. Amalberti, Cognitive Engineering in the Aviation
Domain, CRC Press, 2000.
[19] J.E. Núñez Mc Leod & S.S. Rivera, Human Error on the Risk Reduction Actions during the NPP Maintenance, Lecture Notes in
Engineering and Computer Science, International Association of
Engineering, 2013.
[20] S.S. Rivera, J.E. Núñez Mc Leod, and D.R. Calvo, Latent Failures on Biodiesel Plants, Lecture Notes in Engineering and Computer
Science, International Association of Engineering, 2013.
[21] J.E. Núñez Mc Leod & S.S. Rivera, Human Error Hotspots in Nuclear Power Plants, Lecture Notes in Engineering and Computer Science, International Association of Engineering, 2011.
[22] D.N. Prabhaker Murthy and K.A. Helmy Kobbacy, Complex System