Identify a Direct Relation between Pi Content of an
Alkaline Compartment in Resting Muscle and
Phosphocreatine Resynthesis Kinetics in Active Muscle
in Humans
Joep W. M. van Oorschot
1*, Joep P. J. Schmitz
2,3, Andrew Webb
4, Klaas Nicolay
5, Jeroen A. L. Jeneson
5,6,
Hermien E. Kan
41 Department of Radiology, University Medical Center Utrecht, Utrecht, The Netherlands, 2 Systems Bioinformatics, Amsterdam Institute for Molecules, Medicines and Systems (AIMMS), VU University Amsterdam, Amsterdam, The Netherlands, 3 Computational Biology group, Department of Biomedical Engineering, Eindhoven University of Technology, Eindhoven, The Netherlands, 4 CJ Gorter Center for High field MRI, Department of Radiology, Leiden University Medical Center, Leiden, The Netherlands, 5 Biomedical NMR, Department of Biomedical Engineering, Eindhoven University of Technology, Eindhoven, The Netherlands, 6 Laboratory for Liver, Digestive and Metabolic Disease, University Medical Center Groningen, Groningen, The Netherlands
Abstract
The assessment of mitochondrial properties in skeletal muscle is important in clinical research, for instance in the study of diabetes. The gold standard to measure mitochondrial capacity non-invasively is the phosphocreatine (PCr) recovery rate after exercise, measured by γ1P Magnetic Resonance spectroscopy (γ1P MRS). Here, we sought to
expand the evidence base for an alternative method to assess mitochondrial properties which uses γ1P MRS
measurement of the Pi content of an alkaline compartment attributed to mitochondria (Piβ; as opposed to cytosolic Pi
(Pi1)) in resting muscle at high magnetic field. Specifically, the PCr recovery rate in human quadriceps muscle was
compared with the signal intensity of the Piβ peak in subjects with varying mitochondrial content of the quadriceps
muscle as a result of athletic training, and the results were entered into a mechanistic computational model of mitochondrial metabolism in muscle to test if the empirical relation between Piβ/Pi1 ratio and the PCr recovery was
consistent with theory. Localized γ1P spectra were obtained at 7T from resting vastus lateralis muscle to measure the
intensity of the Piβ peak. In the endurance trained athletes a Piβ/Pi1 ratio of 0.07 ± 0.01 was found, compared to a
significantly lower (p<0.05) Piβ/Pi1 ratio of 0.0γ ± 0.01 in the normally active group. Next, PCr recovery kinetics after
in magnet bicycle exercise were measured at 1.5T. For the endurance trained athletes, a time constant τPCr 1β ± γ s
was found, compared to β4 ± 5s in normally active subjects. Without any parameter optimization the computational model prediction matched the experimental data well (rβ of 0.75). Taken together, these results suggest that the Pi
β
resonance in resting human skeletal muscle observed at 7T provides a quantitative MR-based functional measure of mitochondrial density.
Citation: van Oorschot JWM, Schmitz JPJ, Webb A, Nicolay K, Jeneson JAL, et al. (β01γ) γ1P MR Spectroscopy and Computational Modeling Identify a Direct Relation between Pi Content of an Alkaline Compartment in Resting Muscle and Phosphocreatine Resynthesis Kinetics in Active Muscle in Humans. PLoS ONE 8(9): e766β8. doi:10.1γ71/journal.pone.00766β8
Editor: Stephen E Alway, West Virginia University School of Medicine, United States of America
Received May 1γ, β01γ; Accepted August β6, β01γ; Published September γ0, β01γ
Copyright: © β01γ van Oorschot et al. This is an open-access article distributed under the terms of the Creative Commons Attribution License, which permits unrestricted use, distribution, and reproduction in any medium, provided the original author and source are credited.
Funding: All authors were employed directly by their institute during the preparation of this work. No further sources of funding have supported the work. The funders had no role in study design, data collection and analysis, decision to publish, or preparation of the manuscript.
Competing interests: The authors have declared that no competing interests exist. * E-mail: [email protected]
Introduction
Non-invasive assessment of mitochondrial properties in human tissues including skeletal muscle is important in clinical research, for instance in diabetes, and sports medicine [1]. In vivo γ1P MR spectroscopy has been widely used for this assessment [β]. Specifically, the rate of phosphocreatine (PCr)
mitochondrial density and functionality, but also by perfusion of the muscle tissue [4], and the intensity of the exercise [5].
An alternative γ1P MRS technique to assess mitochondrial properties non-invasively is offered by magnetization transfer measurements, in which the oxidative ATP synthesis flux is measured by saturation of the -ATP peak resonance at β.5 ppm [6]. The advantage of this method over the PCr recovery assay is that it can be performed in resting muscle. However, the flux obtained from a γ1P saturation transfer experiment is dominated by the glycolytic exchange flux instead of the mitochondrial ATP synthesis flux [7]. As a result, the readout of mitochondrial properties using magnetization transfer is not straightforward. A more direct and fast in vivo measurement of mitochondrial properties under resting conditions would provide a major advance compared to these current methods.
In previous work at a magnetic field strength of 7 Tesla [8] our group observed a peak 0.4 ppm downfield from the cytosolic Pi resonance (Pi1) in resting human skeletal muscle. Based on the chemical shift value, the T1 characteristics, and the difference in intensity of the second peak between the soleus and tibialis anterior muscles, this signal was putatively attributed to the Pi pool inside the mitochondrial matrix (Piβ) [8]. If confirmed, this signal could provide a new biomarker for mitochondrial properties in muscle that may be assayed in subjects at rest. In this paper, we further investigated if the Piβ signal can provide information about mitochondrial properties. Specifically, the hypothesis was tested that the amplitude of the Piβ signal in resting muscle is a good indicator of mitochondrial density. To test this hypothesis, we conducted static and dynamic in vivo γ1P MRS measurements at 7T and 1.5T, respectively, in quadriceps muscle of normally-active subjects and trained athletes and tested if the relation between Piβ signal intensity of resting muscle and the rate of PCr recovery following exercise followed the theoretical relation between mitochondrial Pi content and mitochondrial density derived from a computational model of oxidative metabolism in muscle [9].
Experimental
Subjects
The study was conducted in ten healthy volunteers (age range β0-β7 years). Five subjects were highly trained endurance runners (exercise 6-9 times/week, 1-1.5 hour per training) (ATH). The other five subjects were reasonably physical active (running/cycling 1-β times/week, 1 hour per training) (REG). Written informed consent was obtained from all participants, and this study was approved by the local Medical Ethics Committee of the Leiden University Medical Center.
Static 31P MRS measurement at 7T
γ1P NMR data from resting skeletal muscle were acquired on a 7 Tesla Philips Achieva scanner (Philips Healthcare, Best, The Netherlands). Subjects were placed feet first in the magnet in a supine position. A custom-built transmit and receive double-tuned 1H and γ1P coil setup, with square coils for γ1P (10 cm) and 1H (1β cm), was placed on top of the vastus lateralis
muscle of the right upper leg. A B0 map was acquired for the image based shimming algorithm [10]. Shimming was performed on a manually drawn region of interest in the lateralis muscle. γ1P spectra were obtained using βD chemical shift imaging (CSI) with a field of view (FOV) of 160x160 mm; matrix size 8x8; Hamming weighted acquisition with γβ averages at the center k-lines. Slice thickness was determined by the coil size (10 cm). Adiabatic half passage 90 degrees RF pulses of γ.γ ms duration were applied with the transmitter frequency set at 5.0 ppm downfield from the PCr peak. The repetition time was set to 1680 ms, resulting in a total measurement time for the βD CSI of β0 minutes.
Dynamic 31P MRS measurements at 1.5T
Within one week after the 7 Tesla studies, PCr recovery data were acquired from all volunteers on the 1.5 Tesla system (Philips Healthcare, Best, The Netherlands), since no in-magnet exercise setup is available for the 7 Tesla scanner. A custom-built transmit and receive double-tuned 1H and γ1P coil setup with circular coils for γ1P (5 cm) and 1H (6 cm) was used, interfaced to a Bruker Biospin console. Exercise was performed using a MR-compatible bicycle ergometer for in-magnet exercise [11]. γ1P spectra were obtained with surface coil localization on the right vastus lateralis. To ensure similar coil placement in both the 7T and 1.5T scans, coil positioning was performed for all measurements by the same person. A pulse-acquire sequence was applied with adiabatic half passage pulses of β ms duration, with a repetition time of γs. Two free induction decays (FIDs) were averaged per spectrum, resulting in a time resolution of 6 seconds. Before exercise, a fully relaxed rest spectrum was acquired (8 averages), with a TR of γ0s. A light sensor was used to gate spectrometer data acquisition during cycling. Cycling was performed with a constant speed of 80 rotations per minute, indicated by a metronome. Exercise intensity was increased gradually, by adding weights onto the brake of the bicycle ergometer. Because PCr and Pi recovery are sensitive to cellular pH [5], we aimed for the same relative end-exercise intensity in each subject. Therefore the PCr level was monitored realtime, and exercise was stopped when a PCr depletion of 50% was reached, resulting in an end-exercise pH higher than 6.8 in all subjects. The total exercise time was 5 minutes on average. Directly after exercise, recovery was measured for 10 minutes.
Data processing
The CSI dataset was visualized using γDiCSI software, and a voxel was selected in the right lateralis muscle, located completely inside the muscle and remote from large visible blood vessels (Figure 1). The free induction decay was analyzed using the jMRUI software package. Peak areas for the two Pi signals from the 7T data and Pi, PCr and ATP signals from the 1.5T data were obtained by fitting Lorentzian line shapes and correcting for partial saturation effects [1β,1γ]. Correction was applied with a T1 of 1.4 seconds for Piβ, and 4.γ seconds for Pi1 [8]. The line width of the Piβ peak was constrained to the line width and phase of the Pi1 peak, to ensure a good fit for the Piβ peak.
Using a least squares method the PCr recovery curve was fitted to a mono-exponential model, to obtain time constant τPCr [14]. The peak areas for ATP and Pi were obtained for the fully relaxed γ1P spectra obtained at 1.5 T, and the Pi/ATP ratio was calculated.
Computational Modeling
A detailed biophysical model of cardiac mitochondrial ATP metabolism proposed by Beard and coworkers [15], and
adapted for skeletal muscle by Schmitz et al. [9,16] was applied to test if the empirical relation between Piβ/Pi1 and rate of PCr recovery was consistent with the theoretically expected relation. For a detailed description of the model we refer to [9]. In brief, the model comprises three cellular compartments (mitochondrial matrix, mitochondrial inter membrane space and cytoplasm). The model was developed by integration of mechanistic rate equations representing the processes of mitochondrial oxidative phosphorylation, adenine nucleotide
Figure 1. MRI image with CSI dataset. T1 weighted gradient echo image with the measured βD CSI dataset. The selected voxel in the vastus lateralis muscle with the related γ1P spectrum is shown in yellow.
transport across the mitochondrial membranes, cytoplasmic ATP buffering and hydrolysis. The accuracy of the model was previously tested by comparison of model predictions and data obtained from isolated mitochondria and γ1P MRS observed metabolite dynamics in human and rodent muscle [9,16]. Model predictions were performed using Matlab version 7.14.
The model was applied to predict the PCr recovery time constant (τPCr) for various mitochondrial volume fractions (ranging from 0.01 to 0.15 [ml mito/ml cell]). Each simulation was performed in three consecutive steps. First, a model initialization step was performed in which the model ATP hydrolysis rate was incrementally increased until a steady state PCr depletion level of 50% was achieved (similar to the experimental data). Next, cytoplasmic pH was set at 6.9, consistent with the end exercise values and ATP hydrolysis rate was decreased to resting values (0.01 mM/s [9]) in order to simulate 600s of recovery period. Finally, the time constant of PCr recovery (τPCr) was derived from the predicted PCr recovery dynamics by fitting of a mono-exponential function.
For each simulation the corresponding Piβ/Pi1 ratio was calculated according to the following equation
Piβ/Pi1 = Vmito * [Pirest]mitoMatrix / [Pirest]cytoplasm
where: Vmito is the mitochondrial volume fraction, [Pirest]mitoMatrix is the inorganic phosphate concentration in the mitochondrial matrix at rest and [Pirest]cytoplasm is the inorganic phosphate concentration in the cytoplasm. The [Pirest]mitoMatrix / [Pirest]cytoplasm ratio was predicted by the model ([Pirest]mitoMatrix / [Pirest]cytoplasm = 0.9β).
Statistics
Differences in pH, Piβ/Pi1, Pi/ATP and τPCr between the groups, trained athletes and healthy controls, were compared with a t-test and considered significant at P<0.05. The quality of the match between model predictions and experimental data was quantified by calculation of the coefficient of determination (Rβ).
Results
Static 31P MRS measurements at 7T
A typical 7T spectrum is shown in Figure β. A peak at 0.4 ppm downfield from the cytosolic Pi peak was detected in all subjects, indicating an alkaline pH compartment (Figure β). In the endurance trained athletes a Piβ/Pi1 ratio of 0.07 ± 0.01 was found. In the normally-active group the Piβ/Pi1 ratio was significantly lower at 0.0γ ± 0.01 (Figure γ).
Dynamic31PMRS measurements at 1.5T
An example of PCr dynamics during exercise and recovery is shown in Figure 4. For the endurance trained athletes, a mean time constant τPCr of 1β ± γ s (mean ± SD; n=5) was found, while in the normally active healthy subjects the mean value was significantly higher β4 ± 5s (mean ± SD; n=5) (Figure 5).
During and after exercise, tissue pH was determined based on the chemical shift between the Pi and PCr resonances. Average end-exercise pH was 6.9 ± 0.1 in all subjects of both
groups. No difference was observed in Pi/ATP at rest between groups.
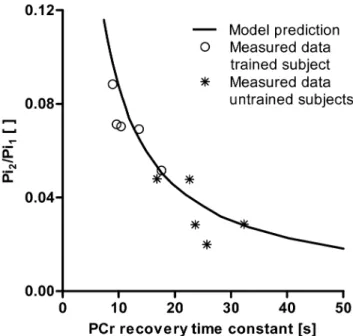
Experimental observations compared to model predictions
Figure 6 shows the comparison of the empirically observed relation between τPCr and Piβ/Pi1 and the predicted relation (solid black line). Without any model parameter optimalization already an excellent agreement between the experimental data and model predictions was observed (Rβ = 0.75).
Discussion
In this study, we investigated the relation between the Piβ/Pi1 ratio in resting quadriceps muscle and the PCr recovery rate following moderate exercise of the upper legs in healthy human subjects and trained athletes using a combination of experimental and numerical approaches. Specifically, the hypothesis was tested that the amplitude of the Piβ signal in resting muscle reflects the mitochondrial density of the muscle under investigation. If confirmed, γ1P MRS of resting human muscle at 7T may offer a novel, practical method for non-invasive assay of mitochondrial density and function in human muscle.
In agreement with a previous study [8], a Piβ resonance was reproducibly detected 0.4 ppm downfield from the cytosolic Pi (Pi1) signal in both the endurance trained and the normal physically active subjects. A twofold higher Piβ/Pi1 ratio was found in the quadriceps muscle of athletes compared to normally active subjects, as well as a faster PCr recovery rate. Both aspects confirm a higher oxidative capacity of quadriceps muscle in these trained individuals and are in agreement with the reported magnitude of increase of mitochondrial density in biopsy studies as a result of endurance training [17]. No significant difference was observed in Pi/ATP in resting spectra between the two groups. Assuming that endurance training has no major effect on ATP concentration in the cytoplasm, the higher Piβ/Pi1 ratio was therefore attributed to an increase in Piβ signal. Together, these results provides the first important new piece of evidence supporting the hypothesis that the Piβ resonance in resting muscle is associated with the mitochondrial pool in the tissue
The PCr recovery rate after exercise was significantly faster in the endurance trained athletes confirming a higher oxidative capacity of quadriceps muscle in these trained individuals. Any interference of differences in muscle fiber type recruitment between the trained and untrained group on PCr recovery dynamics was assumed to be small since similar exercise intensity caused 50% of PCr depletion in all subjects. Any interference from variation in muscle sampling arising from localization differences between the static and dynamic measurements were minimized by placement of the surface coil at the same position, by the same person who performed the high field measurements.
(Rβ = 0.75) with the theoretically expected relation taking into account the biochemical and biophysical properties of mitochondria. These results support the hypothesis that the Piβ/Pi1 ratio measured in resting skeletal muscle is closely related to mitochondrial density and therefore may provide a non-invasive biomarker of this important clinical parameter.
There is one concern regarding a strict mitochondrial origin of the Piβ signal in resting muscle that warrants addressing, in particular in the context of the present study. As discussed previously [8] free Pi in blood vessels within the NMR-sampled muscle mass could potentially contribute to the measured Piβ signal. Similar to the mitochondrial compartment, the pH in blood plasma is alkaline with a pH of 7.4 in resting humans [18]. Endurance training has been shown to cause an increase in capillary density of muscle [19]. The specific concern is therefore that the observed higher Piβ/Pi1 ratio in an endurance
trained subject could in part be the result of increased capillary density of their leg muscle. However, the maximal increase in capillary density as a result of extreme endurance training is reported to be on the order of β0-40% [β0]. In contrast, we found on average a β50% increase in normalized Piβ signal in trained quadriceps muscle compared to controls (Figure γ). Therefore any bias in our conclusions caused by increased capillary density of trained muscle was only minor. In all cases the voxel analyzed was carefully positioned inside the muscle tissue, and did not include any visible major blood vessels. We have investigated if the amplitude of the Piβ peak was significantly higher if we intentionally incluse visible vessels in the selected voxel. In most subjects however this was difficult, because the largest visible blood vessels are located further away from the surface coil, and therefore the S/N is not sufficient to separately observe the Piβ peak. In the subjects in
Figure 2. 31P spectra from a trained and an untrained subject. γ1P spectra from a trained and an untrained subject, after a γ Hz Lorentzian window function was applied. The Piβ intensity is higher in the trained subject. Spectra are scaled to the PCr resonance peak. Peaks visible: two signals for inorganic phosphate (Pi1 and Piβ), glycerol phosphocholine (GPC), glycerol phosphoethanolamine (GPE), phosphocreatine(PCr), -adenosine triphosphate ( -ATP). The inset shown the two signals for inorganic phosphate (Pi1 and Piβ) in the trained and untrained subjects in more detail.
Figure 3. Bar plot Pi2/Pi1 ratio trained/untrained. Bar plot of
Piβ/Pi1 ratio with a significant higher Piβ/Pi1 in the endurance trained athletes (0.07 ± 0.01) compared to the normal physical active group (0.0γ ± 0.01) (P < 0.05).
doi: 10.1γ71/journal.pone.00766β8.g00γ
which the S/N was high enough in the area with visible vessels, there was no significant difference in Piβ intensity with the chosen voxel in the lateralis muscle.
The ability to use γ1P MRS in resting skeletal muscle at high field as a tool to provide information about mitochondrial properties, may benefit clinical investigations of mitochondrial function in human muscle. Changes in mitochondrial function have been associated with several disorders, including diabetes [β1] and chronic heart failure [ββ]. In vivo mitochondrial capacity in these patients is quantified by the PCr recovery method [βγ]. In addition, often, muscle biopsy samples are obtained to determine whether a prolonged PCr recovery period is a result of a decreased number of mitochondria or intrinsic mitochondrial dysfunction. The Piβ/Pi1 read-out could provide similar information non-invasively; a decrease or even absence of any detectable Piβ/Pi1 resonances could point towards a reduced mitochondrial content, whereas no changes in Piβ/Pi1 ratio in combination with a prolonged PCr period could indicate the presence of actual intrinsic mitochondrial dysfunction. This information could also benefit the diagnosis of mitochondrial myopathies as well as follow-up of the efficacy of treatment strategies. This particular class of human mitochondrial disease is
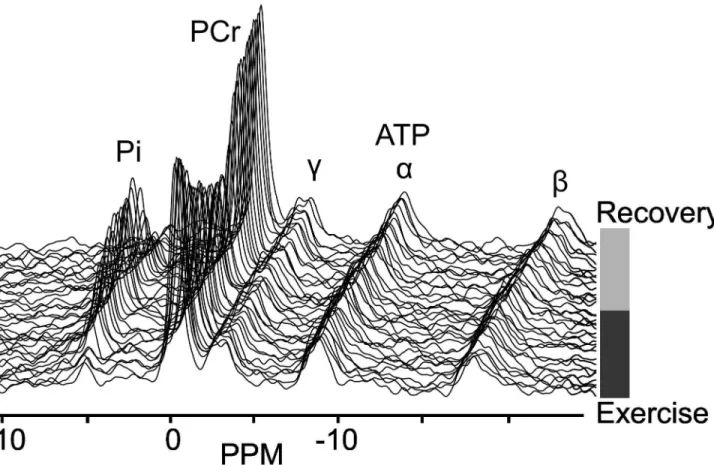
Figure 4. Dynamic series of 31P NMR spectra. Dynamic series of γ1P NMR spectra obtained from the lateralis muscle during bicycle exercise and recovery. Peaks visible are inorganic phosphate (Pi), phosphocreatine (PCr) and three signals for adenosine triphosphate ( -, α- and -ATP).
doi: 10.1γ71/journal.pone.00766β8.g004
characterized by a heterogeneous phenotype, ranging from patients with severe mitochondrial dysfunction reflected by a dramatic prolongation of PCr recovery kinetics to patients with more or less normal PCr recovery kinetics [β4]. The latter may be the result of a compensatory increase in the number of mitochondria, which should then be detectable by an increased Piβ/Pi1 ratio. Moreover, the non-invasive method for read-out of mitochondrial density proposed in the present study could be valuable in evaluating the effectiveness of stimulating mitochondrial biogenesis by e.g., exercise therapy.
A final promising aspect of the method is the fact that if the Piβ resonance amplitude in muscle reports on mitochondrial matrix Pi content, the Piβ resonance frequency reports on the pH gradient across the inner mitochondrial membrane (IMM). It has been well documented that mitochondria in resting muscle of patients with severe mitochondrial myopathy phenotypes cannot sustain a normal basal free energy potential for ATP hydrolysis [β5]. While this suggests a significantly reduced proton motive force across the IMM in these patients, this
corollary has in fact never been tested in vivo. Measurement of the Piβ resonance frequency at 7T in muscle of these patients could provide this wanting information, as well as provide an additional read-out for diagnosis and therapy effect monitoring.
In summary, this study provides evidence that the Piβ/Pi1 ratio measured in skeletal muscle is closely related to mitochondrial content. Testing the added value of this biomarker in clinical investigation of mitochondrial diseases
Figure 5. Bar plot of PCr recovery rate trained/untrained. Bar plot of PCr recovery rate with a significant faster τPCr in the endurance trained athletes (1β ± γ s) compared to the normal physical active group (β4 ± 5 s) (P < 0.05).
provides promising directions for future application of high-field in vivo NMR spectroscopy.
Author Contributions
Conceived and designed the experiments: JvO JS AW JJ HK KN. Performed the experiments: JvO JS HK. Analyzed the data: JvO JS HK. Contributed reagents/materials/analysis tools: JvO JS AW JJ HK KN. Wrote the manuscript: JvO JS JJ HK AW KN.
Figure 6. Model prediction of the relation between PCr recovery time constant and Pi2/Pi1. Model prediction of the
relation between PCr recovery time constant and Piβ/Pi1. Experimental data points from the trained group are indicated by o, and from the untrained group with *.
doi: 10.1γ71/journal.pone.00766β8.g006
References
1. Lanza IR, Nair KS (β010) Mitochondrial metabolic function assessed in vivo and in vitro. Curr Opin Clin Nutr Metab Care 1γ: 511–517. doi: 10.1097/MCO.0b01γeγβ8γγcc9γd. PubMed: β0616711.
β. Chance B, Im J, Nioka S, Kushmerick M (β006) Skeletal muscle energetics with PNMR: personal views and historic perspectives. NMR Biomed 19: 904–9β6. doi:10.100β/nbm.1109. PubMed: 17075955. γ. Chance B, Eleff S, Leigh JS Jr., Sokolow D, Sapega A (1981)
Mitochondrial regulation of phosphocreatine/inorganic phosphate ratios in exercising human muscle: a gated γ1P NMR study. Proc Natl Acad Sci U S A 78: 6714–6718. doi:10.107γ/pnas.78.11.6714. PubMed: 6947β47.
4. Haseler LJ, Hogan MC, Richardson RS (1999) Skeletal muscle phosphocreatine recovery in exercise-trained humans is dependent on Oβ availability. J Appl Physiol 86: β01γ–β018. PubMed: 10γ68γ68. 5. Van den Broek NM, De Feyter HM, de Graaf L, Nicolay K, Prompers JJ
(β007) Intersubject differences in the effect of acidosis on phosphocreatine recovery kinetics in muscle after exercise are due to differences in proton efflux rates. Am J Physiol Cell Physiol β9γ: Cββ8– Cβγ7. doi:10.115β/ajpcell.000βγ.β007. PubMed: 17γ9βγ8γ.
6. Kemp GJ (β008) The interpretation of abnormal γ1P magnetic resonance saturation transfer measurements of Pi/ATP exchange in insulin-resistant skeletal muscle. Am J Physiol Endocrinol Metab β94:
E640–E644; author reply: 10.115β/ajpendo.00797.β007. PubMed: 18γβ5881.
7. Van den Broek NM, Ciapaite J, Nicolay K, Prompers JJ (β010) Comparison of in vivo postexercise phosphocreatine recovery and resting ATP synthesis flux for the assessment of skeletal muscle mitochondrial function. Am J Physiol Cell Physiol β99: C11γ6–C114γ. doi:10.115β/ajpcell.00β00.β010. PubMed: β0668β1β.
8. Kan HE, Klomp DW, Wong CS, Boer VO, Webb AG et al. (β010) In vivo γ1P MRS detection of an alkaline inorganic phosphate pool with short T1 in human resting skeletal muscle. NMR Biomed βγ: 995–1000. doi: 10.100β/nbm.1517. PubMed: β0878975.
9. Schmitz JP, Jeneson JA, van Oorschot JW, Prompers JJ, Nicolay K et al. (β01β) Prediction of muscle energy states at low metabolic rates requires feedback control of mitochondrial respiratory chain activity by inorganic phosphate. PLOS ONE 7: eγ4118. doi:10.1γ71/journal.pone. 00γ4118. PubMed: ββ4705β8.
10. Schar M, Vonken EJ, Stuber M (β010) Simultaneous B(0)- and B(1)+-map acquisition for fast localized shim, frequency, and RF power determination in the heart at γ T. Magn Reson Med 6γ: 419–4β6 doi: 10.100β/mrm.βββγ4.
11. Jeneson JA, Schmitz JP, Hilbers PA, Nicolay K (β010) An MR-compatible bicycle ergometer for in-magnet whole-body human
exercise testing. Magn Reson Med 6γ: β57–β61. doi:10.100β/mrm. ββ179. PubMed: 19918886.
1β. Brown TR, Stoyanova R, Greenberg T, Srinivasan R, Murphy-Boesch J (1995) NOE enhancements and T1 relaxation times of phosphorylated metabolites in human calf muscle at 1.5 Tesla. Magn Reson Med γγ: 417–4β1. doi:10.100β/mrm.1910γγ0γ16. PubMed: 7760710.
1γ. Bogner W, Chmelik M, Schmid AI, Moser E, Trattnig S et al. (β009) Assessment of (γ1)P relaxation times in the human calf muscle: a comparison between γ T and 7 T in vivo. Magn Reson Med 6β: 574– 58β. doi:10.100β/mrm.ββ057. PubMed: 195β6487.
14. Meyer RA (1988) A linear model of muscle respiration explains monoexponential phosphocreatine changes. Am J Physiol β54: C548– C55γ. PubMed: γγ5465β.
15. Beard DA (β005) A biophysical model of the mitochondrial respiratory system and oxidative phosphorylation. PLOS Comput Biol 1: eγ6. doi: 10.1γ71/journal.pcbi.00100γ6. PubMed: 1616γγ94.
16. Wu F, Jeneson JA, Beard DA (β007) Oxidative ATP synthesis in skeletal muscle is controlled by substrate feedback. Am J Physiol Cell Physiol β9β: C115–C1β4. doi:10.115β/ajpcell.00βγ7.β006. PubMed: 168γ7647.
17. Holloszy JO, Booth FW (1976) Biochemical adaptations to endurance exercise in muscle. Annu Rev Physiol γ8: β7γ–β91. doi:10.1146/ annurev.ph.γ8.0γ0176.0014β1. PubMed: 1γ08β5.
18. Katz LA, Swain JA, Portman MA, Balaban RS (1988) Intracellular pH and inorganic phosphate content of heart in vivo: a γ1P-NMR study. Am J Physiol β55: H189–H196. PubMed: γγ94819.
19. Ingjer F (1979) Effects of endurance training on muscle fibre ATP-ase activity, capillary supply and mitochondrial content in man. J Physiol β94: 419–4γβ. PubMed: 159945.
β0. Andersen P, Henriksson J (1977) Capillary supply of the quadriceps femoris muscle of man: adaptive response to exercise. J Physiol β70: 677–690. PubMed: 1985γβ.
β1. Mogensen M, Sahlin K, Fernström M, Glintborg D, Vind BF et al. (β007) Mitochondrial respiration is decreased in skeletal muscle of patients with type β diabetes. Diabetes 56: 159β–1599. doi:10.βγγ7/db06-0981. PubMed: 17γ51150.
ββ. Drexler H, Riede U, Münzel T, König H, Funke E et al. (199β) Alterations of skeletal muscle in chronic heart failure. Circulation 85: 1751–1759. doi:10.1161/01.CIR.85.5.1751. PubMed: 1γ15ββ0. βγ. Kemps HM, Prompers JJ, Wessels B, De Vries WR, Zonderland ML et
al. (β010) Skeletal muscle metabolic recovery following submaximal exercise in chronic heart failure is limited more by O(β) delivery than O(β) utilization. Clin Sci (Lond) 118: β0γ–β10. doi:10.104β/ CSβ0090ββ0. PubMed: β0γ10084.
β4. Jeppesen TD, Quistorff B, Wibrand F, Vissing J (β007) γ1P-MRS of skeletal muscle is not a sensitive diagnostic test for mitochondrial myopathy. J Neurol β54: β9–γ7. doi:10.1007/s00415-006-0ββ9-5. PubMed: 17β78044.