Traffic mortality of four ungulate species
in southern Finland
Milla Niemi1, Juho Matala2, Markus Melin3, Visa Eronen4, Hannu Järvenpää5
1 University of Helsinki, Department of Forest Sciences, P.O. Box 27, FI-00014 University of Helsinki, Finland 2 he Natural Resources Institute Finland, P.O. Box 68, FI-80101 Joensuu, Finland 3 University of Eastern Finland, School of Forest Sciences, P.O. Box 111, FI-80101 Joensuu, Finland 4 Finnish Wildlife Agency, Sompiontie 1, FI-00730 Helsinki, Finland 5 Hyvinkää Game Management Association, Suopellontie 258, FI-05720 Hyvinkää, Finland
Corresponding author:Milla Niemi ([email protected])
Academic editor: A. Seiler | Received 31 December 2014 | Accepted 18 June 2015 | Published 28 July 2015
http://zoobank.org/A6107B77-7D58-4FCB-A0DE-BFB67A34C14D
Citation: Niemi M, Matala J, Melin M, Eronen V, Järvenpää H (2015) Traffic mortality of four ungulate species in southern Finland. In: Seiler A, Helldin J-O (Eds) Proceedings of IENE 2014 International Conference on Ecology and Transportation, Malmö, Sweden. Nature Conservation 11: 13–28. doi: 10.3897/natureconservation.11.4416
Abstract
Ungulate–vehicle collisions are intensively studied in many countries. However, limited knowledge exists on how many animals struck actually die due to collisions and whether diferences in traic mortality occur between species living in the same area. In this study, we estimated a kill rate (the proportion of individuals killed/struck) and, in relation to their winter population sizes, the collision and traic mortality rates for four ungulate species (moose Alces alces, white-tailed deer Odocoileus virginianus, roe deer Capreolus capreolus, and fallow deer Dama dama). We used an unoicial collision register collected between 2001 and 2012 (a total of 12 years) by voluntary hunters from the Hyvinkää Game Management Area (323 km2) located in southern Finland. he population estimates used were based on annual snow
track censuses. A total of 497 ungulates were involved in collisions during the study period. Of these, 76% were killed directly or put down afterwards. Roe deer had the highest kill rate; 95% of struck individuals died. White-tailed deer had the highest collision and traic mortality rates (8.0% and 6.5% of the winter population, respectively), followed by moose (6.5 % and 4.5%), roe deer (3.9% and 3.7%), and fallow deer (3.2% and 2.1%). As we found the collision and traic mortality rates to be unequal between species, we recommend separately reporting all ungulate species when compiling collision statistics. We additionally suggest that local managers should be aware of ungulate collision and traic mortality rates in their areas and should use this knowledge when planning annual harvest.
http://natureconservation.pensoft.net
Copyright Milla Niemi et al. This is an open access article distributed under the terms of the Creative Commons Attribution License (CC BY 4.0), which permits unrestricted use, distribution, and reproduction in any medium, provided the original author and source are credited.
Keywords
Deer–vehicle collision, moose–vehicle collision, population size, collision rate, traic mortality rate, game management
Introduction
Expanding road networks and globally increasing traic volumes have many negative efects on the environment and animals (e.g. Forman and Alexander 1998, Fahrig and Rytwinski 2009). Road-induced mortality is one of these impacts. Road kills are the single most important cause of death e.g. for Eurasian badgers (Meles meles) in Britain (Clarke et al. 1998) and for Florida Key deer (Odocoileus virgianus clavium) in Florida (Lopez et al. 2003). he European otter (Lutra lutra) is also an example of a species sufering from high traic mortality (Philcox et al. 1999, Hauer et al. 2002). Traic can also be a signiicant cause of death in many common and abundant species, e.g. many ungulates, without directly threatening their population persistence (Seiler and Helldin 2006).
Ungulate–vehicle collisions (UVCs) are a notable and increasing traic safety prob-lem in Europe, North America, and Japan, and are therefore intensively studied in many countries (Groot Bruinderink and Hazebroek 1996, Romin and Bissonette 1998, Seiler 2004, Huijser et al. 2009, Morelle et al. 2013). Nevertheless, human injuries and fatalities (e.g. Joyce and Mahoney 2001) or the economic consequences caused by UVCs (e.g. Bissonette et al. 2008) are not the only aspects researchers have considered.
Several studies have focused on the temporal and/or spatial patterns of UVCs (Finder et al. 1999, Haikonen and Summala 2001, Danks and Porter 2010, Roland-sen et al. 2011, Niemi et al. 2013a, Rea et al. 2014, Steiner et al. 2014) and developed models for the purpose of predicting collision sites (Seiler 2005, Found and Boyce 2011). Diferent mitigation measures such as overpasses (Olsson et al. 2008), fencing (Clevenger et al. 2001), or warning signs (Krisp and Durot 2007) have furthermore been developed with the aim of reducing the number or severity of accidents.
Ungulate traic mortality in relation to their population sizes is known in many countries. For example, the traic mortality of roe deer (Capreolus capreolus) has varied between 13% and 16%, depending on the country (Groot Bruinderink and Haze-broek 1996, Seiler et al. 2004, Pokorny 2006). Joyce and Mahoney (2001) calculated the same ratio for moose (Alces alces) in Newfoundland, Canada, and found that the traic mortality was only approximately 3% of the annual allowable harvest quota or 0.6% of the total population. In Sweden, these numbers were 10.1% and 4.0%, re-spectively (Seiler et al. 2004).
Finland has three abundant ungulate game species, whose populations are mainly regulated by hunting: the moose, which is spread across the country; the introduced white-tailed deer (Odocoileus virginianus), which has a dense population concentrated in southwestern Finland and the roe deer, which lives in the southern half of the coun-try (second largest distribution) at low densities (see Pulliainen 1980, Lavsund et al. 2003, Kekkonen et al. 2012, Finnish Wildlife Agency and Finnish Game and Fisher-ies Research Institute 2014). In addition, two small native populations of wild forest reindeer (Rangifer tarandus fennicus) live in central and northeastern Finland and a few small, introduced local populations of fallow deer (Dama dama) in southern Finland. he hunting of all these species, except for the roe deer, is based on licenses granted by wildlife authorities (Hunting Act 615/1993, Hunting Decree 666/1993).
During the 21st century, the annual country-level harvest for moose, white-tailed
deer, and roe deer has varied between 38–76 000, 14–26 000, and 1–4 000 indi-viduals, respectively. Other species are hunted only marginally; the annual hunting bag has varied between 20–130 individuals for wild forest reindeer and 50–200 individuals for fallow deer (Finnish Wildlife Agency and Finnish Game and Fisher-ies Research Institute 2014). At the same time, the total amount of annual colli-sions has varied between 1200–3000 for moose and 2600–4300 for the deer species (Finnish Traic Agency 2014). Traic is probably a signiicant cause of mortality for Finnish ungulate species, thus playing an important role when planning the an-nual harvest. his is particularly true for white-tailed deer, roe deer, and fallow deer, whose distributions are located near the most densely populated human settlements in southern Finland.
Study aim
he aim of our study was to estimate the traic mortality of four ungulate species living in the same area and to discover possible species diferences. First, we were inter-ested in how many percent of animals struck actually die due to collisions (later referred to as kill rate). Second, we wanted to investigate how many collisions have occurred in relation to species population sizes (later referred to as collision rate). Finally, we wanted to explore how large a proportion of the populations have died in the collisions (later referred to as traic mortality rate). We tested the hypotheses that 1) the collision rate is equal for all species and 2) the traic mortality rate is equal for all species.
Materials and methods
Study area
in southern Finland, in the Uusimaa region. Hyvinkää (land area 323 km2) is located
in a densely populated part of the country with approximately 46 000 inhabitants in 2012 (Statistics Finland 2014). Most of the landscape is highly dominated by humans; the city of Hyvinkää covers the central part of the area and several smaller villages exist especially in the south. Landscape structures outside these population centers range from a mosaic of cultivated areas and settlements to more forested areas found mainly in the western parts of the municipality.
he area is divided by fenced National Highway 3 (depending on the road section, the traic volume was approximately 20–30 000 vehicles/day in 2010; Finnish Trans-port Agency statistics; heavy traic included), route 130 (running parallel to Highway 3; 3200–3500 vehicles/day) and a railway. hese all run south to north, while in the east-west direction the area is limited by Highway number 25 (5–10 000 vehicles/day), which runs through the southern part of the area. Public road density is approximately 0.7 km/km2, with an annual traic low approximately 330 millions of kilometers in
2010 (Finnish Transport Agency statistics). here is additionally a dense network of minor roads and forestry tracks. he speed limit on the main roads varies depending on the road section and season, being 100 or 120 km/hour on Highway 3 and 60 or 80 km/hour on the other main roads.
Ungulate data
to report their bag (Hunting Act 615/1993, Hunting Decree 666/1993). he number of hunted individuals is thus known for each species.
he population estimate used in our study was based on an annual snow tracking census (Finnish Wildlife Agency and Finnish Game and Fisheries Research Institute 2014) coordinated by the Finnish Wildlife Agency and conducted by voluntary hunt-ers. In the Uusimaa region, where our study area is located, each hunting club tries to assess all the ungulate individuals living in their hunting area. To avoid double counting, the census is carried out everywhere during the same weekend. Where ani-mal populations are dense or snow conditions poor, the results of that census can be complemented with supplemental information from camera traps or other sources. he trends of an annual snow census from our study area are provided in Suppl. mate-rial 1: Annual trends in population size and collisions.
UVC data collection
Moose–vehicle accidents are registered at the species-level in the Finnish collision statistics, but crashes with other wild ungulates are treated as deer–vehicle collisions regardless of the species. Because we were interested in exploring the possible inter-spe-cies diferences, the existing nation-wide collision database was not usable. We instead used a local dataset collected from the Hyvinkää GMA area by voluntary hunters who work as oicial assistants to the police.
UVCs in Finland have to be reported to the police, but the crash sites are usually visited by the police only in cases where personal injuries or damage to the vehicle has occurred. he collision sites are instead checked by local hunters, who work as an executive assistance to the police. hese volunteers visit every UVC site, put the involved animal down if needed, and transport the carcass away from the road area. he volunteers do not have any registering duties, but will sometimes collect unoicial statistics for their own interests.
For our study, we used a speciic UVC dataset collected by voluntary hunters and maintained by the chief of the Hyvinkää GMA. his register contained detailed information concerning e.g. the species and post-collision condition of an animal. he register contained UVCs from between 2001 and 2012 (12 years in total).
Data analyses
traf-ic mortality rate was also based on the collision and snow census data (how many individuals died in collisions for each 100 individuals assessed in the snow census). We have converted our results to percentages (e.g. a calculated rate of 0.05 = 5%) to simplify the text.
We used Fisher’s exact test (e.g. Ranta et al. 1999) to test possible diferences between species. Contingency tables used for the analyses are presented in Suppl. material 2: Contingency tables. We used Fisher’s exact test with Bonferroni correc-tions for p-values for the post hoc analyses (MacDonald and Gardner 2000). Analyses were conducted using R software, version 3.1.3 (R Development Core Team 2015).
Results
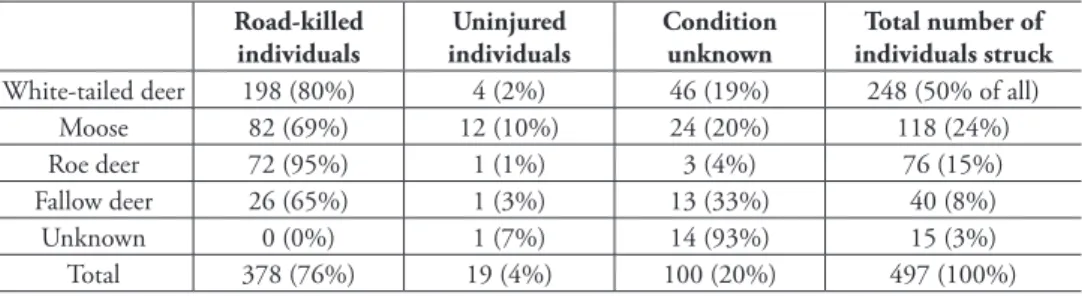
A total of 497 ungulates were involved in 493 collisions during the 12-year study pe-riod (Table 1, Suppl. material 1). One out of two collisions (N = 245; 50%) was a crash involving white-tailed deer, followed by moose (118; 24%), roe deer (75; 15%), and fallow deer (40; 8%). he species was unknown in 15 cases (3%).
A total of 378 individuals (76%) were killed directly in the collisions or put down afterwards (later referred to as road-killed) (Table 1). Roe deer was the most vulnerable species: 95% of individuals involved in crashes were killed and only one was found uninjured. he lowest kill rate (65%) was recorded for fallow deer, but concurrently the number of disappeared individuals was high.
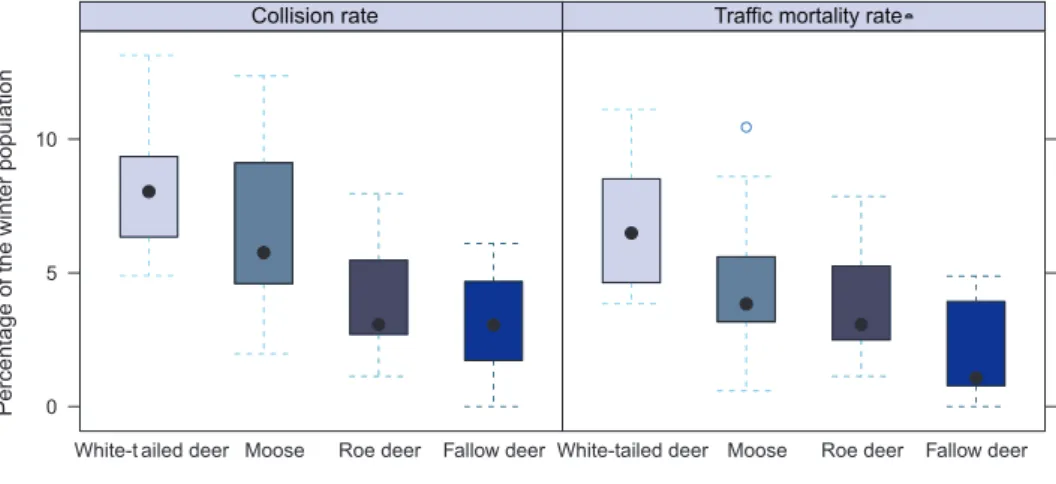
In comparison to population estimates derived from the snow track census data, white-tailed deer had the highest collision rate: 8.0% (8.0 collisions/100 individuals), followed by moose (6.5%), roe deer (3.9%), and fallow deer (3.2%) (Fig. 2). A statisti-cally signiicant diference was observed between species (DF = 3, p < 0.001). A paired post hoc comparison showed all species pairs except white-tailed deer & moose and moose & roe deer to difer (0.05 at the α-level) after the Bonferroni correction was applied (Table 2).
Table 1.Road-killed and struck but uninjured ungulates in the Hyvinkää GMA between 2001 and 2012 (a total of 12 years). Column “Condition unknown” contains animals that have disappeared from the col-lision site and have not been found later by tracking, and animals whose condition has not been recorded in the database used.
Road-killed individuals
Uninjured individuals
Condition unknown
Total number of individuals struck
White-tailed deer 198 (80%) 4 (2%) 46 (19%) 248 (50% of all) Moose 82 (69%) 12 (10%) 24 (20%) 118 (24%) Roe deer 72 (95%) 1 (1%) 3 (4%) 76 (15%) Fallow deer 26 (65%) 1 (3%) 13 (33%) 40 (8%)
Table 2. he results of the pairwise comparisons between species’ collision rates in the Hyvinkää GMA between 2001 and 2012 (a total of 12 years). Comparisons were made by using Fisher’s exact test and p -values were adjusted using the Bonferroni correction.
Species 1 Species 2 DF p-value
White-tailed deer Moose 1 0.048
White-tailed deer Roe deer 1 <0.001*** White-tailed deer Fallow deer 1 <0.001***
Moose Roe deer 1 <0.001**
Moose Fallow deer 1 <0.001***
Roe deer Fallow deer 1 0.332
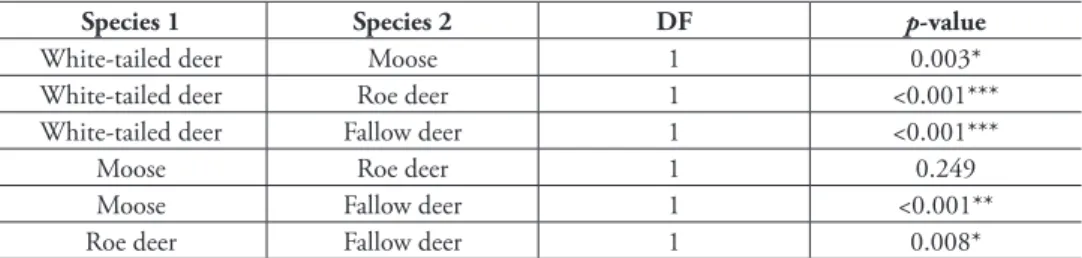
*** p < 0.001 after Bonferroni adjustment ** p < 0.01 after Bonferroni adjustment * p ≤ 0.05 after Bonferroni adjustment
Figure 2. Annual variation in collision and traic mortality rates for four ungulate species in the Hy-vinkää GMA between 2001 and 2012 (a total of 12 years).
Species
P
ercentage
of
the
w
inter
populatio
n
0 5 10
White-t ailed deer Moose Roe deer Fallow deer White-tailed deer Moose Roe deer Fallow deer
Collision rate Traffic mortality rate
When analyzing road-killed individuals only (i.e. excluding animals that had disappeared after the collision or were found uninjured), it became apparent that white-tailed deer had the highest traic mortality rate (6.5% or 6.5 road-killed indi-viduals/100 individuals) followed by moose (4.5%), roe deer (3.7%), and fallow deer (2.1%) (Fig. 2). Again, a statistically signiicant diference was found (DF = 3, p < 0.001), and in a paired comparison all species pairs except moose & roe deer difered (0.05 at the α-level) after the Bonferroni correction was applied (Table 3).
Discussion
Collision fatality for ungulates
UVCs, especially deer–vehicle collisions, are relatively rarely fatal for humans. he op-posite is true for animals. In our data, the smallest species, roe deer, was the most vul-nerable: 95% of crashes lead to the death of the animal. his percentage is almost the same (94%) as that found by Almkvist et al. (1980) in Sweden. his number was lower for other species, but the number of disappeared individuals was concurrently higher. It is not known how large a proportion of these animals has been wounded and would have died later due to the consequences of the collisions. However, when ignoring these disappeared individuals, the largest ungulate species, the moose, has the best pos-sibility of surviving a collision: 10% of individuals struck were found to be uninjured. his is similar to indings from Sweden (Almkvist et al. 1980; 8%) and Newfoundland, Canada (Joyce and Mahoney 2001; 11%). We thus note that the number of collisions with wild ungulates is more or less the same as the amount of road-killed animals. It is hence good to keep in mind that not all accidents are reported (e.g. Almkvist et al. 1980), and therefore the real number of collisions and further, the number of road-killed animals, may be larger than the number of registered accidents.
Although the size of the struck animal seemed to be an important factor afecting its possibility of surviving a collision, it is not necessarily the only one. Vehicle speed is the most important single variable that is connected to the severity of ungulate–ve-hicle collisions from the human point of view (Garret and Conway 1999, Joyce and Mahoney 2001), i.e. increasing speed increases the risk of human injuries or fatalities due to collisions. It is thus logical to assume that the probability that an animal struck would die in a collision is larger on highways with high speed limits than on second-ary roads. Unfortunately, the data we used contained no exact spatial information of collision sites or their speed limits so we were unable to test the possible efect of speed on the kill rate of animals.
Table 3. he results of the pairwise comparisons between species’ traic mortality rates in the Hyvinkää GMA between 2001 and 2012 (a total of 12 years). Comparisons were made using Fisher’s exact test and
p-values were adjusted using the Bonferroni correction.
Species 1 Species 2 DF p-value
White-tailed deer Moose 1 0.003* White-tailed deer Roe deer 1 <0.001*** White-tailed deer Fallow deer 1 <0.001***
Moose Roe deer 1 0.249
Moose Fallow deer 1 <0.001**
Roe deer Fallow deer 1 0.008*
Species-speciic collision and traic mortality rates
White-tailed deer had the highest collision and traic mortality rates: eight out of one hundred animals (in the wintering population) were involved in collisions, and the traic mortality rate was 6.5% of the population. Etter et al. (2002) studied the sur-vival rate of white-tailed deer in suburban Chicago and found traic-induced mortality to be almost twice as high as our results (a rate of 0.10 for does and 0.17 for bucks compared to 6.5% or 0.065 in our data), while Dusek et al. (1989) reported traic-related mortality of only 2% in autumn populations along the Lower Yellowstone River. We found the collision and traic mortality rate of moose to be 6.5% and 4.5% of the population, respectively. his was similar to what Seiler et al. (2004) estimated in Sweden, but lower collision rates have been found elsewhere (Groot Bruinderink and Hazebroek 1996, Joyce and Mahoney 2001). he roe deer traic mortality rate found by us was in concurrence with what other European countries reported in the early 1990s, while the fallow deer mortality rate was somewhat higher than reported elsewhere (Groot Bruinderink and Hazebroek 1996).
However, a straight comparison between collision or traic mortality rates from diferent areas without knowledge of other explanatory factors does not necessarily il-lustrate the whole picture. he actual amount of collisions, and hence the amount of road-killed animals, is afected by several factors. Population size is one of the impor-tant variables explaining the number of UVCs (Lavsund et al. 2003, Seiler 2004, Ro-landsen et al. 2011). In addition, though not always simple and linear, traic volume is probably one of the key factors afecting the number of UVCs (e.g. Seiler 2004, Seiler 2005, Balčiauskas 2009). Other factors such as wildlife fences, under- and overpasses, and the distribution of feeding sites can also have an efect on the amount of collisions especially at local scales, and further, the number of road-killed animals. hus, it is very likely that collision and traic mortality rates vary between diferent areas and/or over time, even at the same population density.
In this study, we were interested in the diferences concerning collision and traic mortality rates between species concurrently living in the same area. he traic low and environmental variables were thus same for all species, giving us the possibility of discussing and comparing species behavior-related factors.
the proximity of road areas. his is not necessarily true for white-tailed deer: Feldham-er et al. (1986) obsFeldham-erved that seasonal home ranges of some white-tailed deFeldham-er individu-als frequently overlapped a national highway. Although all the species we studied are adjusted to living in human-dominated landscapes, it is possible that the white-tailed deer utilizes more human-dominated areas of the landscape than the moose and is therefore more likely to cross roads during its daily routines.
In our study, roe deer and fallow deer had the lowest collision and traic mortality rates. his could be connected with the movement behavior of these animals. Studies con-ducted in southern Finland found the monthly home ranges to be smaller and the daily movement distances shorter for roe deer compared to white-tailed deer (Saari 2011, Hon-zová 2013). In addition, apart for the home range size, landscape use could be an important factor afecting collision probability. Putman (1997) reviewed the studies concerning the daily movements of diferent deer species and found that although all the species regularly crossed minor roads, major roads or railways could act as a home range border, at least for the roe deer and fallow deer. he movement behavior of fallow deer in Finland has not been studied, but in general it seems that the species is relatively local and therefore might be less vulnerable to traic than other ungulates. Groot Bruinderink and Hazebroek (1996) noted that the annual traic mortality of an Irish fallow deer population living in a park area surrounded by a heavy traic load was only approximately 7% of the population. On the other hand, the majority of fallow deer living in our study area were concentrated in the parts with no heavy traic or high speed limit roads, so it is very possible that our indings could be partly explained by the animals’ distribution in the ield.
Ungulate–vehicle collisions cannot happen without an animal being on the road, but the temporal peak of the road crossing rate of animals and the timing of collisions are not necessarily the same. Neumann et al. (2012) combined spatiotemporal moose movement data with the Swedish collision register and found that the road-crossing probability was highest in early summer and mid-winter, while moose–vehicle colli-sions peaked in autumn and winter or during annual migration. hey concluded that a high collision risk was related not only to animal movements, but also to light and road surface conditions. Moose–vehicle collisions in Finland are more likely to occur in autumn (Haikonen and Summala 2001), when the driving conditions are typically poor. Collisions with white-tailed deer also mainly occur during rutting season in late autumn. Contrastingly, both male roe deer movements and the roe deer collisions peak in late spring or early summer (Niemi et al. 2013b) during good light and road conditions. It may thus be possible that drivers are capable of avoiding some potential roe deer collisions because of good driving circumstances, leading overall to smaller collision and traic mortality rates than in the case of moose and white-tailed deer.
Road kills and an annual harvest
ani-mals for the relatively abundant white-tailed deer and moose were 10.3% and 6.9% of the annual harvest, respectively. For moose, this was comparable with the ratio found in Sweden (Seiler et al. 2004). However, it is very likely that these numbers varied be-tween areas, which should be considered by the local game authorities when planning annual harvests.
For fallow deer, the number of road-killed individuals was almost as high as the an-nual harvest. Although the data size was small and strong conclusions should therefore be avoided, our observation implicates the importance of taking species-speciic traic mortality into account when planning harvest quotas. Because the Finnish nation-wide collision register does not diferentiate between deer species, local-scale managers could beneit from their own, unoicial collision statistics.
Contrastingly to the relatively low traic mortality rate (3.7%) of the roe deer, the species’ traic mortality in relation to the hunting bag (30.9%) was high. Roe deer hunting in Finland is free of licenses, leaving more management responsibility to local hunting clubs and even individual hunters. he past decade has been somewhat diicult for roe deer in southern Finland; the increasing Eurasian lynx (Lynx lynx) population and several severe winters have inhibited the population increase that be-gan approximately two decades ago. It seems that hunters have tried to react to the changing situation by reducing their game bag; the annual amount of hunted roe deer compared to the estimated population size has decreased during the last few years in our study area (Finnish Wildlife Agency and Finnish Game and Fisheries Research Institute 2014). On the other hand, the annual amount of roe deer collisions has con-currently slightly increased (Suppl. material 1).
Conclusions
In our paper, we compared the collision statistics of four ungulate species (moose, white-tailed deer, roe deer, and fallow deer) living in the same area. Our main ind-ing shows that both the collision (collisions in relation to population size) and traic mortality rates (animals killed in collisions in relation to population size) of these four ungulate species difered. White-tailed deer and moose sufered the highest collision and traic mortality rates. hese rates were relatively low for roe deer and especially for fallow deer, although no strong conclusions could be drawn because of the limited amount of data especially in the case of fallow deer.
We were only able to show that the species-speciic collision and mortality rates difered, but were unable to evaluate the actual reasons behind our indings. Additional work is thus needed to investigate, which factors afect the amount of collisions, and further, how traic mortality afects ungulate populations.
there-fore be avoided. hus, in cases where the oicial collision register does not contain species-speciic information or does not exist at all, local managers may beneit from a detailed collision registering system such as the one used in our study area.
Acknowledgements
We warmly thank Andreas Seiler and Christer Rolandsen for presenting valuable com-ments considering the irst version of our manuscript and Stella hompson for cor-recting our language mistakes. he work of the irst author was funded by the Finnish Cultural Foundation and the Finnish Society of Forest Science, which is highly re-spected. Finally, we wish to present our efusive compliments to the voluntary hunters from the Hyvinkää GMA who collected the data we used, and who are continuing their valuable work.
References
Almkvist B, André T, Ekblom S, Rempler SA (1980) Slutrapport Viltolycksprojekt. (In Swed-ish with an EnglSwed-ish summary: Final report of the Game Accident Project). SwedSwed-ish Na-tional Road Administration, , Borlänge, Sweden, TU146: 1980–05, 117 pp. http://www. algen.se/assets/doclib/1/viltolycksprojektet-viol-slutrapport.pdf
Balčiauskas L (2009) Distribution of species-speciic wildlife-vehicle accidents on Lithuanian roads, 2002–2007. Estonian Journal of Ecology 58: 157–168. doi: 10.3176/eco.2009.3.01 Bissonette JA, Kassar CA, Cook LJ (2008) Assessment of costs associated with deer-vehicle col-lisions: human death and injury, vehicle damage, and deer loss. Human-Wildlife Conlicts 2: 17–27. http://digitalcommons.unl.edu/hwi/61/
Clarke GP, White PLC, Harris S (1998) Efects of roads on badger Meles meles populations in south west England. Biological Conservation 86: 117–124. doi: 10.1016/S0006-3207(98)00018-4
Clevenger AP, Chruszcz B, Gunson K (2001) Drainage culverts as habitat linkages and fac-tors afecting passage by mammals. Journal of Applied Ecology 38: 1340–1349. doi: 10.1046/j.0021-8901.2001.00678.x
Danks ZD, Porter WF (2010) Temporal, Spatial, and Landscape Habitat Characteristics of Moose-Vehicle Collisions in Western Maine. Journal of Wildlife Management 74: 1229–1241. doi: 10.2193/2008-358
Dusek GL, MacKie RJ, Herriges JD Jr, Compton BB (1989) Population ecology of white-tailed deer along the Lower Yellowstone River. Wildlife Monographs 104: 1–68. http:// www.jstor.org.stable/3830686
Fahrig L, Rytwinski T (2009) Efects of roads on animal abundance: an empirical review and synthesis. Ecology and Society 14: 21. http://ecologyandsociety.org/vol14/iss1/art21/ Feldhamer GA, Gates JE, Harman DM, Loranger AJ, Dixon KR (1986) Efects of interstate
highway fencing on white-tailed deer activity. he Journal of Wildlife Management 50: 497–503. http://www.jstor.org/stable/3801112
Finder RA, Roseberry JL, Woolf A (1999) Site and landscape conditions at white-tailed deer/ vehicle collision locations in Illinois. Landscape and Urban Planning 44: 77–85. doi: 10.1016/S0169-2046(99)00006-7
Finnish Environmental Institute (2009) CLC2006 Finland. Final technical report, Finn-ish Environmental Institute, Helsinki, Finland. http://ymparisto.i/download. asp?contentid=118299&lan=i
Finnish Wildlife Agency and Finnish Game and Fisheries Research Institute (2014) https:// riistaweb.riista.i/?lang=en
Finnish Traic Agency (2014) Hirvieläinonnettomuudet maanteillä 2013. [In Finnish with an English summary: Elk and deer accidents on highways in 2013]. Research reports of the Finnish Transport Agency 6/2014. http://www2.liikennevirasto.i/julkaisut/pdf8/ lti_2014-06_hirvielainonnettomuudet_maanteilla_web.pdf
Forman RTT, Alexander LE (1998) Road and their major ecological efects. Annual Review Ecology and Systematics 29: 207–231. doi: 10.1146/annurev.ecolsys.29.1.207
Found R, Boyce MS (2011) Predicting deer-vehicle collisions in an urban area. Journal of En-vironmental Management 92: 2486–2493. doi: 10.1016/j.jenvman.2011
Garret LC, Conway GA (1999) Characteristics of moose-vehicle collisions in Anchor-age, Alaska, 1991–1995. Journal of Safety Research 30: 219–223. doi:10.1016/S0022-4375(99)00017-1
Groot Bruinderink GWTA, Hazebroek E (1996) Ungulate traic collisions in Europe. Conser-vation Biology 10: 1059–1067. doi: 10.1046/j.1523-1739.1996.10041059.x
Haikonen H, Summala H (2001) Deer-vehicle crashes: Extensive peak at 1 hour after sun-set. American Journal of Preventive Medicine 21: 209–213. doi: 10.1016/S0749-3797(01)00352-X
Hauer S, Ansorge H, Zinke O (2002) Mortality patterns of otters (Lutra lutra) from eastern Germany. Journal of Zoology (London) 256: 361–368. doi: 10.1017/S0952836902000390 Heikkinen S (2000) Hirven vuosi (Summary in English: he year of the moose). Suomen Riista
48: 82–91.
Honzová M (2013) Analysis of habitat size and migration of roe and white-tailed deer in Finn-ish lake district, Finland. Diploma thesis. Mendel University, Brno. http://www.nusl.cz/ ntk/nusl-168547
Huijser MP, Duield JW, Clevenger AP, Ament RJ, McGowen PT (2009) Cost-beneit analy-ses of mitigation measures aimed at reducing collisions with large ungulates in the United States and Canada: a decision support tool. Ecology and Society 14(2): 15. http://www. ecologyandsociety.org/vol14/iss2/art15/
Joyce TL, Mahoney SP (2001) Spatial and temporal distributions of moose-vehicle collisions in Newfoundland. Wildlife Society Bulletin 29: 281–291. http://www.jstor.org/sta-ble/3784010
Kekkonen J, Wikström M, Brommer JE (2012) Heterozygosity in an isolated population of a large mammal founded by four individuals is predicted by an individual-based genetic model. PLoS ONE 7: e43482. doi: 10.1371/journal.pone.0043482
Krisp JM, Durot S (2007) Segmentation of lines based on point densities – An optimisation of wildlife warning sign placement in southern Finland. Accident Analysis and Prevention 39: 38–46. doi: 10.1016/j.aap.2006.06.002
Laurian C, Dussault C, Oullet J-P, Courtois R, Poulin M, Breton L (2008) Behavior of moose relative to a road network. Journal of Wildlife Management 72: 1550–1557. doi: 10.2193/2008-063
Lavsund S, Nygrén T, Solberg EJ (2003) Status of moose populations and challenges to moose management in Fennoscandia. Alces 39: 109–130.
Lopez RR, Vieira MEP, Silvy NJ, Frank PA, Whisenant SW, Jones DA (2003) Survival, mor-tality, and life expectancy of Florida Key deer. Journal of Wildlife Management 67: 35–45. http://jstor.org/stable/3803059
MacDonald PL, Gardner RC (2000) Type I error rate comparison of post hoc procedures for I j chi-square table. Educational and Psychological Measurement 60: 735–754. doi: 10.1177/00131640021970871
Morelle K, Lehaire F, Lejeune P (2013) Spatio-temporal patterns of wildlife-vehicle colli-sions in a region with a high-density road network. Nature Conservation 5: 53–73. doi: 10.3897/natureconservation.5.4634
Neumann W, Ericsson G, Dettki H, Bunnefeld N, Keuler NS, Helmers DP, Radelof VC (2012) Diference in spatiotemporal patterns of wildlife road-crossings and wildlife-vehicle collisions. Biological Conservation 145: 70–78. doi: 10.1016/j.biocon.2011.10.011 Niemi M, Tiilikainen R, Nummi P (2013a) Moose-vehicle collisions occur earlier in warm
springs. Acta heriologica 58: 341–347. doi: 10.1007/s13364-013-0151-z
Niemi M, Melin M, Matala J, Häggblom K, Hokkanen P, Tiilikainen R, Paasivaara A, Pu-senius J, Järvenpää H (2013b) Peuroja vai kauriita – mitä peurakolaritilastot sisältävät? (Summary in English: Monthly distribution of white-tailed deer and roe deer collisions in Southern Finland). Suomen Riista 59: 100–113.
Olsson MPO, Widén P, Larkin JL (2008) Efectiveness of a highway overpass to promote land-scape connectivity and movement of moose and roe deer in Sweden. Landland-scape and Urban Planning 85: 133–139. doi: 10.1016/j.landurbplan.2007.10.006
Philcox CK, Grogan AL, MacDonald DW (1999) Patterns of otter Lutra lutra road mortality in Britain. Journal of Applied Ecology 36: 748–762. doi: 10.1046/j.1365-2664.1999.00441.x Pokorny B (2006) Roe deer-vehicle collisions in Slovenia: situation, mitigation strategy and
countermeasures. Veterinarski Arhiv 76: 177–187. http://www.vef.unizg.hr/vetarhiv/pa-pers/2006-76-7-21.pdf
Putman RJ (1997) Deer and road traic accidents: options for management. Journal of Envi-ronmental Management 51: 43-57. doi: 10.1006/jema.1997.0135
Ranta E, Rita H, Kouki J (1999) Biometria. Tilastotiedettä ekologeille. Helsinki University Press, Helsinki, 1–596.
R Development Core Team (2015) R: A Language and Environment for Statistical Comput-ing. R Foundation for Statistical Computing, Vienna, Austria. http://R-project.org/ Rea RV, Johnson CJ, Emmons S (2014) Characterizing moose vehicle collision hotspots in
northern British Columbia. Journal of Fish and Wildlife Management 5: 46–58. doi: 10.3996/062013-JFWM-042
Rolandsen CM, Solberg EJ, Herindal I, Van Moorter B, Sæther B-E (2011) Large-scale spati-otemporal variation in road mortality of moose: Is it all about population density? Ecosp-ehere 2: 113. doi: 10.1890/ES11-00169.1
Romin LA, Bissonette JA (1998) Deer-vehicle collisions: status of state monitoring activities and mitigation eforts. Wildlife Society Bulletin 24: 276–283. http://www.jstor.org/stab-le/3783118
Saari A (2011) Metsäkauriiden (Capreolus capreolus) ja valkohäntäkauriiden (Odocoileus
virgi-nianus) elinpiirin koko ja liikkeet Suomessa. [In Finnish] [English summary: Home range
size and movements of roe deer (Capreolus capreolus) and white-tailed deer (Odocoileus
virginianus) in Finland]. Master’s thesis. University of Eastern Finland, Joensuu.
Seiler A (2004) Trends and spatial patterns in ungulate-vehicle collisions in Sweden. Wildlife Biology 10: 301–313. http://www.wildlifeandtraic.se/en/Reports_iles/Seiler2004.pdf Seiler A (2005) Predicting locations of moose-vehicle collisions in Sweden. Journal of Applied
Ecology 42: 371–382. doi: 10.1111/j.1365-2664.2005.01013.x
Seiler A, Helldin J-O (2006) Mortality in wildlife due to transportation. In: Davenport J, Dav-enport JL (Eds) he ecology of transportation: managing mobility for the environment. Springer, Netherlands, 165–189.
Seiler A, Helldin J-O, Seiler C (2004) Road mortality in Swedish mammals: results of a driv-ers’ questionnaire. Wildlife Biology 10: 225–233. http://www.wildlifeandtraic.se/en/Re-ports_iles/Seiler,Helldin%26Seiler2004.pdf
Singh NJ, Börger L, Dettki H, Bunnefeld N, Ericsson G (2012) From migration to nomad-ism: movement variability in a northern ungulate across its latitudinal range. Ecological Applications 22: 2007–2020. doi: 10.1890/12-0245.1
Statistics Finland (2014) http://pxweb2.stat.i/Database/StatFin/vrm/vaerak/vaerak_i.asp Steiner W, Leisch F, Hackländer K (2014) A review on the temporal pattern of deer-vehicle
Supplementary material 1
Annual trends in population size and collisions
Authors: Milla Niemi, Juho Matala, Markus Melin, Visa Eronen, Hannu Järvenpää Data type: species data
Explanation note: Annual trends in population size, harvest, and collisions.
Copyright notice: his dataset is made available under the Open Database License
(http://opendatacommons.org/licenses/odbl/1.0/). he Open Database License
(ODbL) is a license agreement intended to allow users to freely share, modify, and use this Dataset while maintaining this same freedom for others, provided that the original source and author(s) are credited.
Supplementary material 2
Contingency tables used in the analysis of collision and traic mortality rates Authors: Milla Niemi, Juho Matala, Markus Melin, Visa Eronen, Hannu Järvenpää Data type: species data
Explanation note: Contingency tables.
Copyright notice: his dataset is made available under the Open Database License
(http://opendatacommons.org/licenses/odbl/1.0/). he Open Database License