Sub1 and Maf1, Two Effectors of RNA
Polymerase III, Are Involved in the Yeast
Quiescence Cycle
Joe¨l Acker1,2,3*, Ngoc-Thuy-Trinh Nguyen1,2,3, Marie Vandamme1,2,3, Arounie Tavenet1,2,3¤a, Audrey Briand-Suleau1,2,3¤b, Christine Conesa1,2,3*
1.iBiTec-S CEA, FRE3377, Gif-sur-Yvette, France,2.CNRS, FRE3377, Gif-sur-Yvette, France,3.Universite´ Paris-Sud, FRE3377, Gif-sur-Yvette, France
*[email protected] (CC);[email protected] (JA) ¤a Current address: ANR, Paris, France.
¤b Current address: Hoˆpital Cochin, Service de Biochimie et Ge´ne´tique Mole´culaire, Paris, France.
Abstract
Sub1 and Maf1 exert an opposite effect on RNA polymerase III transcription interfering with different steps of the transcription cycle. In this study, we present evidence that Sub1 and Maf1 also exhibit an opposite role on yeast chronological life span. First, cells lacking Sub1 need more time than wild type to exit from resting and this lag in re-proliferation is correlated with a delay in transcriptional
reactivation. Second, our data show that the capacity of the cells to properly establish a quiescent state is impaired in the absence of Sub1 resulting in a premature death that is dependent on the Ras/PKA and Tor1/Sch9 signalling pathways. On the other hand, we show that maf1D cells are long-lived mutant suggesting a connection between Pol III transcription and yeast longevity.
Introduction
In its natural environment, the budding yeast Saccharomyces cerevisiae spends most of its life in a quiescent state where it can maintain both viability and the capacity to re-enter the proliferation cycle upon the addition of a carbon source. The length of time a non-dividing population of cells maintains viability defines its chronological life span (CLS). For years now, yeast CLS provides a fruitful model for aging research and many progress have been made to understand the mechanisms regulating the cell quiescence cycle, including the entry into
quiescence, the maintenance of viability and the capacity to re-proliferate. A number of dramatic morphological, physiological and biochemical changes [1,2] OPEN ACCESS
Citation:Acker J, Nguyen N-T-T, Vandamme M, Tavenet A, Briand-Suleau A, et al. (2014) Sub1 and Maf1, Two Effectors of RNA Polymerase III, Are Involved in the Yeast Quiescence Cycle. PLoS ONE 9(12): e114587. doi:10.1371/journal.pone. 0114587
Editor:Janet Quinn, Newcastle University, United Kingdom
Received:August 27, 2014
Accepted:November 11, 2014
Published:December 22, 2014
Copyright:ß2014 Acker et al. This is an open-access article distributed under the terms of the
Creative Commons Attribution License, which permits unrestricted use, distribution, and repro-duction in any medium, provided the original author and source are credited.
Data Availability:The authors confirm that all data underlying the findings are fully available without restriction. All relevant data are within the paper and its Supporting Information files.
Funding:This work was supported by the French National Research Agency (grant 2010-BLAN-1605-01) and the International PhD Program of the CEA to AT and NTTN. The funders had no role in study design, data collection and analysis, decision to publish, or preparation of the manuscript.
allows the cells to properly establish a resting state. A massive reprogramming of gene expression occurs with a down regulation of most of the genes transcribed by all three RNA polymerases. These changes are under the control of the Ras/PKA and Tor1/Sch9 signalling pathways that integrate nutrient availability to regulate cell proliferation. To repress transcription by RNA polymerase (Pol) III, these pathways converge to Maf1 [3,4]. Upon starvation, Maf1 is dephosphorylated and accumulates in the nucleus where it interacts directly with the Pol III transcription machinery, leading to transcriptional repression [5].
In contrast to Maf1 whose function is essentially to integrate responses from signalling pathways to regulate Pol III transcription, Sub1 and its human ortholog PC4 are involved in distinct DNA-dependent processes including replication, DNA repair and transcription [6]. Sub1 has multiple roles in different steps of the Pol II [7,8] and Pol III transcription cycle. In vitro, Sub1 stimulates both Pol III transcription initiation and reinitiation [9]. In vivo, the inactivation ofSUB1
correlates with a decrease in Pol III transcription efficiency without affecting the cell growth rate in exponential phase. Genome wide occupancy mapping reveals that Sub1 is present on all Pol III-transcribed genes, on the rDNA gene locus (note however that Sub1 binding to the 35S rRNA gene is controversial [9,10]) and on a subset of highly Pol II-transcribed genes. Whether or not the binding of Sub1 to Pol II-transcribed genes correlates with a role in their transcription is not known yet, with the exception of some individual genes like IMD2 [11] or HSP26[10]. Interestingly, Sub1 occupies all the genes related to the protein synthesis
machinery (ribosomal RNAs, tRNAs and ribosomal protein genes) whose transcription accounts for 80% of nuclear transcription in proliferating cells and that are strongly repressed in stationary phase.
We analysed here the possible role of Sub1 in reactivating transcription when cells are exiting stationary phase and begin to re-proliferate. To better understand the relationships between Sub1 and Maf1 that exert an opposite effect on Pol III transcription, we carried out our experiments not only in strains deprived of Sub1 or Maf1 but also in a mutant in which both genes were deleted. Our experiments show that the relationships between Maf1 and Sub1 are more complex than anticipated and do not correspond to classical synthetic genetic interactions. In the present study, we provide several lines of evidence that Sub1 and Maf1 are involved in different steps of the quiescence cycle and have an opposite effect on yeast chronological life span.
Materials and Methods
Yeast strains and plasmids
derivatives of Sub1 and/or Maf1 were also generated using sub1D::his3 and/or
maf1D::kanMX6deletion cassettes (Set 2). Theatg1,ras2,rim15,sch9orsod2null derivatives were generated by transformation of YPH500 or sub1D::his3strains with PCR-amplifiedkanMX4cassettes from the corresponding null strains of the Yeast Knockout Collection (Open Biosystems). The C160-13myc strains were generated using RPC160-13Myc::kanMX6 and sub1D::his3 cassettes. The Sub1-13myc strain was generated usingSUB1-13Myc::kanMX6epitope-tagging cassette. Since uracil auxotrophy affects longevity [13], the strains used for experiments performed in SC or SD4x medium were all uracil prototrophs either because of the deleting cassette or by transformation with a URA3-marked plasmid.
For the construction of a plasmid overexpressing SOD2, a 1600-bp genomic fragment encompassing the SOD2 locus was amplified by PCR from yeast genomic DNA and cloned into the URA3-marked pRS424 plasmid yielding pRS424-SOD2. A<3-fold increase in Sod2 protein levels was measured by western
blot analysis in cells transformed with pRS424-SOD2 plasmid.
Growth conditions
Media and techniques are described in Sherman (1991) [14]. Nutrient-rich yeast extract/peptone/dextrose medium (YPD) was supplemented with adenine for most of the experiments to prevent the strong red colour (due to the ade2-101
mutation of our background strain) of cultures grown to stationary phase that may interfere with some experiments such as microarray hybridization. Synthetic complete (SC) glucose containing medium was supplemented with adenine and all amino acids for which the strains were auxotrophic at a concentration (1 x) routinely described in the literature [14]. Synthetic dextrose was supplemented 4-fold (SD4x) with adenine and the amino acids for which the strains were auxotrophic. No uracil was added in SC or SD4x medium since all strains were uracil prototrophs. Only freshly prepared liquid medium was used since we observed that the survival of sub1D or sub1Dmaf1D strains was reduced in SC medium older than one week. Starter cultures were used to inoculate appropriate volumes of fresh medium to an optical density (OD600) of 0.1. When OD60050.8–
1 is reached, the time point is designated as day0 or exponential phase. Starter cultures were inoculated only from fresh plates since we observed that when cultures were inoculated from plates that had been left at room temperature or at 4
˚
C for a few days, thesub1Dmaf1D strain did not systematically regrow. After 24 h, the titers of cultures reproducibly differed from strain to strain, the maf1Dstrain and strains lacking Sub1 reaching a higher or lower OD600than wild type,
respectively.
Chronological life span
5 min at room temperature, images were taken randomly using a Leica DMRXA microscope and the ratio of viable to inviable cells was determined by counting black or white cells. For quantitative plating experiments, 10 ml of cultures were centrifugated at day2 and cells were resuspended into the same volume of water to avoid regrowth of viable cells. Samples of cultures were serially diluted in YPD then spread onto YPD plates. For spotting assays, 10-fold serial dilutions were made in YPD and 4 ml was spotted onto YPD plates.
Flow cytometry
Flow cytometry measurements of DNA content were performed as described [15]. Briefly, 2 OD600of cells taken at each time point were pelleted by centrifugation,
washed with water and resuspended in 70% ethanol. After one night at 4
˚
C, the pellets were washed with water, treated with 2 mg/ml of RNase A (Sigma) for 2 h at 37˚
C, then with 5 mg/ml of pepsin (Sigma) for 20 min at 37˚
C. The pellets were resuspended in 500 ml of 50 mM Tris-HCl pH 7.5, and 50ml of cells were stained by adding 500 ml of 50 mM Tris-HCl pH 7.5 containing 1 mM SytoxGreen (Invitrogen). For DHE staining, 2 OD600of cells were pelleted by centrifugation,resuspended in 100 ml phosphate-buffered saline (PBS) containing 50 mM dihydroethidium (DHE, Molecular Probes) and incubated at 30
˚
C for 10 min. Cells were then pelleted, washed with PBS and resuspended in 1 ml PBS. After a brief sonication, flow cytometry was carried out on a FACSCalibur model flow cytometer (BD Biosciences) and data were processed using CellQuest software (BD Biosciences). A total of 25,000 cells were analysed for each curve. The percentage of cells in each phase was determined using the ModFit LT 4.0 cell-cycle modelling software (Verity). For DHE staining, the y axis shows the number of cells measured at a given point on the x axis which is a logarithmic scale of arbitrary fluorescence units.RNA analyses
For RNA analyses, total RNA was isolated by using the hot phenol acid extraction protocol as described [9]. tRNAIleuand tRNALeu genes were chosen for Northern and RT-qPCR experiments since they have been previously used in works studying Pol III transcription in the absence of Maf1 or Sub1 [9,12].
Metabolic labeling
Day4 stationary phase cells grown in SD4x medium supplemented with appropriate components were used to inoculate appropriate volumes of fresh medium to OD60050.5. At each time point, total RNAs were labelled for 10 min
by adding 150 mCi of (5,6 3H)-uracil (1 mCi/ml) to 10 ml of cell cultures as described previously [9]. Three mg of total RNA were analysed by gel
independent in vivo labelling experiments were performed and found to give reproducible results.
Northern blot
Twentymg of total RNA per lane was loaded onto a denaturing gel. After blotting, the membranes were hybridized with the appropriate 32P-labeled probes. The oligonucleotide probes were 59
-TGCTCGAGGTGGGGATTGAACCCACGACGGTC for Pre-tRNAIleuand tRNAIleu and 59-GATTGCAGCACCTGAGTTTCG for 5S rRNA.
RT-qPCR
First-strand cDNA for each sample was synthesized by reverse transcription (RT)
of 3 mg of total RNA, using SuperScript II reverse transcriptase (Invitrogen) and
random primers (Invitrogen) according to the manufacturer’s instructions. There is a large excess of the mature as compared to the pre-tRNAs in total RNA preparations. We thus analysed by PCR the products obtained after RT reactions using primers designed to amplify both mature and intron-containing forms of tRNAs. Only the larger DNA fragment corresponding to the intron-containing form was observed for the tRNAIleu, tRNALeu or tRNAProamplifications
suggesting that the reverse transcriptase enzyme was not able to synthetize cDNA from the mature form of tRNAs, probably because of the numerous modifications occurring on tRNAs or their highly stable tri-dimensional structures that might resist heat denaturation. Thus, only pre-tRNAs are represented after RT reactions. Real-time PCR was performed using an ABI Prism 7300 machine (Applied Biosystems). The PCR reactions were carried out in 20 ml containing 0.4 mM each primer and 10 ml of mastermix SYBR green PCR reaction (Applied Biosystems). All sets of reactions were conducted in triplicate or more on at least two
independent preparations of cDNA.
The primers were 59-GCGCCGTGGCGCAGTGGAAGCGCG and 59 -GCGCCGCTCGGTTTCGATCCGAGGAC for Pre-tRNAiMet, 59
-GGTTGTTTGGCCGAGCG and 59-TATTCCCACAGTTAACTGCGGTCA for Pre-tRNALeu, 59-GCTCGTGTAGCTCAGTG and 59-TCGTTTTAAAGGCCTGT for Pre-tRNAIleu, 59-GTTGCGGCCATATCTACCAGA and 59
-TCGCGTATGGTCACCCACTAC for 5S rRNA, 59
-TCACGGAATGGTACGTTTGA and 59-GCGAAGGATTTGGTGGATT for 35S rRNA, 5’-GTTGGTCCAGATTTGGCTGT and 59-ACGAACGTCATCTTCCTTGG for RPS6A, 59-CATGTTCCCAGGTATTGCCGA and 59
-GTCAAAGAAGCCAAGATAGAA for ACT1, 59-CCAAGAGCCTACCAAGACCG and 59-CGCAAAATCGACTAAACCTGG for IMD2, 59
-TCGGTATCGTTGTTCCAAGA and 59-CGAATTCACCCAACAAAGTG forSSB1, 59-AAGTCGTGGTTCCTGGTGTC and 59-TGTCAAAACACCATTTGCGT for
Microarray hybridization
Hybridizations on Pol III-specific microarrays were performed and quantified as described [12]. Briefly, total RNA (20mg) supplemented with control RNAs used for normalization (CAB, RCA, and RbCl from Stratagene) was reverse-transcribed using a mixture of Pol III-specific primers and poly(dT) oligonucleotide. As described above, only neo-synthetized tRNAs levels were analysed using microarrays since mature tRNAs could not be reverse-transcribed under our conditions.
Protein analyses
Protein analyses were performed essentially as described [5]. Proteins extracted using trichloroacetic acid and acid-washed glass beads were analyzed by SDS-PAGE and Western blotting. Analysis of Maf1 levels by immunoblotting was performed using a modified acrylamide:bisacrylamide ratio (33.5:0.3) SDS-PAGE. For co-immunoprecipitation experiments, protein extracts were incubated with magnetic beads coated with anti-myc antibodies. The beads were washed, and the bound polypeptides were eluted and analyzed by SDS-PAGE, followed by immunoblotting using anti-myc or anti-Maf1 antibodies. Quantification was performed using Quantity One software (Bio-Rad).
Fluorescence microscopy
Sub1-13myc cells grown to exponential or stationary phase (day5) in YPD were fixed for 30 min in formaldehyde (3.7%). 9E10 anti-myc antibodies or polyclonal antibodies directed against the A190 subunit of Pol I or Maf1 were used to detect Sub1, Pol I or Maf1, respectively. The secondary antibodies were either Alexa fluor 594 (red) or 488 (green) antibodies (Invitrogen). Cells were counterstained with DAPI (49,69-diamidino-2-phenylindole). All observations were made with a Leica DMRXA microscope equipped with a Roper Scientific MicroMax cooled charge-coupled device camera and MetaMorph software (Molecular Devices).
Results
Sub1 is important for survival and optimal re-proliferation of
quiescent cells
During the course of our experiments on the regulation of Pol III transcription, we reproducibly observed that cells deprived of Sub1 needed more time than wild type to regrow when inoculated into fresh liquid medium. These growth defects were exacerbated in a double sub1Dmaf1D mutant which prompted us to study more closely the role of Sub1 and Maf1 in the quiescent cycle.
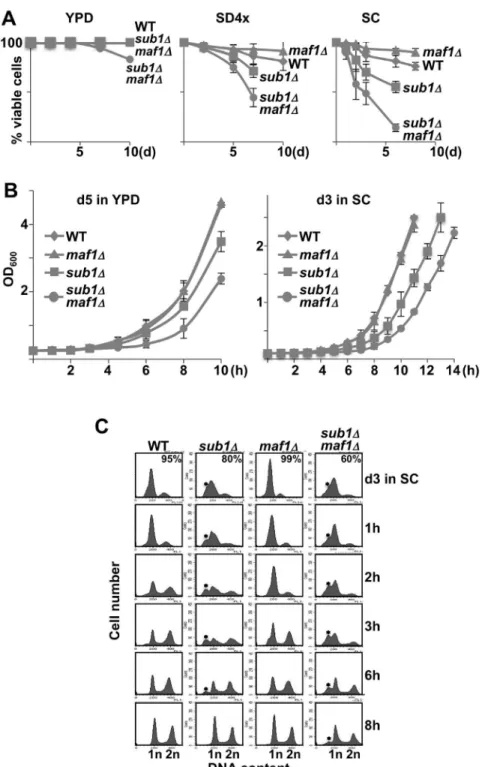
components (SD4x). A differential cell viability loss was indeed observed depending on the medium (Fig. 1A). In YPD, no cell viability loss could be observed except for the sub1Dmaf1D strain at day10. In both SD4x and SC, cells deprived of Sub1 were defective in maintaining viability under non-growth conditions i.e displayed a shortened chronological life span (CLS). In contrast,
maf1D cells displayed an extended CLS as compared to the wild type strain. This opposite role of Sub1 and Maf1 on the CLS is explored below.
To assess whether Sub1 and Maf1 could play a role in the re-proliferation of quiescent cells, we monitored growth curves starting from the same number of viable cells as measured by trypan blue staining. Resting cells at day5 in YPD (no mortality, see Fig. 1A) or day3 in SC (<25% and <50% mortality for sub1D or
sub1Dmaf1D cells, respectively) were inoculated into fresh media and the OD600
was monitored over time as a measure of growth. All the strains were able to re-enter the proliferation state (Fig. 1B). However, a reproducible delay was observed in both media in cells lacking Sub1 suggesting that these cells needed more time to exit from resting state. Once in exponential phase, the doubling time of wild type and mutant strains were indistinguishable. A similar delay in resting exit was also observed by monitoring growth curves in SD4x, with our second set of mutant strains generated in YPH500 background with different deleting cassettes and with a sub1D strain generated in BY4741 background (S1 Fig.) indicating that this phenotype was not a yeast background dependent effect.
In order to use another approach, DNA content was analysed by flow cytometry in resting cells and after their release into fresh SC medium. The percentage of cells in each phase is shown in S2 Fig. The presence of dead cells insub1D or
sub1Dmaf1Dcultures at day3 in SC was correlated to the presence of sub-G1 peaks (Fig. 1C, star) corresponding to apoptotic DNA degradation [16]. Cell cycle progression from resting to mitotic cycling as visualized by the relative proportion of 1n or 2n DNA peaks was much slower in sub1D and sub1Dmaf1D cells as compared to wild type. Interestingly, a<1 h delay in restarting proliferation,
probably not long enough to be observed by monitoring growth curves (Fig. 1B) could be visualized in maf1D cells (Fig. 1Cand S2 Fig., lanes 2h). Note also that
maf1Dcells arrested more efficiently with a G1 content of DNA than wild type cells (Fig. 1Cand S2 Fig., lanes d3). Whether this more efficient G1 arrest of
maf1Dcells could be correlated to their <1 h delay in restarting proliferation
needs to be further investigated. Our data showed that cells deprived of Sub1 were delayed in exiting quiescence in all experimental conditions we assayed and that this phenotype was not dependent on viability loss. The defects of sub1D cells in resting exit were exacerbated in the absence of Maf1 suggesting synthetic sick genetic interactions between SUB1 and MAF1 genes. An additive effect of Sub1 viable cells in the resting cultures is indicated. The star indicates the position of sub-G1 peaks corresponding to apoptotic DNA degradation. The percentage of cells in each phase was determined using the cell cycle modelling software ModFit LT 4.0 and is shown inS2 Fig.
and Maf1 deletions may explain the longer delay in quiescence exit observed for the sub1Dmaf1D double mutant.
Sub1 is involved in the reactivation of transcription upon exit from
resting
Since its deletion correlates with a delay in exiting quiescence (Fig. 1), we wondered whether Sub1 could play a role in the rapid reactivation of transcription occurring upon exit from resting. To prevent any misinterpretation of these transcription studies due to the presence of dead cells in quiescent cultures, we performed all our experiments in YPD or SD4x at days where no significant cell viability loss could be observed. The level of Pol III transcription was first analysed in wild type andsub1Dstrains using a Pol III-specific microarray [12]. First-strand cDNAs were synthesized by reverse transcription of total RNA isolated from resting cells in YPD and 1 h or 6 h after their inoculation into fresh medium. As described in Materials and Methods, only pre-tRNAs species could be reverse-transcribed under our experimental conditions. The gene array shown on Fig. 2A
displays thesub1D/WT normalized ratio of each probe according to the red-green colour-scale. A slight decrease in the global amounts of neo-synthetized tRNAs could be observed at 1 h post-inoculation (mean of all ratios of 0.74). After 6 h, the transcriptional profiles of both strains were indistinguishable (mean of all ratios of 1.04). However as already observed for Maf1 regulation of tRNA gene expression using similar microarrays [12], not all genes were regulated to a similar extent. More than half of the genes were less induced in sub1D cells at 1 h post-inoculation (lane 1h, green) showing that Sub1 was necessary to reactivate transcription of these genes at an early stage of the exit from resting. The most delayed gene wasIMT4encoding tRNAiMet(7 fold lower). This gene, as well as the one encoding tRNAIleu(2.5 fold lower) or tRNALeu(3 fold lower) were chosen for further analysis by Northern (Fig. 2B) or quantitative PCR (qRT–PCR) (Fig. 2C). Both experiments confirmed that in the absence of Sub1, the reactivation of Pol III transcription was delayed and/or lower than in wild type. In contrast, Maf1 deletion could lead as expected to a Pol III transcription reactivation occurring faster and to a greater extent than in wild type. Strikingly, the deletion of Maf1 in
sub1D cells resulted in a more complex pattern of reactivation, revealing both transcriptional delay and/or higher transcriptional levels.
To obtain a global view of the reactivation of Pol III transcription, we next performed RNA metabolic labelling experiments that also allowed the visualiza-tion of Pol I transcripvisualiza-tion. Newly synthetized RNAs were monitored over time after the release of resting cells into fresh SD4x medium containing 3H-uracil (Fig. 3A). Although transcription is reduced but not totally abolished in
sub1D and maf1D cells as compared to wild type. At 6–8 h post inoculation, as also observed at an early stage in the growth cycle for Pol I transcription [18], Pol III transcription decreased in these three strains. In sharp contrast, the appearance of neo-synthetized Pol III transcripts was strongly delayed in the sub1Dmaf1D
strain, with optimal levels of labelled signals reached only after 6–8 h post-inoculation, in good correlation with a longer delay in exiting quiescence (Fig. 1).
According to our previous genome-wide occupancy analysis [9], we wondered whether Sub1 could also play a role in the reactivation of Pol I and Pol II transcription. Metabolic labelling and RT-qPCR (Fig. 3) showed that the
reactivation of Pol I transcription occurred similarly in all strains but to a lesser extent for the mutant strains as compared to wild type within the first two hours Fig. 2. Sub1 is required for an optimal reactivation of Pol III transcription when cells are exiting quiescence.(A) Microarray hybridization. Expression ratios of a subset of Pol III-transcribed genes in the
sub1Dmutant and the wild type strain grown in YPD, at day10 stationary phase (S) and after 1 or 6 h post-inoculation into fresh medium are shown. Results for the indicated genes are presented according to the red-green color scale. (B) Northern blot analysis. Total RNA isolated from the indicated strains grown in YPD, at day5 (S) or after 1 to 8 h post-inoculation into fresh medium was hybridized with probes designed to reveal both pre-tRNAIleuand tRNAIleu, or 5S rRNA. (C) Real-time PCR analysis. The expression of tDNAiMet, tDNALeu or tDNAIleugenes in the indicated strains grown in YPD at day5 (S) or after 1 to 3 h post-inoculation into fresh medium was determined by real-time PCR. Relative gene expression levels were calculated using 5S rRNA as an internal control since its levels did not significantly change over time in all strains. Standard deviations were calculated from two independent preparations of cDNA.
post inoculation. The appearance of the small 5.8S rRNA was delayed similarly to the 5S rRNA in thesub1Dmaf1Dstrain, probably due to the co-regulation of these two rRNAs [19]. Analysis of three Pol II-transcribed genomic targets of Sub1 [9,11,20] suggested that it may also interfere with the reactivation ofACT1 and
IMD2genes but not that ofRPS6A. RT-qPCR further showed that the deletion of Fig. 3. Reactivation of transcription upon exit from quiescence.(A) Day4 cultures of the indicated strains grown in SD4x were re-inoculated into fresh medium. RNA synthesis by Pol III (5S rRNA, tRNAs) or Pol I (25S, 18S, 5.8S rRNAs) was monitored over time by metabolic labelling with3H-uracil (3H). For 25S and 18S rRNAs, a shorter exposure (SE) is shown. Total RNA loaded was visualized by staining with ethidium bromide (EtBr). (B) The expression of the 35S rRNA gene and ofRPS6A,ACT1orIMD2genes, three of Sub1 genomic targets, in the indicated strains grown in YPD, at day5 (S) and after 1 to 6 h post-inoculation into fresh media was determined by real-time PCR. Expression levels were normalized to those of the 5S rRNA gene. Standard deviations were calculated from two independent preparations of cDNA. As expected from the repressive role of Sub1 onIMD2gene expression, a higher expression level ofIMD2gene was detected in the absence of Sub1.
Maf1 resulted in a slightly delayed reactivation ofACT1 (Fig. 3B). A strong delay for all three genes was observed in the sub1Dmaf1D cells with no reactivation at 2 h post-inoculation and optimal levels hardly reached at 6 h. These data indicate that both Sub1 and Maf1 may influence transcriptional reactivation and further investigation will be required to determine their role in this process.
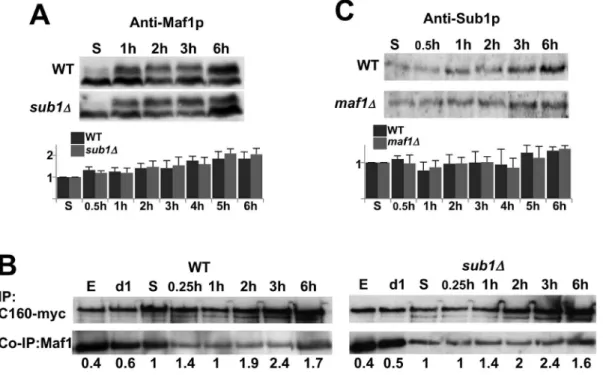
From all these experiments, we concluded that Sub1 plays a role in reactivating Pol III transcription at an early stage of the exit from resting. We figured out that the delay observed in the absence of Sub1 could be explained by an up-regulation of Maf1 repressing activity that could be due to the presence of higher amounts of dephosphorylated Maf1 or of repressing Maf1-Pol III complexes, or to a delay in Maf1 re-phosphorylation. However, no significant difference in the amounts or in the phosphorylation state of Maf1 could be detected between wild type andsub1D cells (Fig. 4A). Furthermore, a time course analysis of Maf1 interaction with Pol III by co-immunoprecipitation did not reveal either a stronger binding of Maf1 to Pol III in the absence of Sub1 (Fig. 4B). On the other hand, Pol III transcription could be reactivated sooner in the absence of Maf1 than in wild type cells but this effect was also not due to a difference in the amounts of Sub1 upon exit from quiescence (Fig. 4C). A slight increase of 1.7 fold in the levels of Sub1 protein was observed in both strains, in good correlation with the quite modest (2.5 fold) induction of SUB1mRNA upon these conditions [21].
Sub1 and Maf1 play an opposite role on CLS
Our trypan blue exclusion experiments (Fig. 1A) suggested that Sub1 and Maf1 could play an opposite role on CLS. To further explore these observations, we first assessed cell viability by spotting samples of quiescent cultures at different time. Since strain genotypes and medium composition could influence the survival of starving yeast (see for example refs [13,22]), experiments were performed with resting cells in YPD, SD4x or SC medium, with two sets of null derivatives of Maf1 and Sub1 generated in YPH500 background using different deleting cassettes and with a sub1D mutant generated in BY4741 background. In all cases (Fig. 5A and 5C), cells deprived of Sub1 were defective in maintaining viability under non-growth conditions, i.e displayed a shortened CLS. To precisely assess the CLS of the strains, the proportion of living cells was measured over time by counting the number of colonies formed per unit volume of culture (Fig. 5B). Life span curves showed that the survival of sub1D or sub1Dmaf1D cells in SC medium was strongly reduced. In SD4x or YPD, all strains exhibited longer CLS but cells lacking Sub1 also lost viability prior to the wild type strain. In all media, maf1D
cells displayed an extended CLS as compared to the wild type strain. These experiments showed that Sub1 and Maf1 play opposite roles on CLS.
In the absence of Sub1, cells properly exit from exponential phase
premature death from day2 (Figs. 1Aand5) and a flow cytometry profile at day3 not similar to wild type (Fig. 1C, lane 0h). We thus wondered whether the transition from exponential phase to quiescence occurred properly in cells deprived of Sub1. This transition is characterized by a number of physiological and biochemical changes [1,2]. We investigated several of these traits to determine whether they were defective in the absence of Sub1.
First, a drastic decrease of transcription by all three RNA polymerases occurred in all strains during the transition from exponential phase to day1 (Fig. 6A) except for Pol III transcription repression that was delayed in cells deprived of Maf1 as described previously [23]. Analysis of Pol II-driven transcription showed thatsub1Dcells properly repressedSSB1and inducedHSP26gene expression upon entry into resting as expected. Surprisingly,HSP26was not induced in the absence of Maf1.
Cells lacking Sub1 grown to exponential phase were sensitive to thermal or oxidative challenges but their resistance increased as expected at day1 (Fig. 6B). Flow cytometry was used to determine the proportion of cells arrested with a G1 DNA content from day1 to day4 in SC medium (Fig. 6C and S2 Fig.). The Fig. 4. The difference in reactivating Pol III transcription is not due to an excess of Sub1 or Maf1.The amounts of Maf1 (A) or Sub1 (C) in the indicated strains grown in YPD at day5 or after 1 to 6 h post-inoculation into fresh media were analyzed by SDS-PAGE followed by immunoblotting using polyclonal antibodies as indicated. The signals obtained with anti-Maf1 antibodies correspond to hypo- (fast-migrating) or hyper- (slow migrating) phosphorylated forms of Maf1. The quantifications of Maf1 or Sub1 protein levels were normalized to a control protein band stained by Ponceau Red. Standard deviations were calculated from at least 3 independent experiments. (B) Cells expressing myc-tagged C160, the largest subunit of Pol III, in the presence (WT) or the absence of Sub1 (sub1D)were grown in YPD and collected either in exponential phase (E), at day1 (d1) and day5 (S) stationary phase or after 0.25 h to 6 h post-inoculation into fresh medium. Protein extracts were incubated with magnetic beads coated with anti-myc. The bound polypeptides were eluted and analyzed by SDS-PAGE followed by immunoblotting using anti-myc or polyclonal antibodies directed to Maf1. The quantified ratios of co-immunopurified Maf1/immunopurified C160-myc are indicated below each lane.
decreased height and narrowness of the 1n DNA peak observed in bothsub1Dand
sub1Dmaf1Dcells suggested that those cells displayed a less efficient G1 arrest than wild type. These cells rapidly suffered apoptotic DNA degradation as visualized by the appearance of sub-G1 DNA peaks correlated to an increase in the percentage of trypan blue stained cells. Strikingly, we noted that maf1D cells arrested more efficiently with a G1 content of DNA and displayed less rapid DNA degradation than wild type (Figs. 1C, 6Cand S2 Fig.) in agreement with similar phenotypes observed for other long-lived mutants [24].
Fig. 5. The decreased survival of quiescent cells deprived of Sub1 does not depend on strain genotypes or medium composition.(A) Two sets of the indicated strains generated in YPH500 with
sub1D::kanMX6andmaf1D::ura3deletion cassettes (Set 1) or withsub1D::his3andmaf1D::kanMX6deletion cassettes (Set 2) were grown to stationary phase in YPD, SC or SD4x medium. Samples of cultures were spotted onto YPD plates at the indicated day (d1–d10 for SC or SD4x; d5–d25 for YPD) and the relative growth of the strains was observed after 4 days of incubation at 30˚C. (B) Viability was determined over time by counting the number of colony forming units (Cfu) per volume of culture. Life-span curves represent means and standard deviations from at least two independent experiments. Note that life span curves obtained with the second set of strains in SC medium are similar to those in SD4x medium for the first set shown here. (C) Viability of the indicated strains grown in SC medium was determined over time by trypan blue exclusion assays. Viability curves represent means and standard deviations from three independent experiments.
From these experiments we concluded that the transition from exponential phase to day1 occurred properly in cells deprived of Sub1. However, very rapidly these cells began to die suggesting that SUB1 gene was necessary to maintain cell viability at a very early stage of the non-proliferative state.
Loss of Sub1 results in an increased accumulation of reactive
oxygen species
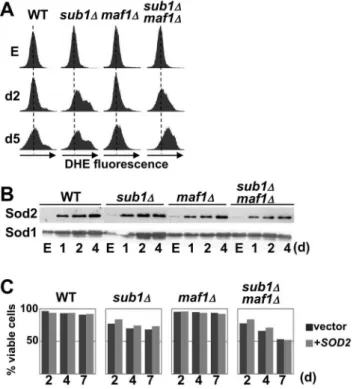
Many pathways encompassing a wide variety of functions have been shown to affect CLS in yeast [25] including the production of reactive oxygen species (ROS) by mitochondrial respiration that could be responsible for cellular damages and death. Two superoxide dismutases, Sod1 and Sod2 are critical enzymes for the detoxification of ROS. Interestingly, genetic interactions have been found between Sod1 and Sub1 [26,27]. We thus explored the hypothesis that the shortened CLS observed in cells deprived of Sub1 could be linked to an increased accumulation of ROS. The intracellular ROS levels were measured by flow cytometry using the ROS-sensitive probe dihydroethidium (DHE). We found that ROS abundance in wild type and mutant cells was identical in exponential phase but diverged at day2 withsub1D andsub1Dmaf1Dstrains exhibiting significantly more ROS than wild-type andmaf1D(Fig. 7A). Next, we analysed the steady-state abundance of Sod1 and Sod2 by Western blot and did not find any significant differences in the induction of these detoxification proteins in the absence of Sub1 (Fig. 7B). Furthermore, as shown in Fig. 7C, the overexpression of SOD2did not prevent the premature death of the strains deprived of Sub1. A higher accumulation of ROS in cells deprived of Sub1 could thus not be correlated to a defective induction of Sod2.
Ras/PKA and Tor1/Sch9 pro-aging signalling networks are
involved in Sub1 effect on cell viability
The nutrient-sensing pathways controlled by Tor1/Sch9 and Ras/PKA regulate both Pol III transcription through Maf1 and quiescence through the Rim15 protein kinase [1–4,28]. We thus wondered whether they could regulate cell survival and Pol III transcription through Sub1. The activity of most of the Fig. 6. In the absence of Sub1, cells properly exit from exponential phase.(A) The expression of Pol I-(35S rRNA), Pol II- (RPS6A,IMD2, SSB1, HSP26) or Pol III- (Pre-tRNALeu, pre-tRNAiMet) transcribed genes in the indicated strains grown in SC medium to exponential phase (E) or at day1 was determined by real-time PCR. Expression levels were normalized to those of the 5S rRNA gene and expression levels in the wild type strain grown to exponential phase was set to 100. Means and standard deviations from two independent preparations of cDNA are shown. (B) Samples of the indicated strains grown in SC medium to exponential phase (E) or at day1 were incubated at 55˚C for the indicated time (in min) or in the presence of 25 mM H2O2 for 1 h and then spotted onto YPD plates and incubated at 30˚C. (C) Changes in DNA content over time in samples of the indicated strains grown in SC medium to exponential phase (E) or at day1 to 4 were determined by flow cytometry. The percentage of viable cells determined by trypan blue staining at each time point is indicated. The percentage of cells in each phase was determined using the cell cycle modelling software ModFit LT 4.0 and is shown inS2 Fig.
transcription factors including Rim15 and Maf1 that are downstream targets of these pathways is modulated by phosphorylation and cellular location [2]. Sub1 being a phosphoprotein [29,30], we first analysed its intracellular localization by immunofluorescence in cells grown to exponential or stationary phase, using Maf1 as a control. In exponentially growing cells (Fig. 8A), the fluorescence signals corresponding to Sub1 were uniformly distributed throughout the nucleoplasm (visualized by DAPI staining) but also the nucleolus (visualized by Pol I signals). The nuclear locations of Sub1 were unchanged in stationary phase (Fig. 8B) suggesting that, in contrast to Maf1, Sub1 did not shuttle between the cytoplasm and the nucleus in response to growth conditions.
Next, we examined the relationships between Sub1 and components of these pathways by analysing several traits of quiescence in strains generated from combinations ofsub1D withsch9D,ras2Dor with null derivatives of downstream effectors of these two pathways controlling the quiescence program (rim15D), autophagy (atg1D) and detoxification of ROS (sod2D). Spotting assays of quiescent cells (Fig. 9A), flow cytometry analysis (Fig. 9B) and DHE fluorescence profiles (Fig. 9C) showed that the inactivation of the Ras/PKA pathway suppresses Fig. 7. Loss of Sub1 results in an increased accumulation of reactive oxygen species.(A) Reactive oxygen species (ROS) levels in the indicated strains (Set 2) grown to exponential phase (E) or at day2 and day5 were measured using the ROS-sensitive fluorescent dye dihydroethidium (DHE) and flow cytometry. The appearance of DHE fluorescence signals on the right of the x axis is correlated to increasing ROS levels. (B) The levels of Sod2 and Sod1 in the indicated strains (Set 2) grown to exponential phase (E) and at day1, 2 or 4 were determined by Western blot analysis. (C) Viability in SC medium of the indicated strains (Set 2) transformed by aURA3-marked plasmid overexpressingSOD2gene was determined over time using trypan blue staining.
all phenotypes detected in sub1D strain. No premature death, no defect in the establishment of the G1 cell cycle arrest, no appearance of sub-G1 DNA peaks and no accumulation of ROS could be observed in theras2Dsub1D mutant within the 9 first days of quiescence. The inactivation of the Tor1/Sch9 pathway similarly Fig. 8. Intracellular localization of Sub1.Sub1 and Pol I (A) or Sub1 and Maf1 (B) were localized by immunofluorescence in exponentially growing cells in YPD or at day5 stationary phase, as indicated. The cells were analysed by phase contrast light microscopy (visible), by DNA staining (DAPI) and by
immunofluorescence using antibodies specific to Sub1, Pol I or Maf1, as indicated. Overlays from the indicated combinations of images are shown.
relieved sub1D deleterious effects during the 4–5 days of resting. These results suggested an upstream role of the Ras/PKA and to a lesser extent of the Tor1/Sch9 pathway in the regulation of the cell survival through Sub1. Since both pathways have overlapping effects on quiescence mainly through Rim15, we wondered whether Sub1 was a downstream effector of this kinase. This did not seem to be the case since the survival of rim15Dsub1D was shortened as compared to the corresponding single mutant strains. The reduced viability of rim15Dsub1D or
sod2Dsub1D mutant was probably due to an additive effect on ROS accumulation Fig. 9. Inactivation of the Ras/PKA or Tor1/Sch9 signalling networks suppresses the effect of Sub1 deletion on quiescent cell survival.(A) Samples of the indicated strains, all uracil prototrophs, grown in SC medium to exponential phase (E) or at day5 and day9 were spotted onto YPD plates and incubated at 30˚C. The growth of single (-) null mutants was compared to that of their combination with Sub1 deletion (Set 2,+). (B) The indicated strains were grown to stationary phase in SC medium. Changes in DNA content at day1 and day4 were determined by flow cytometry. The filled grey curves represent the profiles of single null mutants, the black lines that of their combination with Sub1 deletion. (C) ROS levels in the indicated strains grown to exponential phase (E) or at day2 and day5 were measured with DHE staining and flow cytometry. The filled grey curves represent the profiles of single null mutants, the black lines that of their combination with Sub1 deletion.
(Fig. 9C). In contrast, Atg1 deletion did not significantly change the phenotypes of sub1D cells.
These data suggested that Ras/PKA and Tor1/Sch9 signalling networks are involved in Sub1 effect on cell viability.
Discussion
Successful survival of starvation requires three distinct steps: induction of the quiescent state, maintenance of viability during quiescence and re-proliferation upon restoration of optimal growth conditions. In this study, we first demonstrate that Sub1 is involved in the transcriptional reactivation at an early stage of the exit from stationary phase. Second, loss of Sub1 impairs the capacity of the cells to properly establish a quiescent state and results in a premature death that is dependent on the Ras/PKA and Tor1/Sch9 signalling pathways. On the other hand, the inactivation of Maf1 extends long-term survival revealing a connection between Pol III transcription and yeast longevity. However, the phenotypes detected insub1Dmaf1Dcells and in both single null mutant do not correspond to classical synthetic genetic interactions and reveal that the connections between Sub1 and Maf1 are more complex than anticipated.
Sub1 is required for an optimal reactivation of transcription upon
recovery from starvation
Our data identify for the first time physiological conditions where Sub1 was needed for an optimal stimulation of Pol III transcription. A<1 h delay to reach
nucleoplasmic and a nucleolar protein (Fig. 8). A possible role of Sub1 in Pol I transcription is thus still an opened question.
Both Maf1 and Sub1 regulate Pol III transcription mainly through similar mechanisms. They have been shown to exert an opposite activity on the pre-initiation complex formation and in the repre-initiation process [9,36,37] suggesting a simple counteracting effect of both effectors on Pol III transcription. However, the absence of Maf1 in sub1D cells strongly delayed the reactivation of Pol III transcription, an unexpected result that did not correlate with this basic model. Connections between Maf1 and Sub1 in regulating Pol III transcription are thus more complex than anticipated. The absence of Maf1 in sub1D cells also resulted in a reactivation of the three transcription machineries that may not occur at the same time (Figs. 2 and 3). This uncoordinated reactivation of transcription in
maf1Dsub1D cells may result in an unbalanced supply of the ribosomal
components and in a decreased capacity for protein synthesis that could explain the much longer time needed by this double mutant to re-proliferate.
Sub1 is important to properly establish the quiescent state
In the absence of Sub1, cells properly exit the exponential phase and initiate the quiescent program. Transcription was rapidly shut down, stress response genes were induced and the cell resistance to temperature and oxidative stress increased (Fig. 6). However, sub1D cells were impaired for proper G1 cell cycle arrest and they rapidly suffered apoptotic DNA degradation. The strongest phenotype in sub1Dcells entering quiescence was a rapid accumulation of ROS (Figs. 7 and9). We could wonder whether ROS accumulation in sub1D cells was due to a mitochondrial dysfunction or to a defect in ROS detoxification. No significant difference with the wild type strain could be detected in sub1D upon entry into resting either in the resistance to oxidative stress (Fig. 6) or in the induction of Sod1 or Sod2 (Fig. 7B) suggesting that at least a part of the quiescence program dedicated to the cellular protection against oxidants was properly initiated in sub1Dcells. The increased ROS production in sub1Dcells may be responsible for their premature death as proposed by the mitochondrial theory of aging. Many studies have demonstrated that high levels of ROS represent one of the major factors that limit life span [25]. The correlation between lower ROS levels and increased viability observed in ras2Dsub1D or sch9Dsub1D cells, and higher ROS levels and reduced viability in maf1Dsub1D rim15Dsub1D or sod2Dsub1D cells (Fig. 9) may support this hypothesis. However, links between ROS levels and cell viability are complex and further investigations will be required to precisely determine the contribution of ROS levels in the premature death of sub1D cells.
conditions (Fig. 8B). Sub1 did not seem either to be a downstream effector of Rim15 sincerim15Dsub1Dphenotypes were exacerbated as compared to the single null mutants (Fig. 9). Since Rim15-independent mechanisms involved in life span having already been described [39], another possibility could be that Sub1 acts in a parallel branch. We could not also rule out the fact that Sub1 may have a more global and complex role on quiescence due to its involvement in multiple cellular processes [6] including DNA damage, oxidative and replication stress that are also implicated in life span [25].
Maf1, the key Pol III repressor, is also implicated in cell longevity
The deletion of Maf1, the key Pol III repressor extends cell longevity suggesting for the first time a connection between Pol III transcription and CLS. Both Ras/ PKA and Tor1/Sch9 pathways are involved in the regulation of Pol III
transcription mainly through Maf1 that is a direct target of both PKA and Sch9 kinase [40,41]. Likemaf1D cells, ras2D and sch9D display an extended CLS [42] suggesting that part of their long-lived phenotypes could result from their role in Pol III transcription.
Different works concerning Maf1 suggest putative mechanisms that may link Pol III transcription and cell longevity. First, as previously described [23], we noted an accumulation of tRNA precursors in maf1D cells upon entry into quiescence (Fig. 6). Similar defects were also observed when cells deprived of Maf1 were shifted from glucose to glycerol medium and were found to be due to a defective nuclear export of tRNAs [43]. Interestingly, impaired tRNA export contributes to the execution of the G1 checkpoint [44] and may explain the more efficient G1 arrest detected upon entry into quiescence inmaf1Dcells as compared to wild type (Figs. 1Cand6C). On the other hand, cytoplasmic tRNAs have been shown to accumulate in the nucleus upon entry into quiescence and to return to the cytoplasm in stationary phase [45]. Whether the nucleocytoplasmic
distribution of tRNAs may play a role in CLS remains to be explored. We also wondered whether the higher levels of tRNAs in quiescentmaf1D cells may play a role in aging through the Gcn4 transcription factor controlling the general amino acid control (GAAC) pathway. Interestingly, the regulation of GAAC through Gcn4 levels was found to affect CLS [46] and the accumulation of pre-tRNAs in
Maf1 and Sub1, a connection more complex than anticipated
Trying to decipher the relationships between Sub1 and Maf1 that play an opposite role on Pol III transcription, we found that they also exert an opposite effect on CLS. Since our study indicates that Sub1, like Maf1, may be part of both Ras2/ PKA and Tor1/Sch9 signalling pathways, we could wonder whether the observed phenotypes may be attributed to a role of Maf1 and Sub1 in two parallel pathways regulating both CLS and transcription. In this basic model, one could expect that turning off both genes would have a compensatory effect and would give a somewhat ‘‘wild-type’’ phenotype. However, in all our experiments under non-standard conditions, sub1Dmaf1D cells are always sicker or more affected than each of the single null mutants that strikingly exhibit opposite phenotypes as compared to wild type. This does not correspond to classical synthetic genetic interactions but to a single non-monotonic interaction as defined by Drees et al. [47] in which a mutant gene (maf1D) shows opposite effects in the wild-type background and the other mutant (sub1D) background. The genetic-interaction inequality observed for Maf1 and Sub1 deletions could be represented bymaf1D. Wild-type . sub1D. sub1Dmaf1D (with . corresponding to greater than) and suggested than Maf1 and Sub1 act in at least two distinct functional pathways. In good accordance with this hypothesis, Sub1 is involved in several DNA-dependent processes including Pol II and Pol III transcription but is also important for cell survival upon several stress conditions. On the other hand, although the main known role of Maf1 is to repress Pol III transcription, recent studies suggest that Maf1 deletion may also affect other cellular processes [12,48]. It would be interesting to determine which function(s) of Sub1 in any of these cellular processes renders its absence so deleterious in combination with Maf1 deletion, and vice-versa.
Supporting Information
S1 Fig. The delay in exiting quiescence in the absence of Sub1 does not depend on media or strain genotype.Optical density at 600 nm was monitored over time as a measure of regrowth of resting cells re-inoculated into fresh media. Growth curves represent an average from at least two independent experiments. (A) Set1 of strains generated in YPH500 background (day4 in SD4x). (B) Set2 of strains generated in YPH500 background with different deleting cassettes (day3 in SC). (C) Strains generated in BY4741 background (day3 in SC).
doi:10.1371/journal.pone.0114587.s001 (TIF)
S2Fig. Cell cycle progression quantification. (A) Quantification upon the exit from day3 stationary phase in SC medium corresponding to the flow cytometry analysis presented in Fig. 1C. (B) Quantification upon the entry into stationary phase corresponding to the flow cytometry analysis presented in Fig. 6C. The panels show the percentage of cells in sub-G1 peaks, or in G0/G1, S and G2/M phases of the cell cycle.
Acknowledgments
We are grateful to O. Lefebvre, C. Carles and M. Riva for helpful discussions and for improving the manuscript. We thank J. Riemer (Department of Cell Biology, University of Kaiserslautern, Kaiserslautern, Germany) and V. Cizewski Culotta (Department of Biochemistry and Molecular Biology, Johns Hopkins University Bloomberg School of Public Health, Baltimore, USA) for the generous gift of antibodies against Sod1 and Sod2, respectively.
Author Contributions
Conceived and designed the experiments: JA CC. Performed the experiments: JA CC NTTN MV AT ABS. Analyzed the data: JA CC. Wrote the paper: JA CC.
References
1. De Virgilio C(2012) The essence of yeast quiescence. FEMS Microbiol Rev 36: 306–339.
2. Smets B, Ghillebert R, De Snijder P, Binda M, Swinnen E, et al.(2010) Life in the midst of scarcity: adaptations to nutrient availability in Saccharomyces cerevisiae. Curr Genet 56: 1–32.
3. Boguta M(2013) Maf1, a general negative regulator of RNA polymerase III in yeast. Biochim Biophys Acta 1829: 376–384.
4. Moir RD, Willis IM(2013) Regulation of pol III transcription by nutrient and stress signaling pathways. Biochim Biophys Acta 1829: 361–375.
5. Oficjalska-Pham D, Harismendy O, Smagowicz WJ, Gonzalez de Peredo A, Boguta M, et al.(2006) General repression of RNA polymerase III transcription is triggered by protein phosphatase type 2A-mediated dephosphorylation of Maf1. Mol Cell 22: 623–632.
6. Conesa C, Acker J (2010) Sub1/PC4 a chromatin associated protein with multiple functions in transcription. RNA Biol 7: 287–290.
7. Sikorski TW, Ficarro SB, Holik J, Kim T, Rando OJ, et al.(2011) Sub1 and RPA associate with RNA polymerase II at different stages of transcription. Mol Cell 44: 397–409.
8. Garcia A, Collin A, Calvo O (2012) Sub1 associates with Spt5 and influences RNA polymerase II transcription elongation rate. Mol Biol Cell 23: 4297–4312.
9. Tavenet A, Suleau A, Dubreuil G, Ferrari R, Ducrot C, et al.(2009) Genome-wide location analysis reveals a role for Sub1 in RNA polymerase III transcription. Proc Natl Acad Sci U S A 106: 14265– 14270.
10. Rosonina E, Willis IM, Manley JL(2009) Sub1 functions in osmoregulation and in transcription by both RNA polymerases II and III. Mol Cell Biol 29: 2308–2321.
11. Koyama H, Sumiya E, Nagata M, Ito T, Sekimizu K(2008) Transcriptional repression of the IMD2 gene mediated by the transcriptional co-activator Sub1. Genes Cells 13: 1113–1126.
12. Ciesla M, Towpik J, Graczyk D, Oficjalska-Pham D, Harismendy O, et al.(2007) Maf1 is involved in coupling carbon metabolism to RNA polymerase III transcription. Mol Cell Biol 27: 7693–7702.
13. Boer VM, Amini S, Botstein D(2008) Influence of genotype and nutrition on survival and metabolism of starving yeast. Proc Natl Acad Sci U S A 105: 6930–6935.
14. Sherman F(1991) Getting started with yeast. Methods Enzymol 194: 3–21.
15. Haase SB, Reed SI(2002) Improved flow cytometric analysis of the budding yeast cell cycle. Cell Cycle 1: 132–136.
17. Volland C, Urban-Grimal D, Geraud G, Haguenauer-Tsapis R(1994) Endocytosis and degradation of the yeast uracil permease under adverse conditions. J Biol Chem 269: 9833–9841.
18. Ju Q, Warner JR(1994) Ribosome synthesis during the growth cycle of Saccharomyces cerevisiae. Yeast 10: 151–157.
19. Deschampesme A-M, Koroleva O, Leger-Sylvestre I, Gas N, Camier S (1999) Assembly of 5S ribosomal RNA is required at a specific step of the pre-rRNA processing pathway. J Cell Biol 145: 1369– 1380.
20. Calvo O, Manley JL(2005) The transcriptional coactivator PC4/Sub1 has multiple functions in RNA polymerase II transcription. Embo J 24: 1009–1020.
21. Radonjic M, Andrau JC, Lijnzaad P, Kemmeren P, Kockelkorn TT, et al. (2005) Genome-wide analyses reveal RNA polymerase II located upstream of genes poised for rapid response upon S. cerevisiae stationary phase exit. Mol Cell 18: 171–183.
22. Gomes P, Sampaio-Marques B, Ludovico P, Rodrigues F, Leao C (2007) Low auxotrophy-complementing amino acid concentrations reduce yeast chronological life span. Mech Ageing Dev 128: 383–391.
23. Upadhya R, Lee J, Willis IM(2002) Maf1 is an essential mediator of diverse signals that repress RNA polymerase III transcription. Mol Cell 10: 1489–1494.
24. Weinberger M, Feng L, Paul A, Smith DL, Jr., Hontz RD, et al.(2007) DNA replication stress is a determinant of chronological lifespan in budding yeast. PLoS One 2: e748.
25. Longo VD, Shadel GS, Kaeberlein M, Kennedy B (2012) Replicative and chronological aging in Saccharomyces cerevisiae. Cell Metab 16: 18–31.
26. Zheng J, Benschop JJ, Shales M, Kemmeren P, Greenblatt J, et al.(2010) Epistatic relationships reveal the functional organization of yeast transcription factors. Mol Syst Biol 6: 420.
27. Beltrao P, Trinidad JC, Fiedler D, Roguev A, Lim WA, et al.(2009) Evolution of phosphoregulation: comparison of phosphorylation patterns across yeast species. PLoS Biol 7: e1000134.
28. Swinnen E, Ghillebert R, Wilms T, Winderickx J (2013) Molecular mechanisms linking the evolutionary conserved TORC1-Sch9 nutrient signalling branch to lifespan regulation in
Saccharomyces cerevisiae. FEMS Yeast Res.
29. Ptacek J, Devgan G, Michaud G, Zhu H, Zhu X, et al.(2005) Global analysis of protein phosphorylation in yeast. Nature 438: 679–684.
30. Soulard A, Cremonesi A, Moes S, Schutz F, Jeno P, et al. (2010) The rapamycin-sensitive phosphoproteome reveals that TOR controls protein kinase A toward some but not all substrates. Mol Biol Cell 21: 3475–3486.
31. Dieci G, Bosio MC, Fermi B, Ferrari R(2013) Transcription reinitiation by RNA polymerase III. Biochim Biophys Acta 1829: 331–341.
32. Das C, Hizume K, Batta K, Kumar BR, Gadad SS, et al.(2006) Transcriptional coactivator PC4, a chromatin-associated protein, induces chromatin condensation. Mol Cell Biol 26: 8303–8315.
33. Kaluarachchi Duffy S, Friesen H, Baryshnikova A, Lambert JP, Chong YT, et al.(2012) Exploring the yeast acetylome using functional genomics. Cell 149: 936–948.
34. Andersen JS, Lam YW, Leung AK, Ong SE, Lyon CE, et al.(2005) Nucleolar proteome dynamics. Nature 433: 77–83.
35. Coute Y, Burgess JA, Diaz JJ, Chichester C, Lisacek F, et al.(2006) Deciphering the human nucleolar proteome. Mass Spectrom Rev 25: 215–234.
36. Cabart P, Lee J, Willis IM (2008) Facilitated recycling protects human RNA polymerase III from repression by Maf1 in vitro. J Biol Chem 283: 36108–36117.
37. Desai N, Lee J, Upadhya R, Chu Y, Moir RD, et al.(2005) Two steps in Maf1-dependent repression of transcription by RNA polymerase III. J Biol Chem 280: 6455–6462.
39. Wei M, Fabrizio P, Hu J, Ge H, Cheng C, et al.(2008) Life span extension by calorie restriction depends on Rim15 and transcription factors downstream of Ras/PKA, Tor, and Sch9. PLoS Genet 4: e13.
40. Lee J, Moir RD, Willis IM (2009) Regulation of RNA polymerase III transcription involves SCH9-dependent and SCH9-inSCH9-dependent branches of the target of rapamycin (TOR) pathway. J Biol Chem 284: 12604–12608.
41. Huber A, Bodenmiller B, Uotila A, Stahl M, Wanka S, et al.(2009) Characterization of the rapamycin-sensitive phosphoproteome reveals that Sch9 is a central coordinator of protein synthesis. Genes Dev 23: 1929–1943.
42. Fabrizio P, Pozza F, Pletcher SD, Gendron CM, Longo VD(2001) Regulation of longevity and stress resistance by Sch9 in yeast. Science 292: 288–290.
43. Karkusiewicz I, Turowski TW, Graczyk D, Towpik J, Dhungel N, et al.(2011) Maf1 protein, repressor of RNA polymerase III, indirectly affects tRNA processing. J Biol Chem 286: 39478–39488.
44. Ghavidel A, Kislinger T, Pogoutse O, Sopko R, Jurisica I, et al.(2007) Impaired tRNA nuclear export links DNA damage and cell-cycle checkpoint. Cell 131: 915–926.
45. Whitney ML, Hurto RL, Shaheen HH, Hopper AK(2007) Rapid and reversible nuclear accumulation of cytoplasmic tRNA in response to nutrient availability. Mol Biol Cell 18: 2678–2686.
46. Alvers AL, Fishwick LK, Wood MS, Hu D, Chung HS, et al. (2009) Autophagy and amino acid homeostasis are required for chronological longevity in Saccharomyces cerevisiae. Aging Cell 8: 353– 369.
47. Drees BL, Thorsson V, Carter GW, Rives AW, Raymond MZ, et al. (2005) Derivation of genetic interaction networks from quantitative phenotype data. Genome Biol 6: R38.