Structural and Functional Brain Correlates of
Cognitive Impairment in Euthymic Patients
with Bipolar Disorder
Silvia Alonso-Lana1,2,3, José M. Goikolea2,4, Caterina M. Bonnin2,4, Salvador Sarró1,2, Barbara Segura5, Benedikt L. Amann1,2, Gemma C. Monté1,2, Noemi Moro1,6,
Paloma Fernandez-Corcuera1,6, Teresa Maristany7, Raymond Salvador1,2, Eduard Vieta2,4,5, Edith Pomarol-Clotet1,2
*, Peter J. McKenna1,2
1FIDMAG Germanes Hospitalàries Research Foundation, Barcelona, Spain,2Centro de Investigación Biomédica en Red de Salud Mental (CIBERSAM), Madrid, Spain,3Programa de Doctorado de Medicina, University of Barcelona, Barcelona, Spain,4Bipolar Disorder Program, Institute of Neuroscience, Hospital Clínic, University of Barcelona, IDIBAPS, Barcelona, Catalonia, Spain,5Department of Psychiatry and Clinical Psychobiology, University of Barcelona, Barcelona, Spain,6Benito Menni Complex Assistencial en Salut Mental, Barcelona, Spain,7Hospital Sant Joan de Déu Infantil, Barcelona, Spain
Abstract
Introduction
Cognitive impairment in the euthymic phase is a well-established finding in bipolar disorder. However, its brain structural and/or functional correlates are uncertain.
Methods
Thirty-three euthymic bipolar patients with preserved memory and executive function and 28 euthymic bipolar patients with significant memory and/or executive impairment, as defined using two test batteries, the Rivermead Behavioural Memory Test (RBMT) and the Behavioural Assessment of the Dysexecutive Syndrome (BADS), plus 28 healthy controls underwent structural MRI using voxel-based morphometry (VBM). Twenty-seven of the cognitively preserved patients, 23 of the cognitively impaired patients and 28 controls also underwent fMRI during performance of the n-back working memory task.
Results
No clusters of grey or white matter volume difference were found between the two patient groups. During n-back performance, the cognitively impaired patients showed hypoactiva-tion compared to the cognitively preserved patients in a circumscribed region in the right dorsolateral prefrontal cortex. Both patient groups showed failure of de-activation in the medial frontal cortex compared to the healthy controls.
a11111
OPEN ACCESS
Citation:Alonso-Lana S, Goikolea JM, Bonnin CM, Sarró S, Segura B, Amann BL, et al. (2016) Structural and Functional Brain Correlates of Cognitive Impairment in Euthymic Patients with Bipolar Disorder. PLoS ONE 11(7): e0158867. doi:10.1371/ journal.pone.0158867
Editor:Consuelo Walss-Bass, UTHSCSH, UNITED STATES
Received:October 28, 2015
Accepted:June 23, 2016
Published:July 22, 2016
Copyright:© 2016 Alonso-Lana et al. This is an open access article distributed under the terms of the
Creative Commons Attribution License, which permits unrestricted use, distribution, and reproduction in any medium, provided the original author and source are credited.
Data Availability Statement:All relevant data are within the paper and its Supporting Information files.
Funding:This work was supported by several grants from the Instituto de Salud Carlos III, European
Regional Fund, European Union,“Una manera de
Conclusions
Cognitive impairment in euthymic bipolar patients appears from this study to be unrelated to structural brain abnormality, but there was some evidence for an association with altered prefrontal function.
Introduction
Studies over the last two decades have demonstrated that a proportion of patients with bipolar disorder show cognitive impairment that persists beyond episodes of illness into euthymia [1]. The deficits are wide ranging [2], but may involve executive function and long-term memory particularly [1], and they are associated with impaired functioning in daily life [3,4]. Presence of residual mood disturbance does not appear to fully account for the impairment seen [5], nor, according to a meta-analysis, does treatment with antipsychotic drugs [6]. Lithium [7] and anticonvulsants [8] have been found to impair only some areas of cognitive function in bipolar patients and so also appear to be unlikely to be the whole explanation.
Since patients with bipolar disorder do not show evidence of premorbid intellectual disad-vantage [9–11], some form of brain dysfunction presumably underlies this form of persistent cognitive impairment. One possibility is that it is a consequence of structural brain pathology. Bipolar disorder is known to be associated with lateral ventricular enlargement [12–14], and there is evidence for a small reduction in brain size, although this reached significance in only one of two meta-analyses [13,14]. Studies using whole-brain techniques such as voxel-based morphometry (VBM) have additionally found evidence for volume reductions in the anterior cingulate cortex, the insula and the inferior frontal cortex, among other regions [15–18]. White matter changes are also well documented in bipolar disorder, both in the form of subcortical signal hyperintensities [19] and reduced fractional anisotropy on diffusion tensor imaging (DTI); the latter changes have been found most consistently in the right temporo-parietal and the left anterior and mid-cingulate regions [20].
Relatively few studies have examined whether structural changes in bipolar patients are related to presence of cognitive impairment. Early studies reviewed by Bearden et al [21] found some evidence of associations with increased lateral ventricular volume and volume reductions in the prefrontal cortex, and more robustly with presence of white matter signal intensities. However, more recent studies examining multiple grey and white matter regions have generally found few significant correlations with executive, memory or other cognitive deficits [22–26].
Findings from many functional imaging studies in bipolar disorder have led to a consensus that it is characterized by reduced resting and task-related activity in the prefrontal cortex and some other cortical regions, coupled with overactivity in the amygdala, hippocampus and para-hippocampal gyrus and the basal ganglia [27]. Not all of these abnormalities are seen in euthy-mia, however. Thus, in a meta-analysis pooling effect size data from PET, SPECT and fMRI studies, Kupferschmidt et al [28] found that euthymic patients showed evidence of task-related hypoactivations in the inferior and middle frontal cortex and the dorsolateral prefrontal cortex (DLPFC), as well as hyperactivity in the superior temporal gyrus and ventrolateral prefrontal cortex. On the other hand, in a meta-analysis of voxel-based studies, Chen et al [29] found evi-dence only for reduced activation in the lingual gyrus in euthymic patients.
To date, very few studies have investigated brain activations in relation to cognitive impairment in bipolar disorder [30–32]. In one study that examined patients in the euthymic phase, Oertel-Knöchel et al [33] found that 26 euthymic bipolar patients were impaired on a Universitats i Recerca del DIUE from the Catalonian
Government (2009SGR211 to FIDMAG group and 2009SGR1022 to Bipolar Disorders Group). The FIDMAG Germanes Hospitalàries Research Foundation provided support in the form of salaries for authors (SS, PM), but did not have any additional role in the study design, data collection and analysis, decision to publish, or preparation of the manuscript. The specific roles of these authors are articulated in the‘author contributions’section.
verbal learning and recognition task, and also showed a pattern of reduced activation compared to healthy controls when they performed the same task while being scanned. The areas affected included the left middle and superior frontal gyrus during encoding, and the bilateral middle and inferior frontal gyrus, plus the parahippocampal and other posterior medial cortical areas during retrieval.
The aim of this study was to determine whether and to what extent cognitive impairment in euthymic bipolar patients has brain structural and/or functional correlates. To do this, we recruited groups of demographically well-matched patients who either showed or did not show executive and/or memory impairment, defined according to predetermined criteria, in the euthymic phase. Healthy controls were also employed. Both whole-brain structural imaging (VBM) and functional imaging (cognitive task-related fMRI) were carried out.
Materials and Methods
Participants
The patient sample consisted of two groups of adults with bipolar disorder, who were prospec-tively recruited on the basis of showing (N = 28) or not showing (N = 33) cognitive impairment (as defined below) in the euthymic phase. Patients were from the outpatient departments of two psychiatric hospitals in Barcelona: Benito Menni CASM and the University of Barcelona Hospital Clínic. They all met DSM-IV criteria for bipolar I disorder and were required to have had at least two episodes of illness. Patients were excluded if a) they were younger than 18 or older than 55; b) they had a history of brain trauma or neurological disease, c) they had shown alcohol/substance abuse within 12 months prior to participation; d) they had undergone elec-troconvulsive therapy in the previous 12 months; and e) they showed evidence of general intel-lectual impairment/handicap, as indexed by a current IQ outside the normal range (i.e. below 70) as measured using four subtests of the Wechsler Adult Intelligence Scale III (WAIS-III) (vocabulary, similarities, block design, and matrix reasoning). All patients were right-handed.
Patients were considered to be euthymic if they had had no episodes of illness for at least three months and if they had a score on Hamilton Rating Scale for Depression (HDRS-21) of8 and Young Mania Rating Scale (YMRS) of8 at the time of testing. These quite strict
requirements were used in order to avoid the potentially confounding effects of subthreshold depressive and manic symptoms on cognitive function [34]. The upper age limit of 55 was cho-sen in order to exclude late-onset affective disorder which has an association with vascular and neurodegenerative disease and so might be independently associated with cognitive
impairment [35].
Patients in the cognitively preserved group were on treatment with mood stabilizers (lith-ium alone n = 13, other mood stabilizers alone n = 6; lith(lith-ium in combination with other mood stabilizers n = 9), antidepressants (n = 8) and antipsychotics (n = 21; second generation n = 21, first generation n = 2; mean chlorpromazine equivalent dose 284.65 ±337.31 mg/day). The cog-nitively impaired patients were also on treatment with mood stabilizers (lithium alone n = 13, other mood stabilizers alone n = 4; lithium in combination with other stabilizers n = 7), antide-pressants (n = 7); 17 were taking antipsychotics (second generation n = 15, first generation n = 1, both n = 1; mean chlorpromazine equivalent dose 245.20± 209.77 mg/day).
The three groups were selected to be matched for age, sex and estimated IQ (premorbid IQ in the patients). IQ was estimated using the Word Accentuation Test (Test de Acentuación de Palabras, TAP) [36] a pronunciation test that is conceptually similar to the National Adult Reading Test (NART) used in the UK [37] and the Wide Range of Achievement Test (WRAT) in the USA [38]. Subjects have to pronounce low-frequency Spanish words whose accents have been removed. Scores can be converted into IQ estimates [39].
Cognitive assessment
This was based on Spanish versions of two well-validated memory and executive test batteries, the Rivermead Behavioural Memory Test (RBMT) [40] and the Behavioural Assessment of the Dysexecutive Syndrome (BADS) [41]. These two tests provide a wide ranging assessment of different aspects of memory and executive function, respectively, and are designed to be‘ eco-logically valid’, that is to capture the broad range of executive and memory functions required in real-life settings. Both have been subjected to extensive validation in healthy adults and nor-mative data for healthy adults are available.
The RBMT consists of 12 subtests examining verbal recall, recognition, orientation, remem-bering a route and three measures of prospective memory, the ability to remember to do things. Pass/fail scores are summed to give a‘screening’score. The BADS consists of 6 subtests cover-ing cognitive estimation, rule shiftcover-ing, planncover-ing, problem solvcover-ing and decision makcover-ing under multiple task demands (the Modified Six Elements Test). Scores from 0 to 4 on each subtest are summed to give an overall‘profile’score.
The patients were classified as cognitively preserved or impaired using 5thpercentile cutoffs based on normative data for adults. Thresholding for impairment at the 5thpercentile for the normal population is an established method in neuropsychology [42]. Specifically, patients were considered cognitively impaired if they scored below the 5th percentile on the RBMT and/or the BADS (screening score of7 on the RBMT and profile score of11 on the BADS),
and were considered cognitively preserved if they scored at or above the 5th percentile on both tests (8 or more on the RBMT and12 on the BADS).
Scanning procedure
All subjects underwent structural and functional MRI scanning using a 1.5 Tesla GE Signa scanner (General Electric Medical Systems, Milwaukee, Wis) located at the Sant Joan de Déu Hospital in Barcelona (Spain).
Structural neuroimaging. High resolution structural T1-weighted MRI data were acquired with the following acquisition parameters: matrix size 512x512; 180 contiguous axial slices; slice thickness of 1 mm, no slice gap; voxel resolution 0.47x0.47x1 mm3; echo time (TE) = 3.93 ms, repetition time (TR) = 2000 ms and inversion time (TI) = 710 ms; flip angle 15°.
Group comparisons were performed using permutation-based non-parametric tests. The TFCE (Threshold-Free Cluster Enhancement) method, also implemented in FSL, was used for this purpose. TFCE finds clusters in the data without having to define the initial cluster-form-ing threshold [48]. Cluster-like structures are enhanced but the image remains fundamentally voxel-wise. In the resulting maps, obtained with 5000 permutations, family-wise error (FWE) rate was used to control for multiple comparisons and only FWE-corrected cluster p-values
<0.05 were considered.
We also examined white matter volume. Since the VBM analysis in FSL has only been vali-dated for grey matter, this was carried out with SPM12 (http://www.fil.ion.ucl.ac.uk/spm/ software/spm12/). The following standard pre-processing steps were carried out: (1) tissue-type segmentation, (2) normalization to standard space of the obtained white matter images and (3) modulation. The resulting images were then smoothed with an isotropic Gaussian ker-nel with a sigma of 4 mm. In order to make the results comparable to those reported for grey matter using FSL-VBM, statistical analysis were conducted with the same correction method. That is, all comparisons were carried out with the TFCE method included in FSL, using 5000 permutations and a FWE-corrected threshold of p<0.05.
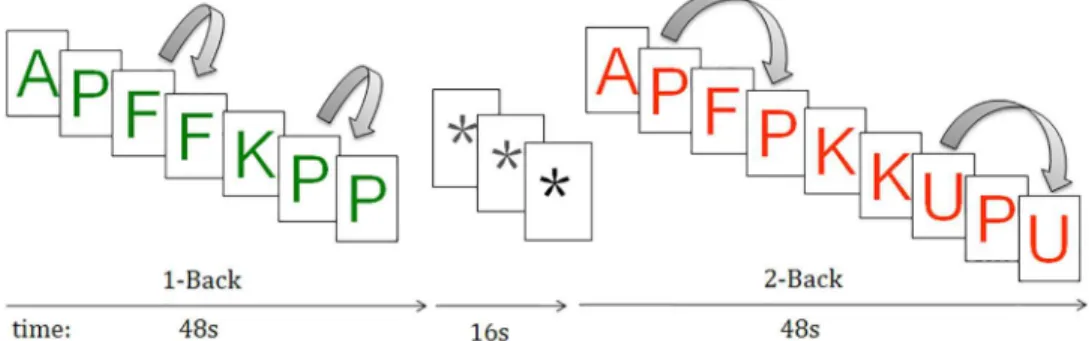
Functional neuroimaging. For this we used the n-back task [49], which has been widely employed as a probe for executive function, specifically working memory, in fMRI studies in healthy subjects [50] and psychiatric disorders including schizophrenia [51] and bipolar disor-der [52]. Two levels of memory load (1-back and 2-back) were presented in a blocked design manner; in the 1-back task, participants had to respond with a key press when a letter was the same as the one that was presented immediately previously, whereas in the 2-back task they had to respond when the letter was the same as that presented two letters previously (Fig 1). Each block consisted of 24 letters which were shown every two seconds (1 second on, one sec-ond off) and all blocks contained five repetitions (1-back and 2-back depending on the block) located randomly within block. Individuals had to detect these repetitions and respond by pressing a button. In order to identify which task had to be performed, characters were shown in green in the 1-back blocks and in red in the 2-back blocks. Four 1-back and four 2-back blocks were presented in an interleaved way, and between them, a baseline stimulus (an asterisk flashing with the same frequency as the letters) was presented for 16 seconds. All individuals went through a training session before entering the scanner.
Performance was measured using the signal detection theory index of sensitivity (d’) of abil-ity to discriminate targets from non-targets [53]. Higher values of d’indicate better ability to discriminate between targets and distractors. Subjects who had negative d’values in either the 1-back and 2-back versions of the task, which suggests that they were not performing it, were excluded from the analysis.
Fig 1. Sequential-letter version of the n-back task with two levels of memory load, 1-back (green) and 2-back (red).
In each individual scanning session 266 volumes were acquired. A gradient echo echo-pla-nar sequence depicting the BOLD contrast was used. Each volume contained 16 axial planes acquired with the following parameters: TR = 2000 ms, TE = 20 ms, flip angle = 70 degrees, sec-tion thickness = 7 mm, secsec-tion skip = 0.7 mm, in-plane resolusec-tion = 3x3 mm. The first 10 vol-umes were discarded to avoid T1 saturation effects.
fMRI image analyses were performed with the FEAT module, included in FSL software [54]. Pre-processing with FSL-FEAT included: a) motion correction [47]; b) non-brain removal [45]; c) isotropic 5mm-FWHM Gaussian smoothing; d) high-pass temporal filtering; e) time-series statistical analysis with local autocorrelation correction [55]; and f) registration to the MNI 152 standard space [46,47]. To minimize unwanted movement-related effects, partici-pants with an estimated maximum absolute movement>3.0 mm or an average absolute
move-ment>0.3 mm were excluded from the study.
General linear models (GLMs) were fitted to generate the individual activation maps for the 1-back vs. baseline, 2-back vs. baseline and 2-back vs. 1-back comparisons. Differences in fMRI activation maps between patients and controls were generated within the FEAT module, using mixed effects GLM models [56]. FEAT uses Gaussian random field theory to properly account for the spatially distributed patterns when performing statistical tests. Specifically, the analyses were performed with the FLAME stage 1 with default height threshold (z>2.3) [55,57] and a
p-value<0.05 corrected for multiple comparisons [58,59].
Ethics statement
All subjects gave written informed consent prior to participation in accordance to the Declara-tion of Helsinki. Only individuals judged to have decision-making capacity were included. The subjects in the cognitively impaired group were included on the basis that they showed mem-ory and/or executive function as detected during the course of the neuropsychological testing carried out for the purpose of the study, not because they had been found to show clinically sig-nificant cognitive impairment by their treating clinicians. The research protocol was approved by the Clinical Research Ethics Committee of the Sisters Hospitallers (Comité de Ética de Investigación Clínica de las Hermanas Hospitalarias), which also approved this method of obtaining informed consent for the study.
Data analysis
Demographic, clinical and cognitive variables were compared among the groups using SPSS version 17. Normality of continuous variables was examined for and parametric (t-test or ANOVA) or non-parametric tests (Mann-Whitney or Kruskal-Wallis test) were applied as appropriate.
In order to examine the relationship between presence of cognitive impairment and brain structure and function, we carried out two comparisons using a strategy we have employed pre-viously for schizophrenia [60]. First, we contrasted the cognitively preserved group with the control group; this gives a measure of changes in brain structure and/or function that are attributable to bipolar disorder uncontaminated by presence of cognitive impairment. Sec-ondly, to detect changes attributable to the presence of cognitive impairment, we contrasted the cognitively preserved and cognitively impaired patient groups.
Results
and antipsychotic dosage between the cognitively preserved and the cognitively impaired patients (Table 1).
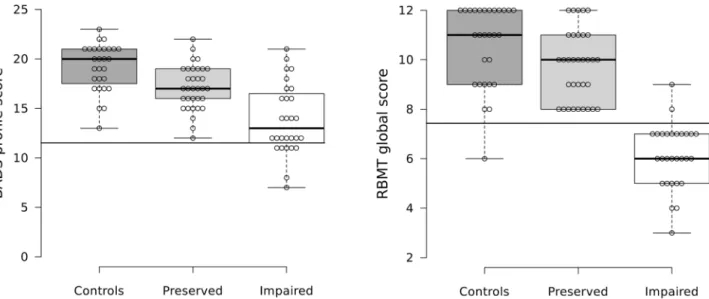
As expected, the two patient groups differed in their performance on the BADS and RBMT (Table 1). The cognitively preserved group was also found to show significant differences from the healthy controls. A scatter plot of scores for all three subject groups is shown inFig 2and indicates that this latter finding was due to more cognitively preserved patients falling into low average ranges than the healthy controls.
VBM findings
Controls vs. cognitively preserved patients. At p<0.05 corrected, the cognitively
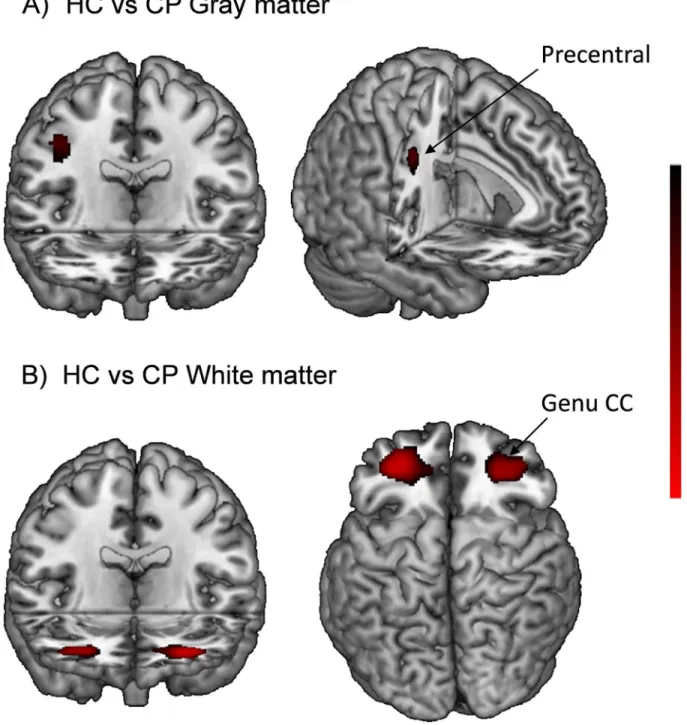
pre-served patients showed significantly reduced grey matter volume in a single small cluster located in the right precentral gyrus [173 voxels, p = 0.03; peak in BA6, MNI (38,-10,38)] (Fig 3).
The cognitively preserved patients also showed bilaterally symmetrical clusters of signifi-cantly reduced white matter volume compared to the controls. On the left side, a cluster extended from the inferior occipito-frontal and uncinate fasciculus to the genu of corpus callo-sum [2966 voxels, p = 0.01, peak in MNI (-30, 46.5, 1.5)]. A second smaller cluster on the same side was located in the white matter adjacent to the inferior frontal cortex [337 voxels, p = 0.03, peak in MNI (-36, 21, 22.5)]. On the right side, there was only one cluster [4294 voxels, p = 0.02, peak in MNI (27, 46.5, 3)] (Fig 3).
Cognitively preserved vs. cognitively impaired patients. There were no areas of signifi-cant grey matter volume difference between the cognitively preserved patients and the cogni-tively impaired patients at P<0.05, corrected. Lowering the threshold to p<0.005 uncorrected
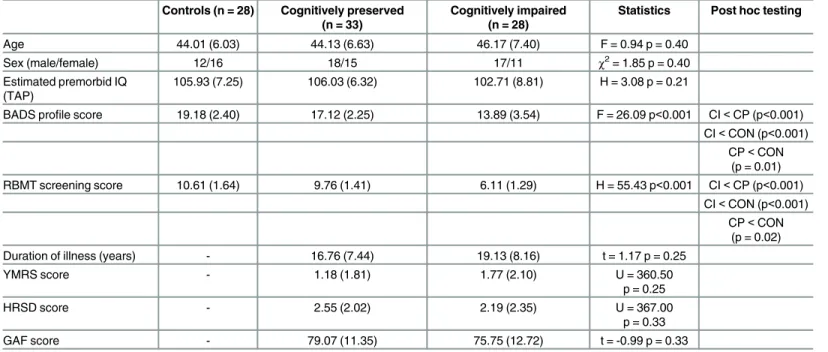
Table 1. Demographic, neurocognitive and psychopathological characteristics of the groups. Controls (n = 28) Cognitively preserved
(n = 33)
Cognitively impaired (n = 28)
Statistics Post hoc testing
Age 44.01 (6.03) 44.13 (6.63) 46.17 (7.40) F = 0.94 p = 0.40
Sex (male/female) 12/16 18/15 17/11 χ2= 1.85 p = 0.40
Estimated premorbid IQ (TAP)
105.93 (7.25) 106.03 (6.32) 102.71 (8.81) H = 3.08 p = 0.21
BADS profile score 19.18 (2.40) 17.12 (2.25) 13.89 (3.54) F = 26.09 p<0.001 CI<CP (p<0.001) CI<CON (p<0.001)
CP<CON (p = 0.01) RBMT screening score 10.61 (1.64) 9.76 (1.41) 6.11 (1.29) H = 55.43 p<0.001 CI<CP (p<0.001)
CI<CON (p<0.001) CP<CON
(p = 0.02)
Duration of illness (years) - 16.76 (7.44) 19.13 (8.16) t = 1.17 p = 0.25
YMRS score - 1.18 (1.81) 1.77 (2.10) U = 360.50
p = 0.25
HRSD score - 2.55 (2.02) 2.19 (2.35) U = 367.00
p = 0.33
GAF score - 79.07 (11.35) 75.75 (12.72) t = -0.99 p = 0.33
Values are given as mean (SD). IQ, intelligence quotient; TAP, Word Accentuation Test; BADS, Behavioural Assessment of the Dysexecutive Syndrome; RBMT, Rivermead Behavioural Memory Test; YMRS, Young Mania Rating Scale; HRSD, Hamilton Rating Scale for Depression; GAF, Global Assessment of Functioning; F, one-way ANOVA test;χ2, Chi-square test; H, one-way Kruskal-Wallis test; U, Mann-Whitney test; CON, controls; CP, cognitively
preserved; CI, cognitively impaired.
did not result in the appearance of any clusters. Substituting non-modulated images in the analysis also failed to reveal any clusters of significant difference.
Functional imaging findings
Twenty-eight of the healthy controls, 27 of the cognitively preserved patients and 23 of the cog-nitively impaired patients participated in this part of the study (5 cogcog-nitively preserved patients and 5 cognitively impaired patients could not be included because of technical problems with the acquisition and processing of the images; 1 cognitively preserved patient was excluded because of excessive movement). There continued to be no significant differences between the three groups in demographic characteristics, and between the two patient groups in clinical rat-ings (S1 Table).
Behavioural performance. The mean level of performance (d’) on the 1-back and 2-back versions of the n-back task was lower in the cognitively preserved patients than in the healthy controls, and lower in the cognitively impaired patients than in the cognitively preserved patients [1-back: 4.40 (0.57) vs. 4.17 (0.63) vs. 3.67 (1.09); H = 7.56; p = 0.02; 2-back: 3.33 (0.83) vs. 3.00 (0.69) vs. 2.52 (0.73); F = 7.32, p<0.001]. However, only the differences between
the controls and the cognitively impaired patients reached significance (S1 Table).
Within-group activations and de-activations. In the 2-back vs. baseline comparison the healthy controls showed bilateral activations in the DLFPC, precentral gyri, supplementary motor area, anterior insula, cerebellum, thalamus, basal ganglia, and parts of the temporal and parietal cortex. In the 1-back vs. baseline, activations followed a broadly similar pattern but the clusters were less extensive, the basal ganglia were activated only in the left side and no activa-tions were seen in cerebellum and thalamus (S2 Table,S1andS2Figs).
Task-related de-activations in the 2-back vs. baseline contrast were seen bilaterally in the medial frontal cortex, amygdala, hippocampus, the medial parietal cortex, the posterior insula and the lateral parietal cortex. In the 1-back vs. baseline contrast, only the medial frontal cortex showed de-activation (S1andS2Figs).
Activations and de-activations in the two groups of euthymic bipolar patients followed a broadly similar pattern to that seen in the controls. However, both the activation and Fig 2. Scatter plots for the controls, cognitively preserved and cognitively impaired groups.Scatter plot of scores on (A) the RBMT and (B) the BADS. The horizontal lines show 5thpercentile cutoffs for impairment.
de-activation clusters were noticeably less extensive. The cognitively impaired patients in particular showed less extensive prefrontal activation in 2-back vs. baseline contrast and no de-activation in the medial prefrontal, amygdala, hippocampus and posterior insula in both the 1-back vs. baseline and 2-back vs. baseline contrasts (S1andS2Figs).
Controls vs. cognitively preserved patients. There were no activation differences between the healthy controls and the cognitively preserved patients in the 1-back vs. baseline or the 2-back vs. baseline contrasts, or in the 2-back vs. 1-back contrast. The cognitively preserved Fig 3. Brain regions showing significant gray and white matter volume reduction in the cognitively preserved patients with bipolar disorder compared with controls.
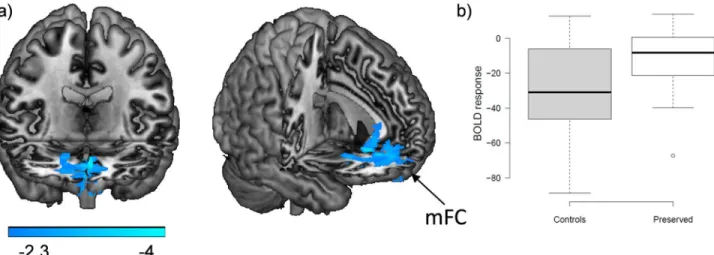
patients did, however, show a cluster of failure of de-activation in comparison to the healthy controls in both contrasts. In the 2-back vs. baseline contrast this cluster was located in the medial prefrontal cortex affecting the gyrus rectus and extended to the medial orbitofrontal and anterior cingulate cortex [4743 voxels, p = 2.18x10⁻⁹; peak activation in BA11, MNI (4, 34,-8), z score = 4.5]. In the 2-back vs. 1-back contrast the cluster occupied a similar but smaller area in the medial prefrontal cortex [1718 voxels, p = 2.04x10⁻⁴; peak activation in BA25, MNI (2,36,6), z score = 4.16]. The findings for the 2-back vs. 1-back contrast are shown inFig 4A. Boxplots of the averaged values in the medial prefrontal region-of-interest (ROI) for the con-trols and the cognitively preserved patients for this contrast confirm that the differences repre-sented failure of de-activation: the controls showed de-activation whereas in the patients the mean value was close to zero (Fig 4B).
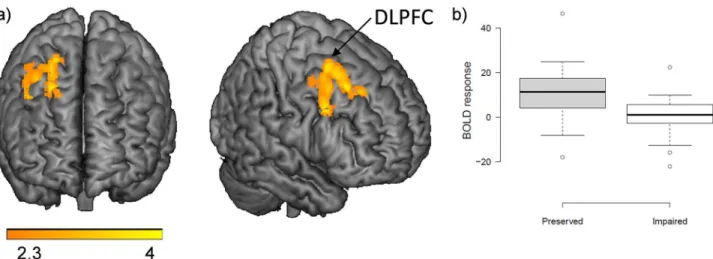
Cognitively preserved vs. cognitively impaired patients. There were no differences between the two patient groups in the 1-back vs. baseline and the 2-back vs. baseline contrasts. The 2-back vs. 1-back contrast, however, revealed a cluster of reduced activation in the cogni-tively impaired group in the right lateral frontal cortex, extending from the inferior frontal operculum to lateral superior frontal regions and including parts of the DLPFC [905 voxels, p= 0.008; peak activation in BA8, right superior frontal, MNI (24, 20, 46), z score = 4.12]. The findings are shown inFig 5. The two patient groups did not show differences in de-activation.
Discussion
Cognitive impairment in the euthymic phase—i.e. that is persistent and unrelated to mood dis-turbance—is now a well-established finding in bipolar disorder. Our study suggests that its basis does not lie in brain structural change. However, there was a positive signal in relation to brain function, with the cognitively impaired patients showing reduced activation in the right DLPFC compared to the cognitively preserved patients.
Given that in neurological disease structural brain damage is commonly associated with neuropsychological deficits, our failure to find differences in grey or white matter volume between bipolar patients with and without cognitive impairment might be considered surpris-ing. One possible reason for this might be that, with sample sizes of 33 and 28 patients, the study might simply have lacked sufficient power to detect differences. Against this, however, is Fig 4. Brain functional changes between controls and cognitively preserved patients.(A) Brain regions where the cognitively preserved patients showed significant failure of de-activation compared with the controls in the 2-back vs. 1-back contrast. MFC: medial frontal cortex. (B) Boxplots of mean de-activations within this ROI.
the fact that grey matter changes were still not seen when a more liberal threshold of p<0.005
uncorrected was used in the VBM analysis, or when the modulation step was omitted, which also increases sensitivity [61].
Our negative structural imaging findings might also be considered inconsistent with the cur-rent widely held view that the occurrence of persistent cognitive impairment in some patients with bipolar disorder reflects a neurodegenerative process [62]. Of course, being cross-sectional in nature, the study does not speak directly to this issue. Nevertheless, it is interesting to note that the evidence that progressive brain structural change takes place at all in bipolar disorder is actually quite weak. Thus, reviewing the small number of longitudinal studies carried out to date, Lim et al [63] found no evidence for change in whole brain volume over time. Progressive volume reductions were found in the frontal lobe cortex in two small studies (N = 8 and N = 10) but not in a third, larger study (N = 58) which also employed healthy controls. Findings were likewise conflicting for the anterior cingulate cortex, amygdala and hippocampus.
On the other hand, we found evidence that cognitive impairment in euthymic bipolar patients was associated with brain functional changes, specifically reduced activation in a region that conformed reasonably closely to the right DLPFC, although this was only seen in the 2-back vs. 1-back contrast. Our findings here show a notable similarity to those of Oertel-Knöchel et al [33] described in the Introduction—they found reduced activation in the left middle superior frontal gyrus in 26 euthymic bipolar patients, who as a group showed poor memory test performance, during the encoding phase of a memory task (reduced activation was seen in other lateral frontal regions during retrieval). The DLPFC is implicated in both the cognitive, i.e. executive, aspects of frontal lobe function [64] and in long-term memory [65], and so is a plausible location for brain functional changes associated with performance of both types of task in bipolar disorder.
A factor complicating the interpretation of this finding concerns the‘chicken and egg’ nature of the relationship between cognition and brain activity. Does reduced activation in cog-nitively impaired euthymic bipolar patients point to underlying regional cerebral dysfunction? Or does it merely index the fact that the patients performed the task more poorly than the cog-nitively preserved patients and so activated their frontal lobes to a correspondingly lesser degree? To put it another way, would healthy subjects who were below the 5thpercentile on a memory or executive test (as some will inevitably be) show less DLPFC activation during n-Fig 5. Brain functional changes between cognitively impaired and preserved patients.(A) Brain regions where the cognitively impaired patients showed significantly reduced activation compared with the preserved patients in the 2-back v. 1-back contrast. (B) Boxplots of mean activations within this ROI.
back performance than those who are above this threshold? This problem has been considered in some depth in the schizophrenia literature e.g. [66–70], where the main conclusion reached has been that there is no simple linear relationship between cognitive performance and regional cortical activation. However, to our knowledge the same issue has not so far been addressed with respect to the cognitive impairment that sometimes accompanies bipolar disorder.
The other functional imaging finding in our study was failure of de-activation in the medial frontal cortex, which was seen in both groups of bipolar patients. This abnormality has been found in several other studies of bipolar disorder [71–73], with one additional study [74] find-ing failure of de-activation in the posterior cfind-ingulate cortex/precuneus. Both the medial frontal cortex and the posterior cingulate cortex/precuneus are components of the default mode net-work, a series of interconnected brain regions that are active at rest but which de-activate dur-ing performance of attention-demanddur-ing tasks [75]. Resting state connectivity studies have also implicated the default mode network in bipolar disorder [76]. The function or functions of the default mode network are currently uncertain, although a role in a range of high-level, self-related cognitive operations seems likely [75]. It has also been suggested that the network exerts a general influence on cognitive function—thus, in healthy subjects lower default mode net-work activity has been found to be associated with more successful task performance, and lapses of attention are associated with reduced de-activation (for a review see [77]). The fact that we found that medial frontal failure of de-activation did not distinguish cognitively pre-served from cognitively impaired euthymic patients, suggests that this general modulatory function carried out by the default mode network dysfunction does not play a role in the cogni-tive impairment seen in euthymic patients with bipolar disorder.
Conclusions and Limitations
Our findings do not suggest that brain structural alterations are related to the persistent cogni-tive impairment that is seen in a proportion of patients with bipolar disorder. However, we find evidence that it might be related to functional changes in the prefrontal cortex. Limitations of the study include that our strategy for recruiting patients meant that the cognitively pre-served patients were not explicitly matched with the healthy controls for cognitive function, and in fact they were significantly impaired compared to them. Accordingly, this group should be considered to have been only relatively cognitively preserved. Also, the sample sizes in the structural imaging comparison may have been too small to detect subtle volume differences between the two patient groups. Finally, we scanned at 1.5 Tesla, and our examination of white matter was limited to volume measurement only. Use of 3 Tesla scanning and/or examining white matter integrity using DTI might lead to changes related to cognitive impairment in bipolar disorder being found.
Supporting Information
S1 Dataset. Individual demographic, behavioral and fMRI data.
(XLSX)
S1 Fig. Mean activations and de-activations in the two patient groups and the controls from the 1-back vs. baseline contrast.Areas of significant activations (red- yellow) and deacti-vations (blue) in the three groups of subjects. The right side of the image is right side of the brain. MNI coordinates for each one of the axial slices are shown in the last row. Colors depict scores from statistical z maps (negative values in the deactivations). A: Healthy controls; B: Cognitively preserved patients; C: Cognitively impaired patients.
S2 Fig. Mean activations and de-activations in the two patient groups and the controls from the 2-back vs. baseline contrast.Areas of significant activations (red- yellow) and deacti-vations (blue) in the three groups of subjects. The right side of the image is right side of the brain. MNI coordinates for each one of the axial slices are shown in the last row. Colors depict scores from statistical z maps (negative values in the deactivations). A: Healthy controls; B: Cognitively preserved patients; C: Cognitively impaired patients.
(TIFF)
S1 Table. Demographic and psychopathological characteristics in the fMRI sample (SDs in brackets).
(DOCX)
S2 Table. Clusters of significant activation/de-activation in the comparison between the 1-back vs. baseline, 2-back vs. baseline and between the 1-back vs. 2-back contrasts.
(DOCX)
Author Contributions
Conceived and designed the experiments: EP-C PM. Performed the experiments: SA-L JMG CMB SS BS BLA NM PFC. Analyzed the data: SA-L GCM RS EP-C. Contributed reagents/ materials/analysis tools: TM. Wrote the paper: SA-L JMG EV EP-C PM.
References
1. Robinson LJ, Thompson JM, Gallagher P, Goswami U, Young AH, Ferrier IN, et al. A meta-analysis of cognitive deficits in euthymic patients with bipolar disorder. Journal of Affective Disorders. 2006; 93(1– 3):105–15. doi:10.1016/j.jad.2006.02.016. PMID:16677713
2. Mann-Wrobel MC, Carreno JT, Dickinson D. Meta-analysis of neuropsychological functioning in euthy-mic bipolar disorder: an update and investigation of moderator variables. Bipolar Disorders. 2011; 13 (4):334–42. doi:10.1111/j.1399-5618.2011.00935.x. PMID:21843273
3. Martinez-Aran A, Vieta E, Colom F, Torrent C, Sanchez-Moreno J, Reinares M, et al. Cognitive impairment in euthymic bipolar patients: implications for clinical and functional outcome. Bipolar Disor-ders. 2004; 6(3):224–32. doi:10.1111/j.1399-5618.2004.00111.x. PMID:15117401
4. Wingo AP, Harvey PD, Baldessarini RJ. Neurocognitive impairment in bipolar disorder patients: func-tional implications. Bipolar Disorders. 2009; 11(2):113–25. doi:10.1111/j.1399-5618.2009.00665.x. PMID:19267694
5. Bourne C, Aydemir O, Balanza-Martinez V, Bora E, Brissos S, Cavanagh JT, et al. Neuropsychological testing of cognitive impairment in euthymic bipolar disorder: an individual patient data meta-analysis. Acta Psychiatr Scand. 2013; 128(3):149–62. doi:10.1111/acps.12133. PMID:23617548
6. Bora E, Yucel M, Pantelis C. Cognitive endophenotypes of bipolar disorder: a meta-analysis of neuro-psychological deficits in euthymic patients and their first-degree relatives. Journal of Affective Disor-ders. 2009; 113(1–2):1–20. doi:10.1016/j.jad.2008.06.009. PMID:18684514
7. Wingo AP, Wingo TS, Harvey PD, Baldessarini RJ. Effects of lithium on cognitive performance: a meta-analysis. J Clin Psychiatry. 2009; 70(11):1588–97. doi:10.4088/JCP.08r04972. PMID:19689922
8. Sabater A, Garcia-Blanco AC, Verdet HM, Sierra P, Ribes J, Villar I, et al. Comparative neurocognitive effects of lithium and anticonvulsants in long-term stable bipolar patients. Journal of Affective Disorders. 2016; 190:34–40. doi:10.1016/j.jad.2015.10.008. PMID:26480209
9. Reichenberg A, Weiser M, Rabinowitz J, Caspi A, Schmeidler J, Mark M, et al. A population-based cohort study of premorbid intellectual, language, and behavioral functioning in patients with schizophre-nia, schizoaffective disorder, and nonpsychotic bipolar disorder. American Journal of Psychiatry. 2002; 159(12):2027–35. Epub 2002/11/27. PMID:12450952
10. Zammit S, Allebeck P, David AS, Dalman C, Hemmingsson T, Lundberg I, et al. A longitudinal study of premorbid IQ Score and risk of developing schizophrenia, bipolar disorder, severe depression, and other nonaffective psychoses. JAMA Psychiatry. 2004; 61(4):354–60. doi:10.1001/archpsyc.61.4.354.
12. McDonald C, Zanelli J, Rabe-Hesketh S, Ellison-Wright I, Sham P, Kalidindi S, et al. Meta-analysis of magnetic resonance imaging brain morphometry studies in bipolar disorder. Biological Psychiatry. 2004; 56(6):411–7. doi:10.1016/j.biopsych.2004.06.021. PMID:15364039
13. Kempton MJ, Geddes JR, Ettinger U, Williams SC, Grasby PM. Meta-analysis, database, and meta-regression of 98 structural imaging studies in bipolar disorder. JAMA Psychiatry. 2008; 65(9):1017–32. doi:10.1001/archpsyc.65.9.1017.
14. Arnone D, Cavanagh J, Gerber D, Lawrie SM, Ebmeier KP, McIntosh AM. Magnetic resonance imaging studies in bipolar disorder and schizophrenia: meta-analysis. British Journal of Psychiatry. 2009; 195 (3):194–201. Epub 2009/09/02. 195/3/194 [pii] doi:10.1192/bjp.bp.108.059717. PMID:19721106
15. Bora E, Fornito A, Yucel M, Pantelis C. Voxelwise meta-analysis of gray matter abnormalities in bipolar disorder. Biological Psychiatry. 2010; 67(11):1097–105. Epub 2010/03/23. doi:10.1016/j.biopsych. 2010.01.020. PMID:20303066
16. Ellison-Wright I, Bullmore E. Anatomy of bipolar disorder and schizophrenia: a meta-analysis. Schizo-phrenia Research. 2010; 117(1):1–12. Epub 2010/01/15. doi:10.1016/j.schres.2009.12.022. PMID: 20071149
17. Houenou J, Frommberger J, Carde S, Glasbrenner M, Diener C, Leboyer M, et al. Neuroimaging-based markers of bipolar disorder: evidence from two meta-analyses. Journal of Affective Disorders. 2011; 132(3):344–55. Epub 2011/04/08. doi:10.1016/j.jad.2011.03.016. PMID:21470688
18. Selvaraj S, Arnone D, Job D, Stanfield A, Farrow TF, Nugent AC, et al. Grey matter differences in bipo-lar disorder: a meta-analysis of voxel-based morphometry studies. Bipobipo-lar Disorders. 2012; 14(2):135– 45. Epub 2012/03/17. doi:10.1111/j.1399-5618.2012.01000.x. PMID:22420589
19. Beyer JL, Young R, Kuchibhatla M, Krishnan KR. Hyperintense MRI lesions in bipolar disorder: A meta-analysis and review. Int Rev Psychiatry. 2009; 21(4):394–409. Epub 2009/01/01. doi:10.1080/ 09540260902962198. PMID:20374153
20. Nortje G, Stein DJ, Radua J, Mataix-Cols D, Horn N. Systematic review and voxel-based meta-analysis of diffusion tensor imaging studies in bipolar disorder. Journal of Affective Disorders. 2013; 150(2):192– 200. doi:10.1016/j.jad.2013.05.034. PMID:23810479
21. Bearden CE, Hoffman KM, Cannon TD. The neuropsychology and neuroanatomy of bipolar affective disorder: a critical review. Bipolar Disorders. 2001; 3(3):106–50; discussion 51–3. PMID:11465675 22. Bruno SD, Papadopoulou K, Cercignani M, Cipolotti L, Ron MA. Structural brain correlates of IQ
changes in bipolar disorder. Psychological Medicine. 2006; 36(5):609–18. doi:10.1017/ S0033291706007112. PMID:16469198
23. Killgore WD, Rosso IM, Gruber SA, Yurgelun-Todd DA. Amygdala volume and verbal memory perfor-mance in schizophrenia and bipolar disorder. Cognitive and Behavioral Neurology. 2009; 22(1):28–37. doi:10.1097/WNN.0b013e318192cc67. PMID:19372768
24. Hartberg CB, Sundet K, Rimol LM, Haukvik UK, Lange EH, Nesvag R, et al. Brain cortical thickness and surface area correlates of neurocognitive performance in patients with schizophrenia, bipolar disor-der, and healthy adults. J Int Neuropsychol Soc. 2011; 17(6):1080–93. doi:10.1017/
S1355617711001081. PMID:22013998
25. Haldane M, Cunningham G, Androutsos C, Frangou S. Structural brain correlates of response inhibition in Bipolar Disorder I. Journal of Psychopharmacology. 2008; 22(2):138–43. doi:10.1177/
0269881107082955. PMID:18308812
26. Oertel-Knochel V, Reinke B, Alves G, Jurcoane A, Wenzler S, Prvulovic D, et al. Frontal white matter alterations are associated with executive cognitive function in euthymic bipolar patients. Journal of Affective Disorders. 2014; 155:223–33. doi:10.1016/j.jad.2013.11.004. PMID:24295601
27. Strakowski SM, Adler CM, Almeida J, Altshuler LL, Blumberg HP, Chang KD, et al. The functional neu-roanatomy of bipolar disorder: a consensus model. Bipolar Disorders. 2012; 14(4):313–25. doi:10. 1111/j.1399-5618.2012.01022.x. PubMed Central PMCID: PMC3874804. PMID:22631617 28. Kupferschmidt DA, Zakzanis KK. Toward a functional neuroanatomical signature of bipolar disorder:
quantitative evidence from the neuroimaging literature. Psychiatry Research. 2011; 193(2):71–9. Epub 2011/06/17. doi:10.1016/j.pscychresns.2011.02.011. PMID:21676596
29. Chen CH, Suckling J, Lennox BR, Ooi C, Bullmore ET. A quantitative meta-analysis of fMRI studies in bipolar disorder. Bipolar Disorders. 2011; 13(1):1–15. Epub 2011/02/16. doi:10.1111/j.1399-5618. 2011.00893.x. PMID:21320248
31. Oertel-Knochel V, Reinke B, Feddern R, Knake A, Knochel C, Prvulovic D, et al. Verbal episodic mem-ory deficits in remitted bipolar patients: a combined behavioural and fMRI study. Journal of Affective Disorders. 2013; 150(2):430–40. doi:10.1016/j.jad.2013.04.036. PMID:23764381
32. Oertel-Knochel V, Reinke B, Matura S, Prvulovic D, Linden DE, Ven VV. Functional connectivity pattern during rest within the episodic memory network in association with episodic memory performance in bipolar disorder. Psychiatry Research. 2014. doi:10.1016/j.pscychresns.2014.11.014.
33. Oertel-Knochel V, Reinke B, Feddern R, Knake A, Knochel C, Prvulovic D, et al. Episodic memory impairments in bipolar disorder are associated with functional and structural brain changes. Bipolar Dis-orders. 2014; 16(8):830–45. doi:10.1111/bdi.12241. PMID:25164120
34. Bonnin CM, Sanchez-Moreno J, Martinez-Aran A, Sole B, Reinares M, Rosa AR, et al. Subthreshold symptoms in bipolar disorder: impact on neurocognition, quality of life and disability. Journal of Affective Disorders. 2012; 136(3):650–9. doi:10.1016/j.jad.2011.10.012. PMID:22051075
35. Gildengers AG, Whyte EM, Drayer RA, Soreca I, Fagiolini A, Kilbourne AM, et al. Medical burden in late-life bipolar and major depressive disorders. Am J Geriatr Psychiatry. 2008; 16(3):194–200. doi:10. 1097/JGP.0b013e318157c5b1. PubMed Central PMCID: PMC2649793. PMID:18310550
36. Del Ser T, Gonzalez-Montalvo JI, Martinez-Espinosa S, Delgado-Villapalos C, Bermejo F. Estimation of premorbid intelligence in Spanish people with the Word Accentuation Test and its application to the diagnosis of dementia. Brain Cogn. 1997; 33(3):343–56. Epub 1997/04/01. doi:10.1006/brcg.1997. 0877. PMID:9126399
37. Nelson HE, Willis JR. The Revised National Adult Reading Test. Windsor, Berks, UK: NFER-Nelson; 1991.
38. Jastak S, Wilkinson GS. The Wide Range Achievement Test—Revised Administration Manual. Wil-mington. Del: Jastak Associates; 1984.
39. Gomar JJ, Ortiz-Gil J, McKenna PJ, Salvador R, Sans-Sansa B, Sarro S, et al. Validation of the Word Accentuation Test (TAP) as a means of estimating premorbid IQ in Spanish speakers. Schizophrenia Research. 2011; 128(1–3):175–6. Epub 2010/12/15. doi:10.1016/j.schres.2010.11.016. PMID: 21144711
40. Wilson BA, Cockburn J, Baddeley AD. The Rivermead Behavioural Memory Test (RBMT). Reading, UK: Thames Valley Test Co; 1985.
41. Wilson BA, Alderman N, Burgess PW, Emslie H, Evans JJ. Behavioural Assessment of the Dysexecu-tive Syndrome (BADS). Reading, UK: Thames Valley Test Co; 1996.
42. Lezak MD, Howieson DB, Loring DW, Hannay HJ, Fischer JS. Neuropsychological Assessment. 4th ed. New York: Oxford University Press; 2004. 1016 p.
43. Ashburner J, Friston KJ. Voxel-based morphometry—the methods. Neuroimage. 2000; 11(6 Pt 1):805– 21. Epub 2000/06/22. doi:10.1006/nimg.2000.0582S1053-8119(00)90582-2 [pii]. PMID:10860804 44. Good CD, Johnsrude IS, Ashburner J, Henson RN, Friston KJ, Frackowiak RS. A voxel-based
morpho-metric study of ageing in 465 normal adult human brains. Neuroimage. 2001; 14(1 Pt 1):21–36. Epub 2001/08/30. S1053-8119(01)90786-4 [pii] doi:10.1006/nimg.2001.0786. PMID:11525331
45. Smith SM. Fast robust automated brain extraction. Human Brain Mapping. 2002; 17(3):143–55. Epub 2002/10/23. doi:10.1002/hbm.10062. PMID:12391568
46. Jenkinson M, Smith S. A global optimisation method for robust affine registration of brain images. Medi-cal Image Analysis. 2001; 5(2):143–56. Epub 2001/08/23. S1361841501000366 [pii]. PMID:11516708 47. Jenkinson M, Bannister P, Brady M, Smith S. Improved optimization for the robust and accurate linear
registration and motion correction of brain images. Neuroimage. 2002; 17(2):825–41. Epub 2002/10/ 16. S1053811902911328 [pii]. PMID:12377157
48. Smith SM, Nichols TE. Threshold-free cluster enhancement: addressing problems of smoothing, threshold dependence and localisation in cluster inference. Neuroimage. 2009; 44(1):83–98. doi:10. 1016/j.neuroimage.2008.03.061. PMID:18501637
49. Gevins A, Cutillo B. Spatiotemporal dynamics of component processes in human working memory. Electroencephalogr Clin Neurophysiol. 1993; 87(3):128–43. PMID:7691540
50. Owen AM, McMillan KM, Laird AR, Bullmore E. N-back working memory paradigm: a meta-analysis of normative functional neuroimaging studies. Human Brain Mapping. 2005; 25(1):46–59. Epub 2005/04/ 23. doi:10.1002/hbm.20131. PMID:15846822
51. Glahn DC, Ragland JD, Abramoff A, Barrett J, Laird AR, Bearden CE, et al. Beyond hypofrontality: a quantitative meta-analysis of functional neuroimaging studies of working memory in schizophrenia. Human Brain Mapping. 2005; 25(1):60–9. Epub 2005/04/23. doi:10.1002/hbm.20138. PMID: 15846819
resonance imaging studies. Neuropsychobiology. 2013; 68(2):63–70. doi:10.1159/000352011. PMID: 23881005
53. Green DM, Swets JA. Signal Detection Theory and Psychophysics. New york, USA: Krieger; 1966.
54. Smith SM, Jenkinson M, Woolrich MW, Beckmann CF, Behrens TE, Johansen-Berg H, et al. Advances in functional and structural MR image analysis and implementation as FSL. Neuroimage. 2004; 23 Suppl 1:S208–19. Epub 2004/10/27. doi:10.1016/j.neuroimage.2004.07.051. PMID:15501092
55. Woolrich MW, Ripley BD, Brady M, Smith SM. Temporal autocorrelation in univariate linear modeling of FMRI data. Neuroimage. 2001; 14(6):1370–86. Epub 2001/11/15. doi:10.1006/nimg.2001.0931 S1053-8119(01)90931-0 [pii]. PMID:11707093
56. Beckmann CF, Jenkinson M, Woolrich MW, Behrens TE, Flitney DE, Devlin JT, et al. Applying FSL to the FIAC data: model-based and model-free analysis of voice and sentence repetition priming. Human Brain Mapping. 2006; 27(5):380–91. Epub 2006/03/28. doi:10.1002/hbm.20246. PubMed Central PMCID: PMC2653076. PMID:16565953
57. Beckmann CF, Jenkinson M, Smith SM. General multilevel linear modeling for group analysis in FMRI. Neuroimage. 2003; 20(2):1052–63. Epub 2003/10/22. doi:10.1016/S1053-8119(03)00435-X S105381190300435X [pii]. PMID:14568475
58. Worsley KJ. Statistical analysis of activation images. In: Jezzard P, Matthews PM, Smith SM, editors. Functional MRI: an introduction to methods. Oxford: Oxford University Press; 2001.
59. Woolrich MW, Behrens TE, Beckmann CF, Jenkinson M, Smith SM. Multilevel linear modelling for FMRI group analysis using Bayesian inference. Neuroimage. 2004; 21(4):1732–47. Epub 2004/03/31. doi:10.1016/j.neuroimage.2003.12.023S1053811903007894 [pii]. PMID:15050594
60. Ortiz-Gil J, Pomarol-Clotet E, Salvador R, Canales-Rodriguez EJ, Sarro S, Gomar JJ, et al. Neural cor-relates of cognitive impairment in schizophrenia. British Journal of Psychiatry. 2011; 199(3):202–10. doi:10.1192/bjp.bp.110.083600. PMID:21727234
61. Radua J, Canales-Rodriguez EJ, Pomarol-Clotet E, Salvador R. Validity of modulation and optimal set-tings for advanced voxel-based morphometry. Neuroimage. 2014; 86:81–90. doi:10.1016/j.
neuroimage.2013.07.084. PMID:23933042
62. Goodwin GM, Martinez-Aran A, Glahn DC, Vieta E. Cognitive impairment in bipolar disorder: neurode-velopment or neurodegeneration? An ECNP expert meeting report. Eur Neuropsychopharmacol. 2008; 18(11):787–93. doi:10.1016/j.euroneuro.2008.07.005. PMID:18725178
63. Lim CS, Baldessarini RJ, Vieta E, Yucel M, Bora E, Sim K. Longitudinal neuroimaging and neuropsy-chological changes in bipolar disorder patients: review of the evidence. Neuroscience and Biobehav-ioral Reviews. 2013; 37(3):418–35. doi:10.1016/j.neubiorev.2013.01.003. PMID:23318228
64. Elliott R. Executive functions and their disorders. Br Med Bull. 2003; 65:49–59. PMID:12697616 65. Blumenfeld RS, Ranganath C. Prefrontal cortex and long-term memory encoding: an integrative review
of findings from neuropsychology and neuroimaging. Neuroscientist. 2007; 13(3):280–91. doi:10.1177/ 1073858407299290. PMID:17519370
66. Fletcher PC, McKenna PJ, Frith CD, Grasby PM, Friston KJ, Dolan RJ. Brain activations in schizophre-nia during a graded memory task studied with functional neuroimaging. JAMA Psychiatry. 1998; 55 (11):1001–8. Epub 1998/11/18.
67. Weinberger DR, Egan MF, Bertolino A, Callicott JH, Mattay VS, Lipska BK, et al. Prefrontal neurons and the genetics of schizophrenia. Biological Psychiatry. 2001; 50(11):825–44. Epub 2001/12/18. S0006322301012525 [pii]. PMID:11743939
68. Callicott JH, Mattay VS, Verchinski BA, Marenco S, Egan MF, Weinberger DR. Complexity of prefrontal cortical dysfunction in schizophrenia: more than up or down. American Journal of Psychiatry. 2003; 160 (12):2209–15. Epub 2003/11/26. PMID:14638592
69. Tan HY, Callicott JH, Weinberger DR. Dysfunctional and compensatory prefrontal cortical systems, genes and the pathogenesis of schizophrenia. Cerebral Cortex. 2007; 17 Suppl 1:i171–81. Epub 2007/ 11/21. 17/suppl_1/i171 [pii] doi:10.1093/cercor/bhm069. PMID:17726000
70. Karlsgodt KH, Sanz J, van Erp TG, Bearden CE, Nuechterlein KH, Cannon TD. Re-evaluating dorsolat-eral prefrontal cortex activation during working memory in schizophrenia. Schizophrenia Research. 2009; 108(1–3):143–50. doi:10.1016/j.schres.2008.12.025. PubMed Central PMCID:
PMCPMC2671001. PMID:19196494
71. Calhoun VD, Maciejewski PK, Pearlson GD, Kiehl KA. Temporal lobe and "default" hemodynamic brain modes discriminate between schizophrenia and bipolar disorder. Human Brain Mapping. 2008; 29 (11):1265–75. doi:10.1002/hbm.20463. PubMed Central PMCID: PMC2665178. PMID:17894392
73. Fernandez-Corcuera P, Salvador R, Monte GC, Salvador Sarro S, Goikolea JM, Amann B, et al. Bipolar depressed patients show both failure to activate and failure to de-activate during performance of a working memory task. Journal of Affective Disorders. 2013; 148(2–3):170–8. doi:10.1016/j.jad.2012. 04.009. PMID:22854099
74. Allin MP, Marshall N, Schulze K, Walshe M, Hall MH, Picchioni M, et al. A functional MRI study of verbal fluency in adults with bipolar disorder and their unaffected relatives. Psychological Medicine. 2010; 40 (12):2025–35. Epub 2010/02/12. S0033291710000127 [pii] doi:10.1017/S0033291710000127. PMID: 20146832
75. Buckner RL, Andrews-Hanna JR, Schacter DL. The brain's default network: anatomy, function, and rel-evance to disease. Ann N Y Acad Sci. 2008; 1124:1–38. Epub 2008/04/11. 1124/1/1 [pii] doi:10.1196/ annals.1440.011. PMID:18400922
76. Vargas C, Lopez-Jaramillo C, Vieta E. A systematic literature review of resting state network— func-tional MRI in bipolar disorder. Journal of Affective Disorders. 2013; 150(3):727–35. doi:10.1016/j.jad. 2013.05.083. PMID:23830141