Received December 7th, 2011, Accepted for publication April 23th, 2012.
Copyright © 2012 Published by LPPM ITB,ISSN: 1978-3086, DOI: 10.5614/itbj.ict.2012.6.1.3
Dynamic Overlapping Clustering for Wireless Sensor
Networks Based-on Particle Swarm Optimization
Amin Suharjono1,2, Wirawan1& Gamantyo Hendrantoro1
1
Electrical Engineering Dept., Institut Teknologi Sepuluh Nopember (ITS) Surabaya 60111, Indonesia
2
Electrical Engineering Dept., Politeknik Negeri Semarang (POLINES) Semarang 50275, Indonesia
Email: [email protected]
Abstract. In the recent years, Wireless Sensor Network (WSN) has been one of the most interesting research topics because of its flexibility and many potential applications. However, in the applications, there are still resources constraints, including: energy, computation, and bandwidth. It is believed that clustering is the best solution for the need of energy efficiency and scalability. In order to reach the high level of energy efficiencies, mostly, the clustering algorithms avoid the possibility of overlap between clusters. But in fact, there are several applications that need the occurrence of overlaps between clusters. In this paper, we propose a Particle Swarm Optimization (PSO)-based Clustering algorithm that has capability to control the overlap between clusters but still it has an ability to reach energy efficiency. PSO is chosen because it has a light computation and can quickly reach convergence. This proposed algorithm performance is analytically and experimentally compared with clustering on LEACH. The result of the test shows that this proposed algorithm has a capability to control the rate of overlapping degree linearly. The testing on the PSO for clustering also shows the better performance than on LEACH, although there are a few problems related to its complexity.
Keywords: clustering; dynamic; energy-efficient; overlapping; PSO; WSN.
1
Introduction
In the last decade, Wireless Sensor Networks (WSN) has been attracting many researchers. It has been recognized a new means for various needs of application monitoring and data collections. The major advantages of WSN are its small dimension and that it doesn’t require wiring, either for data transmissions or powers [1]. Both factors make it flexible to be applied in any kind of environments.
data to the monitoring center [1]. In many applications, the large and dense population is needed to cover the extent area and increase the accuracy of the data retrieval. Scalability and energy-aware strategies are indispensable for this type of environment.
Many researchers have shown that a mechanism of grouping nodes, called clustering, which is performed dynamically, has a capacity to solve the scalability and energy efficiency problems in WSN. Clustering is an algorithm that command network to create cluster formation autonomously by choosing nodes that has role as a cluster-head (CH) and determine the member nodes that are affiliated to each CH. Clustering algorithm is run periodically to maintain the load balance among the nodes. It means that cluster formation is changed periodically so that the role as a CH is rotated alternately among all nodes.
Clustering algorithms has been proposed by many researchers. LEACH [2] is one of clustering algorithms for WSN that was proposed in earlier time and it has been a comparison for the next proposals. The goal of this algorithm is to increase the network lifetime by using signal strength as parameter in
determining the formation. The nature of LEACH algorithm is “distributed” in
which the algorithm is executed autonomously at each node. The LEACH’s proposal is followed by numbers of the next algorithm proposals, in which, each of them has its advantages and disadvantages. The more comprehensive review about clustering algorithm for WSN is described in paper [3].
For the sake of efficiency, in the most proposals of clustering algorithms, each node belongs only to one cluster. However, in several purposes and applications, several nodes in the network are required to affiliate to more than one cluster so the overlapping among clusters occurs. Several applications that require overlapping clusters are inter-cluster routing [4], node localization [5], and time synchronization protocols [6]. The overlapping is also required in order to obtain the modal parameter estimation more accurately in the system of Structural Health monitoring (SHM) [7].
Despite there have been many proposals for clustering algorithm, as far as we know, there is only one algorithm that specifically controls the overlapping between clusters, which is KOCA [8]. KOCA is a clustering algorithm that has capability to control overlapping clustering at certain level. Despite it is proved that KOCA has a good performance, it is still static. It means that the cluster
Moreover, most clustering algorithms are fully distributed, in which decisions are made independently by each node based on the knowledge of the condition itself and the condition of the surrounding nodes. In terms of data processing load, the distributed strategy will result in a very lightweight computation, thus it would be very suitable for WSN. However, the major disadvantage of distributed algorithm is that it is difficult to achieve optimal conditions because
it uses limited information and doesn’t make use of the optimization algorithms
that are commonly used.
Several researchers has tried to apply some optimization techniques in clustering algorithms, such as LEACH-C, the centralized version of LEACH who uses simulated annealing (SA) optimization [2], and Tabu Search based Clustering [9],[10]. The uses of SA, Tabu Search, or other Heuristic Optimization in solving the clustering problem are based on the fact that clustering problem is an NP-hard problem that is very difficult to resolve mathematically. Optimization-based clustering is able to produce better performance than non-optimized. However, the optimization-based algorithm is a high computational process that requires amount of large energy resources and processing. Commonly, the optimization-based clustering algorithm is centralized because the algorithm is placed in the center, base-station (BS), which is not limited in resources.
Centralized strategy requires the transmission of information about the current state of each node to BS. It means that there is some additional information must be transmitted beyond the sensing data. If the BS is far from the network, another effect that emerges was the delay due to the transmission. To overcome this problem, it is crucial to select the lightweight optimization method to run at the node level of WSN.
The work presented in this paper has three contributions:
1. We propose the energy efficient PSO-based Clustering algorithm with the ability to control the level of overlap between clusters.
Overlapping control mechanism that we propose is based on the threshold value of the distances comparison between the nodes to the main CH and the nodes to the secondary CH(s). The performance of O-PSO clustering algorithm is also shown in this paper using simulation and compared with O-LEACH [14].
2. We analyze the influence of PSO parameter in solving the problem of clustering.
The parameters of PSO investigated here include: the influence of particles and iterations number on the solution accuracy, the influence of particles number of the initial data on the speed of convergence, the effect of iterations and the particles number on the energy efficiency. In this paper, we will also show the evaluations of the cluster formations produced, including the distributions of cluster members and cluster width.
3. We analyze mathematically the influence of the clusters uniformity on the energy consumption.
This analysis will correlate with the evaluation result PSO parameters as stated in the contribution number 2.
Furthermore, this paper is systematically arranged as follows: Chapter 2 explains about the formulation of clustering problem and the solution using PSO; Chapter 3 explains in detail about algorithm O-PSO clustering as we proposed. Chapter 4 shows the simulation results and the analysis. At last, Chapter 5 resumes our conclusion about of the work.
2
Clustering Problem on WSN and Its Solution Using PSO
2.1
Energy Model
Commonly used in many papers, for example [2], energy consumption model in WSN used here has three parts, they are:
1. For sending an l-bit message with distance d, a node require energy
( , ) = . + .�
2 < 0
. + .� 4
0
(1)
2. For receiving an l-bit message, a node require energy
= . (2)
3. Energy for data aggregation is
Based on this model, Yan Jin et.al. [15] proposed a lemma about when a clustered network consume a fewer energy than a network without clustering. They claimed that clustering will be more efficient in energy consumption than direct transmission when a formation filled with the following condition [15]:
� < 0
� 4
0
(3)
where D is the distance from CH to BS and R is the cluster radius. Assume the data is ideally aggregated and the energy for the aggregation process is ignored.
2.2
Impact of Clustering Uniformity on Energy Efficiency of
WSN
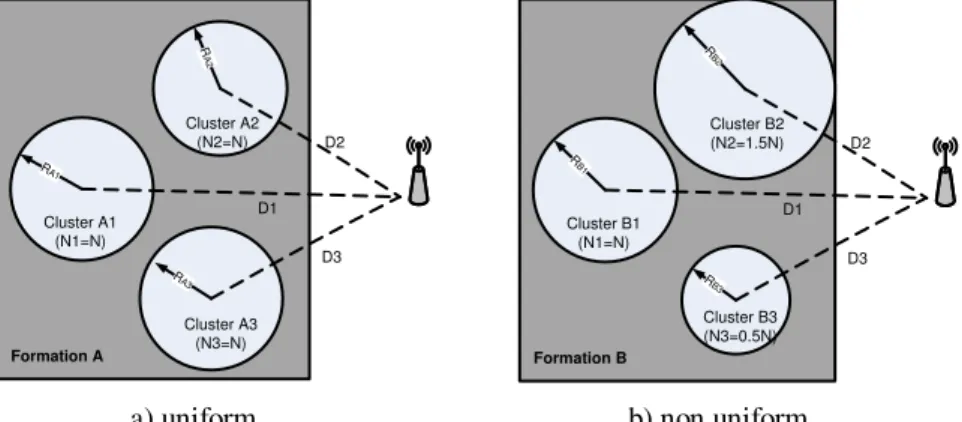
Using energy model in [2] and by using the same assumption with in [15], the following exposure contains analysis that we are proposing in order to prove that a network with more uniform cluster formation will be more energy efficient than with the less uniform. The uniformity that is meant here is the similarity in the number of the cluster members in one formation. We conduct this analysis to prove our hypothesis that within the fairly member number, the load of each CH will considerably similar. Thus, there is no CH which gets the heavier load than other, which can result on the energy left-out more quickly.
Formation A
Cluster A1 (N1=N)
Cluster A2 (N2=N)
Cluster A3 (N3=N)
D2
D1
D3
R
A2
RA1
R
A3
Formation B
Cluster B1 (N1=N)
Cluster B2 (N2=1.5N)
Cluster B3 (N3=0.5N)
D2
D1
D3
RB
2
R
B1
R
B3
a) uniform b) non uniform
= (2� −1) + � 4+ (� −1) �
2
2 (4)
If node is deployed in the sensing area uniformly, the number of node in an area could be analogous to the wide of the area, therefore
� ≈ 2 (5)
The influence of cluster uniformity on energy consumption can be analyzed by comparing two different networks in the cluster uniformity, as illustrated at Figure 1.
Total energy consumed by formation A is
= 1+ 2+ 3 (6)
Based on Eq. (4), therefore
= 3(2� −1) + 3=1 � 4+ 3(� −1)� 2
2 (7)
For formation B where�2= 1.5�1= 1.5�, and �3= 0.5�1 = 0.5� and with the reference to Eq. (5), we can calculate the radius square of the cluster
B1, B2, and B3 respectively are 2, 1.5 2 and 0.5 2. Therefore, the total energy for formation B is
Figure 1 Two clusters formation with different uniformity.
= 1+ 2+ 3 (8)
= (2� −1)(3� −1)(� −1) +
� 4
3
=1 + (� −1) � 2
2 3
=1 (9)
(� −1)� 2
2 + (1.5� −1) � 1.5 2
2 +
(0.5� −1) � 0.5 2
2 (10)
= 3 2� −1 + 3=1 � 4+
(� −1) + 1.5(1.5� −1)� + 0.5(0.5� −1) � 2
2 (11)
= 3(2� −1) + 3=1 � 4+
� −1 + 2.25� −1.5 + 0.25� −0.5 � 2
2 (12)
= 3(2� −1) + 3=1 � 4+ 3.5� −3 �
2
2 (13)
From Eqs. (7) and (13), we can calculate that the difference of energy consumption between formation B and formation A is
− = 3(2� −1) + 3=1 � 4+ 3.5� −3 � 2
2 −
3(2� −1) + 3=1 � 4+ 3(� −1) �
2
2 (14)
− = 3.5� −3 −3(� −1) �
2
2 = 0.5� � 2
2 (15)
− = 0.5� �
2
2 (16)
With N and R are always positive, then in Eq. (15) will always be bigger than , thus we can conclude that, with cluster that are not uniform, formation B will always consume more energy than formation A does with uniform cluster.
2.3
Optimization Problem Formulation for WSN Clustering
If the number of clusters is determined at the beginning to make � fixed, Eqs. (3) and (4) would generate a condition in which the amount of energy consumption is only determined by the distance of variable d. Both equations also shows that if ≫ �, then �≫ �. This condition shows
that the nodes’ role rotation as CH is very crucial to avoid imbalance in energy consumptions among nodes.
Based on this condition, the formulation of clustering optimization problem can be defined as follows [12]
=�× 1+ 1− � × 2 (17)
with 1is the maximum average Euclidean distance of nodes to their associated cluster heads and 2 is ratio of total initial energy of all nodes in the network with the total energy of the CH candidates in current round. Both sub-functions are proportionally combined with weighting factor �. Function 1can be calculated using following formula:
1= =1,2,…,�
( , � )
∀ ∈ (18)
where K is predetermined cluster number, is the member of kth cluster, � is the cluster-head of kth cluster, and d(x,y) is Euclidean distance between x and
y. The second objective function can be formulated as follows:
2=
( )
�
=1 ( � )
�
=1
(19)
where ( ) and ( � ) is residual energy of node i and cluster-head k
respectively.
The problem uses the same assumptions those used in [2], that is: every node has the same probability to be a CH, every node can reach all other nodes and the BS, there is no communication interference between nodes and it is held randomly in 2D field, in which the location coordinate of each node is identified.
2.4
Finding Solution for Clustering Problem Using PSO
To address the problems in sub-chapter 2.3, we can use heuristic algorithms. One of them is Particle Swarm Optimization (PSO). Initially proposed by James Kennedy and Russell C. Eberhart [16], PSO is a population-based search algorithm, inspired by a social behavior of birds group.
There are some basic principles of PSO: firstly, PSO chooses S sets of solution candidates called as particles. Then, iteratively, each particle is moved to a new position with any particular velocity. Consider xi is a position vector for particle
i and vi is a velocity for particle i. Each particle will be evaluated with an
objective function f(x). In the case of minimization problem, we state that a particle is closer to the global solution if it can produce f(x) smaller than the other particles do. Velocity and position at iteration k is updated using Eqs. (20) and (21) and repeated until they reach a certain gbest value or have
START
Define the extending received power (dx)
Measure the CHs power received in a node
Sort the CHs based-on the smallest distance to the node
CHcurrent = nth nearest CH
Node join to CHcurrent
d_CHn / d_CH1<X%
STOP
Y
N A
A
n = 1
n = n + 1
Y
( ) = . ( −1) + 1 1( )( − ) +
2 2( )( − ) (20)
and
( ) = ( −1) + ( ) (21)
with w is inertia weight, 1 and 2 is learning factor constants, and 1and 2 is random numbers uniformly distributed in [0,1].
Figure 2 Flow chart of overlapping control mechanism.
In clustering problem, a particle consists of a set of node coordinate, nominated as CH candidate. Each particle is evaluated using objective function (7) until (9) for any iteration. If the formation of a particle in any iteration produces an f
value bigger than the previous iterations values, therefore this formation will be saved as pbest. In any iteration, pbest of all particles are compared with each other
to choose which particle producing the lowest f value, to be selected as the
gbest. Variable of pbest and gbest is used to update the position and velocity of
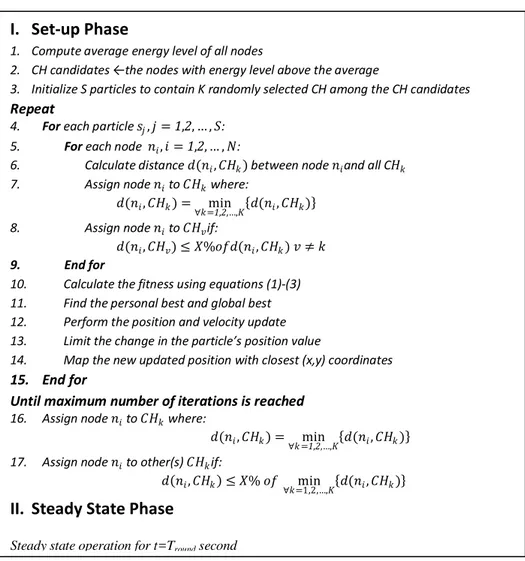
Figure 3 Pseudo code of O-PSO clustering.
3
Proposed Overlapping Clustering Algorithm Using PSO
In an energy efficient clustering algorithm, a non-CH node will choose to join a
CH which has the closest position to it’s after a set of CH has been decided.
Provided that it is with the assumption that the channel characteristics between nodes are same so that the amount of energy used for data transmission is only determined by the distance. The same are also conducted in our proposed algorithm. A node will join to the closest CH candidate offered by a particle. A CH where a node first affiliated is called as primary CH.
( , � ) =∀ =min
1,2,…,� ( , � )
( , �) �% ( , �) ≠
( , �) =∀ =min
1,2,…,� ( , � )
, � �% min
∀ =1,2,…,� ( , � )
I.
Set-up Phase
1. Compute average energy level of all nodes
2. CH a didates ←the odes ith e ergy le el a o e the a erage
3. Initialize S particles to contain K randomly selected CH among the CH candidates
Repeat
4. For each particle , =1,2,…, : 5. For each node , =1,2,…,�:
6. Calculate distance ( , �) between node and all C�
7. Assign node to � where:
8. Assign node to � if:
9. End for
10. Calculate the fitness using equations (1)-(3) 11. Find the personal best and global best 12. Perform the position and velocity update 13. Li it the ha ge i the parti le’s positio alue
14. Map the new updated position with closest (x,y) coordinates
15. End for
Until maximum number of iterations is reached
16. Assign node to � where:
17. Assign node to other(s) � if:
II.
Steady State Phase
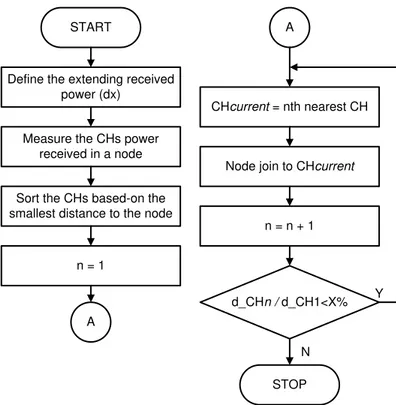
Then, the node will join to other CH as a secondary CH as long as it is at a distance that is not farther than the threshold limit. A threshold value is calculated relatively to the node distance, in which the main CH is expressed in X%. The determination mechanism of primary and Secondary CH that produces overlapping between clusters is shown in detail at Figure 2. Then, the mechanism at Figure 2 is combined with the PSO-based clustering algorithm proposed in [7] to form a new algorithm which we refer as PSO-based Overlapping Clustering (O-PSO Clustering) Algorithm. Pseudo-code O-PSO Clustering is shown at Figure 3.
4
Simulation Results and Analysis
In this paper, the performance of clustering algorithm in energy efficiency is expressed as the number of the live nodes (Nlive) in each round. We state that a
node will be dead if the battery is empty (remaining energy = 0 Joule). This rule is usually used in WSN papers. The performance of energy efficiency of PSO-C is shown in the graphic and compared with the performances of LEACH and non-clustering. Meanwhile, the performance of O-PSO Clustering is evaluated for five variations of X value targets and compared with Overlapping LEACH (O-LEACH) [14].
4.1
Experimental Setup
The use of LEACH and O-LEACH as the comparisons is based on the consideration that the assumptions used on O-PSO are same with the assumptions used on LEACH, it is beyond the fact that LEACH is very often used as comparison in clustering papers. Evaluations for both algorithms are performed by using Matlab simulation, in which we hold 100 nodes randomly in the area of 100m x 100m, as shown at Figure 4a.The life-time performance will be analyzed based on the uniformity the clusters on their number of members. The distribution of cluster is shown in the form of histogram for the first 30 rounds with the consideration that it is ensured there were no deadnodes in the round.
Especially for the testing on PSO optimization performance for clustering, we set the value of �=1, thus PSO just looks the cluster formation that produces minimal cluster diameter. Due to this requirement, we use deployment deterministic, as shown at Figure 3b, in which the cluster formation could be
a) Random deployment (100 nodes uniformly deployed on 100m x 100m area)
b) Deterministic deployment(36 nodes deployed on 100m x 100m area)
Figure 4 Node deployment (BS not be displayed).
0 10 20 30 40 50 60 70 80 90 100
0 10 20 30 40 50 60 70 80 90 100
0 10 20 30 40 50 60 70 80 90 100
0 50 100 150 200 250 300 350 400 450 500 0
20 40 60 80 100
Rounds
J
u
m
la
h
N
o
d
e
H
id
u
p
PSO LEACH No cluster
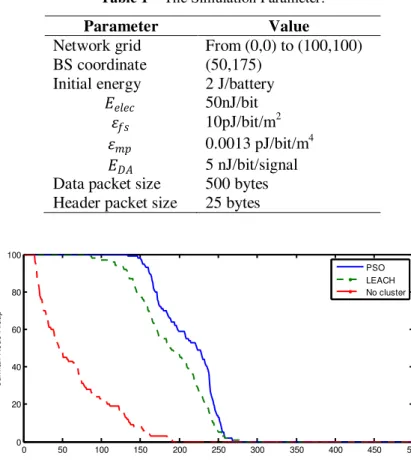
Table 1 The Simulation Parameter.
Parameter Value
Network grid From (0,0) to (100,100) BS coordinate (50,175)
Initial energy 2 J/battery 50nJ/bit
� 10pJ/bit/m2
� 0.0013 pJ/bit/m4
5 nJ/bit/signal Data packet size 500 bytes Header packet size 25 bytes
Figure 5 Lifetime performance of PSO-C compared to LEACH and no-clustering.
4.2
Evaluation of PSO on Solving Clustering Problem
The performance of PSO-C’ energy efficiency compared with LEACH and non -clustering is shown at Figure 5. The figure shows two phenomena. Firstly, the clustered formation, either with PSO-C or LEACH, produces better performance than with the Non-clustering. Secondly, PSO-C has the better performance in energy consumption than LEACH. Both phenomena can be explained in following description.
If the position of BS is far from CH, then clustering would consume less energy than non-clustering, as stated in Eq. (3). In this testing, we put BS at coordinate (50,175). By holding nodes in the field between (0,0) and (100,100), then the closest coordinate to BS is coordinate position of (50,100), that it is 75 in range from BS. Given the value of = 50nJ/bit, � = 10 pJ/bit/m2, and � =
� = 50−9 10−12 = 70.71 75 (22)
� 4
= 4 50−9 0.013.10−12 = 29.62 75 (23)
From the calculation (22) and (23), we can see that the distance CH-BS, D, on this deployment has fulfilled the minimal requirement in Eq. (3).
The second phenomenon that the PSO-C is more efficient in energy consumption than LEACH can be analyzed based on the uniformity property of their clusters. Figure 6 shows that the picture of cluster distribution on PSO-C is narrower than on LEACH. It means that PSO-C is more uniform than LEACH. This condition is suitable with sub-chapter 2.2, which states that a network with the more uniform clusters will consume less energy than the network with non-uniform clusters.
0 10 20 30 40 50 60 70 80 90 100
0 2 4 6 8 10 12 14 16 18
20 Cluster Member Distribution of PSO-C
Number of Nodes/cluster)
nu
m
be
r o
f c
lus
te
rs
mean = 20,00
deviation standard = 5,77
a) Cluster member distribution of PSO-Clustering
0 10 20 30 40 50 60 70 80 90 100
0 2 4 6 8 10 12 14 16 18 20
Cluster Member Distribution of LEACH
Number of Nodes/Cluster
Nu
m
be
r o
f C
lus
te
rs
mean = 8,33
deviation standard = 13,59
b) Cluster member distribution of LEACH
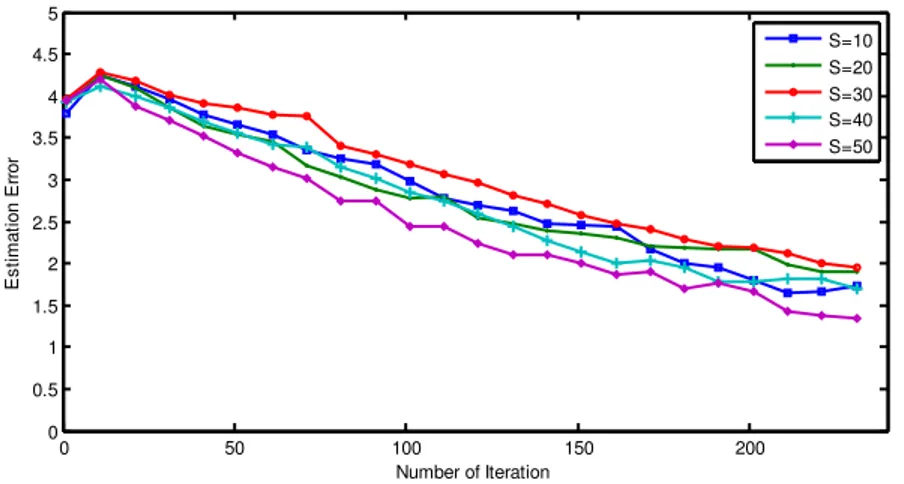
The next evaluation is investigating the influence of particle number on the search errors, namely the difference between the solutions offered with the ideal solution. Figure 7 shows that each additional 10 particles would reduce the error estimation of CH location approximately 0.25 meters or cut about 10 iterations to reach convergence.
Figure 7 Impact of particle number to error estimation of CH position.
Another PSO parameter also evaluated is about the influence of particle initial quality. Figure 8 shows that the initial value is very influencing on the number of iterations required to achieve convergence especially for a small number of particles.
Figure 8 Impact of initial particle quality to convergence time.
0 50 100 150 200
0 0.5 1 1.5 2 2.5 3 3.5 4 4.5 5
Number of Iteration
E
s
ti
m
a
ti
o
n
E
rr
o
r
S=10 S=20 S=30 S=40 S=50
10 15 20 25 30 35 40 45 50
150 160 170 180 190 200 210 220 230 240 250
Number of particles
N
um
be
r
of
I
te
ra
tio
ns
Complexity is one of evaluations that are also important in testing an algorithm. The very simple way to measure the complexity of an algorithm is by measuring the time needed to run the algorithm. Figure 9 showed that the execution time of PSO-C is around a thousand times longer than LEACH. The figure showed that the number of iterations and particles will significantly increase the execution time.
a) LEACH
b) PSO with different Iteration Number
c) PSO with Different Particles Number
Figure 9 Execution time of the algorithm.
0 10 20 30 40 50 60 70 80
0 0.002 0.004 0.006 0.008 0.01
Rounds
Ti
m
e
(
s
)
Execution Time of LEACH
0 10 20 30 40 50 60 70 80
0.2 0.25 0.3 0.35
Rounds
Ti
m
e
(s
)
Execution Time of PSO with Different Iteration Number
N-iter=30 N-iter=50
0 10 20 30 40 50 60 70 80
0 0.2 0.4 0.6 0.8 1
Rounds
Ti
m
e
(
s
)
Time Execution of PSO with Different Particles Number
4.3
Evaluation of Overlapping PSO Clustering
The first performance indicator of O-PSO Clustering will be evaluated is the average of overlapping degree (OD). OD is the number of joint member nodes of two adjacent clusters. Figure 10 shows that the O-PSO clustering and O-LEACH produce an average OD value that rises linearly to the value. This phenomenon shows that the functions of OD control are working well for both algorithms. O-PSO has a greater slope than O-LEACH, which means that within the same X value, O-PSO is more efficient because it is able to achieve the greater OD average.
Figure 10 Overlapping degree (OD) of O-PSO compared to O-LEACH.
Figure 11 Network lifetime of O-PSO clustering.
1 1.1 1.2 1.3 1.4 1.5 1.6 1.7 1.8
0 2 4 6 8 10 12 14
Extending cluster diameter
A v e ra g e N o d e D e g re e O-PSO O-LEACH
50 100 150 200 250 300
Figure 12 Network lifetime of O-LEACH.
Figure 13 Network lifetime comparison:O-PSO vs O-LEACH.
The final evaluation is to test the influences of overlapping level on energy efficiency. The result of the testing on O-PSO and O-LEACH is shown at Figure 11 and Figure 12. From both figures, we can see that the time period spent for a node to die for the first time decreases less than 10 rounds for each 20% increase of X. It is understandable because several nodes is compelled to transmit messages to more than one CH. Figure 13 shows the comparison of performances between O-PSO and O-LEACH. The Figure shows that O-PSO is
able to hold network’s lifetime longer than O-PSO. It will happen continuously until the number of the live nodes reaching 50% of the original state.
50 100 150 200 250 300
0 10 20 30 40 50 60 70 80 90 100 Round N u m b e r o f A liv e N o d e O-LEACH dx=1.0 dx=1.2 dx=1.4 dx=1.6 dx=1.8
0 50 100 150 200 250 300
5
Conclusion
This paper explains about a new proposal of PSO-based clustering for WSN that has a capability to control the level of overlapping between clusters, but still concerns on the energy efficiency level. This paper also shows the mathematical analysis about the influences of cluster uniformity on the level of energy consumption. The testing on this proposed algorithm shows the better performance than on LEACH. At the same parameter of threshold X, the O-PSO Clustering has capability to create the greater average of the overlapping level. O-PSO is also capable to keep the lower energy consumption. This paper also shows that PSO is very potential to be applied as a problem solving for clustering, despite there are still some problems to be solved, especially related to the algorithm complexities.
Acknowledgement
This research is carried out with the financial support of BPPS Scholarship from Indonesia Ministry of National Education. Some of the results of this paper have been presented in 2011 IEEE Region 10 Conference (TENCON 2011).
References
[1] Akyildiz, I.F., Su, W., Sankarasubramaniam, Y., Cayirci, E., A Survey on Sensor Networks, IEEE Communications Magazine, 40 (8), pp. 104–112, 2002.
[2] Heinzelman, W.B., Chandrakasan, A.P., Balakrishnan, H., Application Specific Protocol Architecture for Wireless Microsensor Networks, IEEE Transactions on Wireless Communciations, 1(4), pp. 660-670, 2002. [3] Abbasi, A.A., Younis, M., A Survey on Clustering Algorithms for
Wireless Sensor Networks, Journal of Computer Communications, 30(13), pp. 2826-2841, 2007.
[4] Krishna, P., Vaidya, N.H., Chatterjee, M.& Pradhan, D.K., A Cluster-based Approach for Routing in Dynamic Networks, ACM SIGCOMM Computer Comm. Rev., 1997.
[5] Youssef, SALAM: A Scalable Anchor-Free Localization Algorithm for Wireless Sensor Networks, PhD dissertation, Computer Science Dept., Univ. of Maryland, 2006.
[6] Wu, T. & Biswas, S.K., A Self-Reorganizing Slot Allocation Protocol for Multi-Cluster Sensor Networks, Proc. Fourth Int’l Conf. Information
Processing in Sensor Networks (IPSN ’05), pp. 309-316, Apr. 2005. [7] Sim, S.H., Spencer, B.F., Jr., Zhang, M. & Xie, H.,Automated
[8] Youssef, Moustafa A., Youssef, Adel & Younis, Mohamed F.,
Overlapping Multihop Clustering for Wireless Sensor Networks, IEEE Transactions on Parallel and Distributed Systems, 20(12), December 2009.
[9] Rhazi, A.E., Pierre, S., A Tabu Search Algorithm for Cluster Building in Wireless Sensor Networks, IEEE Transaction on Mobile Computing, 8(4), pp. 433-444, 2009.
[10] Chamam, Ali, Pierre, S., On the Planning of Wireless Sensor Networks: Energy Efficient Clustering under Joint Routing and Coverage Constraints, IEEE Transaction on Mobile Computing, 8 (8), pp. 1077-1086, 2009.
[11] Kulkarni, R.V., Venayagamoorthy, G.K., Particle Swarm Optimization in Wireless Sensor Networks: A Brief Survey, IEEE Transaction on Systems, Man, and Cybernetics, Part C: Applications and Reviews, 41(2), pp. 262-267, 2011.
[12] Latiff, N.M., Tsimenidis, C.C., Sharif, B.S., Energy-aware Clustering for Wireless Sensor Networks using Particle Swarm Optimization, The 18th AnnualIEEE International Symposium on Personal, Indoor, and Mobile
Radio Communications (PIMRC’07), Athens, 2007.
[13] Latiff, N.M., Tsimenidis, C.C., Sharif, B.S., Dynamic Clustering using Binary Multi-Objective Particle Swarm Optimization for Wireless Sensor Networks,IEEE International Conference on Mobile Adhoc and Sensor Systems (MASS 2007), Pisa, 2007.
[14] Suharjono, Amin, Wirawan, Hendrantoro, Gamantyo, Dynamic Overlapping Clustering Algorithm for Wireless Sensor Networks, 2011 International Conference on Electrical Engineering and Informatics, Bandung, Indonesia, 17-19 July 2011.
[15] Jin, Yan, Wang, Ling, Kim, Y. & Yang, X., EEMC: A Energy-Efficient Multi-Level Clustering Algorithm for Large-Scale Wireless Sensor Networks, Computer Networks, 52(3), pp. 542-562,