in South Asian Countries
Muhammad IRFAN1 Yasir MAJEED2 Khalid ZAMAN3
ABSTRACT
The objective of this study is to estimate and analyze the Islamic banks efficiency in South Asian Countries. The study sample consists of four countries i.e. Pakistan, Iran, Brunei and Bangladesh for being similar legal, social and economic framework for Islamic banking systems. Stochastic frontier approach is used to estimate the performance through input and output method for the period of 2004 to 2011. Results demonstrate that Islamic banking is efficient about 98.19% with respect to return on asset ratio; with respect to return on equity ratio is about 91.4% and 77.03% with respect to net profit ratio. As per the efficiency-ranking measurement, Brunei stands at top followed by Pakistan, Iran and Bangladesh among the South Asian countries.
KEYWORDS: Bank’s performance indicators, Islamic Banks, Stochastic frontier analysis, South Asian Countries.
JEL CLASSIFICATION: G21
INTRODUCTION
The Islamic banking is emerging industry not in the Muslim countries but also in Non Muslim countries of the world. The working of Islamic banking practice Islamic principles, which eliminate the element of uncertainty and exploitation, therefore its growth and performance is better than conventional banking system. The success and survival of conventional banking needs innovation and invention in its product and services. It would be difficult for a conventional bank to retain or increase the customers in a competitive market without improvement in product and services otherwise the growth become stagnant or fall in long run (Ahmed & Hasan, 2007). The Islamic banking systems developed on Islamic principles and its success depend on Islamic values not on innovations. The Islamic or interest free banking is facing challenges in a manner that how to implement the Islamic principles where world now become as global village. The Islamic banking is in its infant stage and face serious problems to practice Islamic laws as proper interbank money market is not available for regulatory framework for interest free banking.
1Department of Management Sciences, COMSATS Institute of Information Technology, Abbottabad, 20060, Pakistan
2 Department of Management Sciences, University of Lahore, Islamabad, Pakistan.
It is very difficult to say when Islamic banking systems have started its operation. The Islamic financial transactions exist after the spread of Islam in 14th century ago, but no institutions perform or work at that time as bank. Muslims practice Islamic financial modes like "Mudarba", "Musharka", "Murabha", "Ijara" etc on individual basis. Since the introduction of conventional banking system in eighteen centaury, a thrust arises among Muslims for Islamic banking contrary to conventional banking because of faith (Khan, 1986). Today, Islamic banking is also successful in Non Muslim countries and many countries like United State of America, United Kingdom and Europe has opened Islamic banks and windows in conventional bank (Garas, 2007).
1.1. Objective of the Study
The common people and businesspersons due to lack of knowledge assumed that Islamic banks offer and practice only mortgage finance (Ijara). Therefore, the objective of this study is to analyze the performance of different Islamic modes and efficiency of the Islamic Banks in the south Asian countries.
1.2. Scope and Limitation
The purpose of the study is to investigate and evaluate the performance and efficiency of Islamic banks operating in South Asian countries. Due to non-existence of Islamic Banks and availability of data (few observations), the study area consist of four countries in south Asia i.e. Pakistan, Iran, Bangladesh and Brunei.
The study organizes in the following way, literature reviews followed by methodology and results discussion. Conclusion and recommendation is at end.
2. LITERATURE REVIEW
The banking share (investment) in the market increases by 15% per annum in the world in last decade (Moody's, 2008). The rationale behind the growth of Islamic banking is the element of interest free system (Khan, 1986; Khan & Mirakhor, 1987; Dar, 2003). The nature of Islamic Banking is different from traditional (conventional) banking but Islamic banks have moderate impact on Business sector because Islamic banks follow the systems that are resembles to traditional system and governed by State Bank (Stefflar & Cornilisse, 1995).
Garas (2007) explores that Islamic financial institution facing two types of challenges i.e. internal and external. The internal challenge is to involve those customers who are using conventional banking products whereas external challenge is to fulfill the international transaction requirements due to lack of Islamic regulatory system. To penetrate in international market and increase local potential customers the shariah knowledge and training is required to communicate Islamic product. The application of shariah principles and implication of Islamic products analyze through collaborative research from Shariah scholars and researcher (El-Din & Abdullah, 2007). Whereas, Khan (1986) suggests that Islamic banking utilize the expertise of shariah scholars to judge the shariah compatible problems for financing local and international business.
"Ajjara-is-Iatana", a legal framework is required to implement. The study of Samad et al. (2005) compare the Islamic and non Islamic products in Malaysia and Bahrain. They find that legal framework is required to finance economic activities and payment of "Zakat" according to Shariah principles. Hameed and Bashir (2003) explore the determinants of profitability of the Islamic banking and reveal that profitability has correlation with all sources of funds. They find that Islamic financial products affected by the interest rate and inflation but no significant diversification occurred in earning of Islamic banks. However, the future progress of the Islamic banking may be distorted by the inappropriate protection policy. Ahmed (2007) conducts research in Bangladesh about the performance and regulations of Islamic Banking. He finds that deficiency in the regulatory framework for proper functioning is not according to Shariah rules. The performance of Islamic banking is also affected by the lack of interbank money market and legal requirements of reserve. He suggest that independent banking act should be constituted in Bangladesh for guidance, supervision, control, practice and operations of Islamic banking to provide legal support to the stakeholders.
Stefflar and Cornilisse, (1995) study the comparative analyses of process of privatization and Islamization of bank. They find that banks remain stable in the initial phases of Islamization but their effectiveness is less because Islamic banks bring no change in its product as per the market requirement. Kahf (2002) find that conventional banking is appreciating Islamic banking and Islamic banking is entering into the stream but growth and survival depends on the generation of assets and size of capital. Karbhari et al. (2004) find that the problems face by Islamic Bank in UK for success are the heterogeneous client, lack of expert staff and competition from the conventional banks.
The performance of Islamic banks can be measure through financial ratios. Saleh and Zeitun (2006) use profitability, liquidity, efficiency and solvency ratios to measure the performance of Jordan Islamic Bank for Finance and Investment (JIBFI) and Islamic International Arab Bank (IIAB) in Jordan. They find that profitability of banks increases due to financing short-term ventures. Samad (2004) examines the performance of the interest-free Islamic banks and the interest-based conventional commercial banks for the post Gulf War period of 1990- 2001 in Bahrain. He conclude that there is no major difference between the two sets of banks in terms of profitability and liquidity performances but there is a significant difference in credit performance. The Interest free bank's credit performances are more than non-interest free bank. Kader et al. (2007) compare the performance of Islamic and conventional banks in United Arab Emirates. They examine the balance sheets and income statements of three Islamic banks and five conventional banks for the period 2000 to 2004. The results show that Islamic banks are more profitable, less risky and more efficient than conventional banks. They conclude that the Saving profit and loss (SPL) principle is the main reason for the rapid growth of Islamic banks.
industry (Islamic banks and Islamic windows) increases during the period of study while conventional banks remain stable. On the other hand, the competence level of Islamic banks is lower than the conventional banks due to limited products. The results further reveal that Islamic banks are more competent than Islamic windows of conventional bank.
The literature on efficiency and performance of Islamic Banking in different parts of the world revealed that it is less risky, more efficient and stable than conventional banking system. The current study extends the literature not only the estimation of efficiency but also the comparison of Islamic banking in South Asian countries.
3. DATA SOURCE AND METHODOLOGICAL FRAMEWORK
3.1. Research Design
The objective of the study is to evaluate the efficiency and performance of banks of south Asian countries. There are seven countries in south Asia but Islamic banks are functioning in five countries i.e. Pakistan, Iran, Brunei, Sri Lanka and Bangladesh. The study excludes the Islamic banks of Sri Lanka due to less no of observation as it starts its operation in 2011. The study sample consists of four countries i.e. Pakistan, Iran, Brunei and Bangladesh as the Islamic banking system in these countries have similar legal, social and economic framework. The sample period is 8 years i.e. from 2004 to 20011. The study is panel study with 4 countries, 7 banks and 8 years.
3.2. Methodology
The objective is to maximize the value of the shareholder equity by increasing the profitability of banks. Therefore, a comprehensive plan has been designed for identifying objectives, goals and strategies. The internal and external competitive factors that affect the performance dimensions are becoming a critical factor in evaluating performance. The performance through internal factors can easily judged through profitability ratios, which reflect that how much management planning and strategy is aligned with objective. is internal factor
The researchers like Samad (1999), Al-jarrah and Moulyneux (2003), Hussein (2004) and Yudistira (2004) use financial, and management ratios for measuring the performance and efficiency of banks through parametric and non-parametric methods. The parametric approach for measuring efficiency has three methods i.e. The Stochastic Frontier Analysis (SFA), Thick Frontier Approach (TFA) and Distribution Free Approach (DFA). The frontier function is in Cobb-Douglas form and assumes constant elasticity of substitution in inputs. The study use SFA as it is less responsive to errors and outliers. The study use profitability ratios and liquidity ratios to measure the bank performance, as these ratios is used by Patnam (1983), Sabi (1996), Samad (1999) and Saleh and Zeitun (2006).
The lists of profitability ratios are as follows:
Return on Assets (ROA) Ratio:
It is the key indicator of the profitability of a corporation. It is the ratio of net profits after taxes with total assets. This ratio is calculated through following formula:
Return on Net Worth Ratio:
It evaluates the capability of a management of corporation to realize a sufficient return on capital investment. This ratio can be calculated by using the following formula:
Net Profit after Taxes/Net Worth
Liquidity Ratios:
It shows how much liquidity is readily available. It has following ratio;
Debt to Equity Ratio:
The ratio indicates about that the organization is leveraging its debt against the working capital. If liabilities exceed net worth then creditors have additional stake than the share owners.
Total Liabilities (Debts) / Owners Equity or Net Worth
Quick Ratio:
It shows how much cash and accounts receivables are available to meet the corporation’s current obligation. It is calculated by dividing the quick assets of a company with its current liabilities.
Quick Asset/ Current Liabilities
Whereas quick Asset = Total Current Asset - Inventory
3.2.1. Stochastic frontier analysis (SFA)
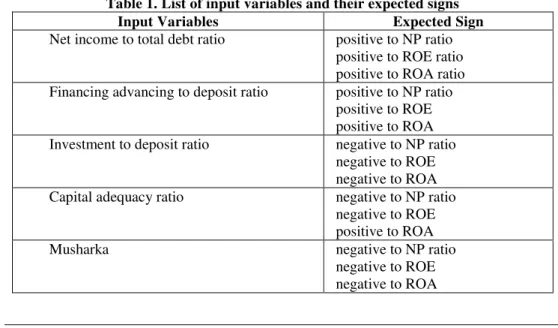
The study uses three output and eight input variables. The output variables are return on asset (ROA), return on equity (ROE) and net profit ratio (NP). The input variables and their expected signs to output variables are shown in Table 1.
Table 1. List of input variables and their expected signs
Input Variables Expected Sign
Net income to total debt ratio positive to NP ratio positive to ROE ratio positive to ROA ratio Financing advancing to deposit ratio positive to NP ratio
positive to ROE positive to ROA Investment to deposit ratio negative to NP ratio
negative to ROE negative to ROA Capital adequacy ratio negative to NP ratio
negative to ROE positive to ROA
Musharka negative to NP ratio
Input Variables Expected Sign
Mudharba negative to NP ratio
negative to ROE negative to ROA
Istisn’a negative to NP ratio
negative to ROE negative to ROA
Environment of bank Number of branches has been used as proxy for the bank environment Note: NP represents Net profit; ROA represents Return on Asset and ROE represents
Return on Equity
3.2.2. Econometric model
The study estimates three outputs separately along with inputs using SFA method. The model for Return on Asset ratio is,
it it it it it it it it
it
NID
FADR
IDR
CAR
MUD
IST
EOB
ROA
1
2
3
4
5
6
7
(1)The model for Return on Equity ratio is,
it it it it it it it it
it
NID
FADR
IDR
CAR
MUD
IST
EOB
ROE
1
2
3
4
5
6
7
(2)The model for Net Profit Ratio is,
it it it it it it it it
it
NID
FADR
IDR
CAR
MUD
IST
EOB
NP
1
2
3
4
5
6
7
(3)where i= no of countries i.e. 4 t = years i.e. 8
4. RESULTS AND DISCUSSIONS
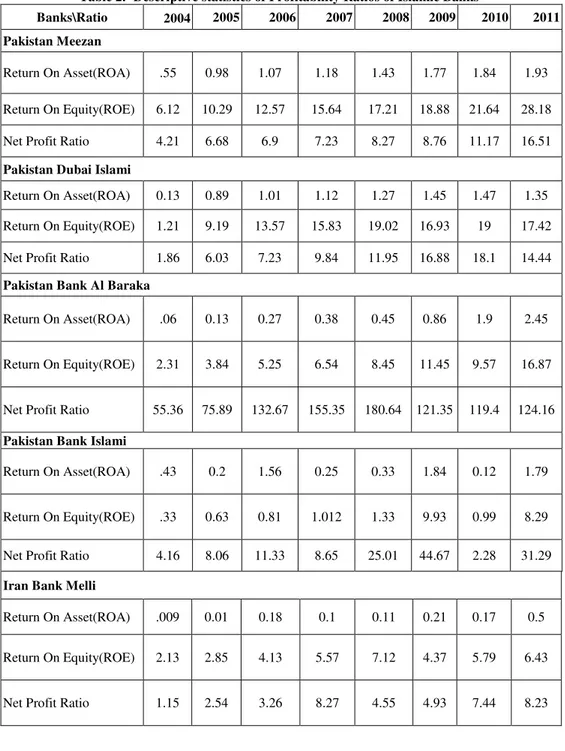
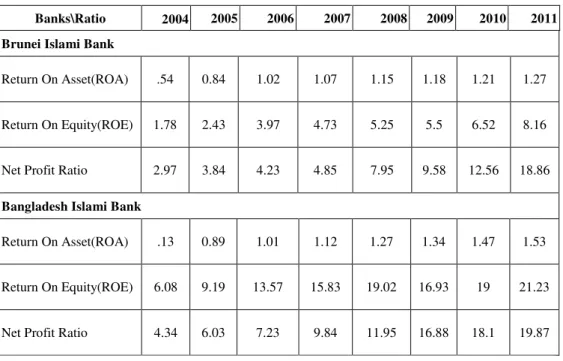
4.1 Descriptive Statistics
Return on Assets (ROA) is a measure of profitability that measures how efficiently a firm has utilized its assets in generating profits. Usually assets are both financed by debt and equity, ROA figure tells capital providers that how efficiently firm has converted their investment into profits. The results of Table 2 show that except for Pakistan Bank Islami, Iran Bank Melli and Bangladesh Melli bank, remaining banks showed a consistent positive growth in return on assets. Pakistan Al Baraka has showed tremendous growth in 2010 and 2011 where its return on assets increases from 86% in 2009 to 245% in 2011. Except for Iran Bank Melli, all banks showed exceptional return on assets in 2012.
In contrast to ROA, return on equity (ROE) tells how much net income a firm has generated from the capital shareholders have invested. Simply put it measures the rate of return on
owner’s investment. The results show that Meezan Bank, Bangladesh Islami Bank and
Brunei Islami Bank have shown consistent growth in ROE. Remaining banks have positive
Net Profit Ratio determines how much profit a firm has generated for every 100 rupee of sales. This is a measure of overall profitability of business. A high ratio indicates the efficient management of assets and funds. The results show that except for Pakistan Bank Islami and Iran Bank Melli, all banks showed that they are consistently efficient in generating returns on sales.
Table 2. Descriptive statistics of Profitability Ratios of Islamic Banks
Banks\Ratio 2004 2005 2006 2007 2008 2009 2010 2011
Pakistan Meezan
Return On Asset(ROA) .55 0.98 1.07 1.18 1.43 1.77 1.84 1.93
Return On Equity(ROE) 6.12 10.29 12.57 15.64 17.21 18.88 21.64 28.18
Net Profit Ratio 4.21 6.68 6.9 7.23 8.27 8.76 11.17 16.51
Pakistan Dubai Islami
Return On Asset(ROA) 0.13 0.89 1.01 1.12 1.27 1.45 1.47 1.35
Return On Equity(ROE) 1.21 9.19 13.57 15.83 19.02 16.93 19 17.42
Net Profit Ratio 1.86 6.03 7.23 9.84 11.95 16.88 18.1 14.44
Pakistan Bank Al Baraka
Return On Asset(ROA) .06 0.13 0.27 0.38 0.45 0.86 1.9 2.45
Return On Equity(ROE) 2.31 3.84 5.25 6.54 8.45 11.45 9.57 16.87
Net Profit Ratio 55.36 75.89 132.67 155.35 180.64 121.35 119.4 124.16
Pakistan Bank Islami
Return On Asset(ROA) .43 0.2 1.56 0.25 0.33 1.84 0.12 1.79
Return On Equity(ROE) .33 0.63 0.81 1.012 1.33 9.93 0.99 8.29
Net Profit Ratio 4.16 8.06 11.33 8.65 25.01 44.67 2.28 31.29
Iran Bank Melli
Return On Asset(ROA) .009 0.01 0.18 0.1 0.11 0.21 0.17 0.5
Return On Equity(ROE) 2.13 2.85 4.13 5.57 7.12 4.37 5.79 6.43
Banks\Ratio 2004 2005 2006 2007 2008 2009 2010 2011
Brunei Islami Bank
Return On Asset(ROA) .54 0.84 1.02 1.07 1.15 1.18 1.21 1.27
Return On Equity(ROE) 1.78 2.43 3.97 4.73 5.25 5.5 6.52 8.16
Net Profit Ratio 2.97 3.84 4.23 4.85 7.95 9.58 12.56 18.86
Bangladesh Islami Bank
Return On Asset(ROA) .13 0.89 1.01 1.12 1.27 1.34 1.47 1.53
Return On Equity(ROE) 6.08 9.19 13.57 15.83 19.02 16.93 19 21.23
Net Profit Ratio 4.34 6.03 7.23 9.84 11.95 16.88 18.1 19.87
The modes of financing such as Musharka, Mudharba and Istisna shows mix result of percentage growth in Pakistan as well as in other South Asian countries in Table 3. The Meezan bank of Pakistan shows that Istisna account is more than Mudharba and Musharka. It has been observed that people prefer to invest either in Musharka or Mudharba rather than Istisna. However, the percentage growth rate of Istisna is positive except Bank Islami Pakistan.
Table 3. Descriptive Statistics of modes of Islamic Banks (in million)
Modes 2004 2005 2006 2007 2008 2009 2010 2011
Meezan (Pakistan)
Musharka 0 21000 60000 87000 127000 140000 283000 331000
% growth 65.0 31.0 31.5 9.3 50.5 14.5
Mudharba 470000 630000 1350000 1760000 2021249 3040000 3420000 5470000
% growth 25.40 53.33 23.30 12.93 33.51 11.11 37.48
Istisn’a 2130000 4210000 6380000 9895982 12456687 12810000 12110000 16710000
Modes 2004 2005 2006 2007 2008 2009 2010 2011
Dubai Islami (Pakistan)
Musharka 90000 120000 180000 250000 380000 450000 550000 630000
% growth 25.00 33.33 28.00 34.21 15.56 18.18 12.70
Mudharba 150000 630000 1120000 2670000 4040000 4640000 5300000 5470000
% growth 76.19 43.75 58.05 33.91 12.93 12.45 3.11
Istisn’a 2510000 2970000 3130000 4120000 5800000 6750000 7970000 7880000
% growth 15.49 5.11 24.03 28.97 14.07 15.31 -1.14
Bank Al Baraka (Pakistan)
Musharka 340000 1360000 4560000 6130000 9080000 11020987 19180568 17624596
% growth 75.0 70.2 25.6 32.5 17.6 42.5 -8.8
Mudharba 12450000 18240000 23670000 27680000 30605489 55102561 60572546 61015400
% growth 31.74 22.94 14.49 9.56 44.46 9.03 0.73
Istisn’a 0 0 0 0 0 0 0 1817540
Bank Islami (Pakistan)
Musharka 1387000 2233965 4080706 4550654 6867850 5126934 3664498 3905870
% growth 37.91 45.26 10.33 33.74 -33.96 -39.91 6.18
Mudharba 2759000 4327000 5714869 7584000 8425650 58835000 41216500 31578400
% growth 36.24 24.29 24.65 9.99 85.68 -42.75 -30.52
Istisn’a 1920000 2600000 4570790 11210000 18623100 11692540 8660000 13152800
% growth 26.15 43.12 59.23 39.81 -59.27 -35.02 34.16
Bank Melli (Iran)
Musharka 80000 710580 1460860 2030000 3470000 7570000 9150000 11230000
% growth 88.74 51.36 28.04 41.50 54.16 17.27 18.52
Mudharba 25260000 31564500 21045870 43876050 54958795 58181240 60840500 63810450
% growth 19.97 -49.98 52.03 20.17 5.54 4.37 4.65
Istisn’a 0 32105470 56104578 75840000 9067800 13671650 25366500 38514500
Modes 2004 2005 2006 2007 2008 2009 2010 2011
Brunei Islami Bank (Brunei)
Musharka 69440 137900 201780 305300 414450 499200 583480 8970800
% growth 49.64 31.66 33.91 26.34 16.98 14.44 93.50
Mudharba 60480 110950 153140 248220 375750 553280 759800 1050560
% growth 45.49 27.55 38.30 33.94 32.09 27.18 27.68
Istisn’a 36160 66150 124260 160860 189450 246480 302760 446220
% growth 45.34 46.76 22.75 15.09 23.14 18.59 32.15
Bangladesh Islami Bank (Bangladesh)
Musharka 320000 875500 1640000 2080000 2510000 2940000 4650000 3130000
% growth 63.45 46.62 21.15 17.13 14.63 36.77 -48.56
Mudharba 80000 132540 210841 284500 350458 4306980 5704500 7405896
% growth 39.64 37.14 25.89 18.82 91.86 24.50 22.97
Istisn’a 130000 356600 570134 689700 871540 1124580 1387500 3851840
% growth 63.54 37.45 17.34 20.86 22.50 18.95 63.98
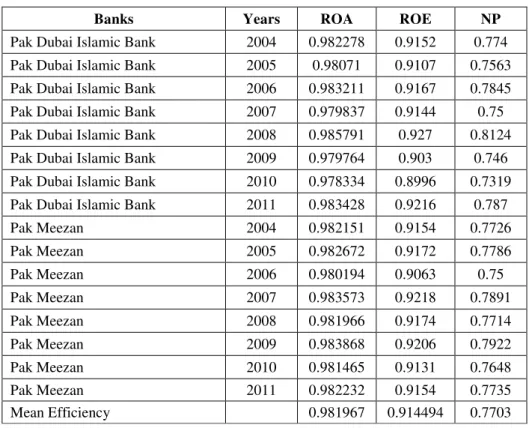
4.2. Profitability Efficiency Estimates
The Islamic banks in south Asia are efficient on average at 98.19% with respect to Return on Asset ratio, 91.44%with respect to Return on Equity ratio and 77.03% with respect to Net profit ratio. The result of Table 4 shows that Islamic banking is highly technical efficient on Return on asset ratio while least efficient with net profit ratio. The findings of the study show that average efficiency of Islamic Banking remain stable. The Bangladesh Bank Islami shows maximum efficiency among the sample country is 98.58 in year 2007 according to ROA ratio. The Meezan bank shows maximum efficiency in year 2009 while Pakistan Bank Islami in year 2010.
Table 4. Efficiency Measures
Banks Years ROA ROE NP
Bangladesh Bank Islami 2004 0.982843 0.9167 0.7814 Bangladesh Bank Islami 2005 0.983988 0.9274 0.7939 Bangladesh Bank Islami 2006 0.976757 0.8865 0.7138 Bangladesh Bank Islami 2007 0.985829 0.9339 0.8155
Banks Years ROA ROE NP Bangladesh Bank Islami 2009 0.979298 0.9017 0.74 Bangladesh Bank Islami 2010 0.983572 0.9218 0.7896
Bangladesh Bank Islami 2011 0.98221 0.9162 0.7735
Brunei Darul Islam 2004 0.981569 0.9129 0.7655
Brunei Darul Islam 2005 0.981446 0.9118 0.7645
Brunei Darul Islam 2006 0.98404 0.9249 0.7954
Brunei Darul Islam 2007 0.977996 0.899 0.7215
Brunei Darul Islam 2008 0.983017 0.9134 0.7868
Brunei Darul Islam 2009 0.982645 0.9194 0.7776
Brunei Darul Islam 2010 0.985515 0.9325 0.8127
Brunei Darul Islam 2011 0.978737 0.8991 0.733
Iran Bank Meli 2004 0.982155 0.9154 0.7727
Iran Bank Meli 2005 0.981788 0.9128 0.7684
Iran Bank Meli 2006 0.983699 0.9238 0.791
Iran Bank Meli 2007 0.98054 0.9075 0.7539
Iran Bank Meli 2008 0.98172 0.9134 0.7677
Iran Bank Meli 2009 0.982401 0.9162 0.7755
Iran Bank Meli 2010 0.982329 0.9161 0.7748
Iran Bank Meli 2011 0.981951 0.9147 0.7703
Pak Al Baraka 2004 0.982045 0.9148 0.7714
Pak Al Baraka 2005 0.982022 0.9149 0.7712
Pak Al Baraka 2006 0.983098 0.9198 0.7837
Pak Al Baraka 2007 0.980468 0.9074 0.7531
Pak Al Baraka 2008 0.982535 0.9172 0.7772
Pak Al Baraka 2009 0.982275 0.9159 0.7741
Pak Al Baraka 2010 0.981989 0.9146 0.7707
Pak Al Baraka 2011 0.982015 0.9147 0.7711
Pak Bank Islami 2004 0.981767 0.913 0.768
Pak Bank Islami 2005 0.983032 0.9198 0.7831
Pak Bank Islami 2006 0.980119 0.9057 0.7494
Pak Bank Islami 2007 0.98384 0.9234 0.7922
Pak Bank Islami 2008 0.981244 0.9112 0.7624
Pak Bank Islami 2009 0.979845 0.9058 0.7467
Pak Bank Islami 2010 0.98516 0.9289 0.8078
Banks Years ROA ROE NP Pak Dubai Islamic Bank 2004 0.982278 0.9152 0.774
Pak Dubai Islamic Bank 2005 0.98071 0.9107 0.7563 Pak Dubai Islamic Bank 2006 0.983211 0.9167 0.7845 Pak Dubai Islamic Bank 2007 0.979837 0.9144 0.75 Pak Dubai Islamic Bank 2008 0.985791 0.927 0.8124
Pak Dubai Islamic Bank 2009 0.979764 0.903 0.746
Pak Dubai Islamic Bank 2010 0.978334 0.8996 0.7319 Pak Dubai Islamic Bank 2011 0.983428 0.9216 0.787
Pak Meezan 2004 0.982151 0.9154 0.7726
Pak Meezan 2005 0.982672 0.9172 0.7786
Pak Meezan 2006 0.980194 0.9063 0.75
Pak Meezan 2007 0.983573 0.9218 0.7891
Pak Meezan 2008 0.981966 0.9174 0.7714
Pak Meezan 2009 0.983868 0.9206 0.7922
Pak Meezan 2010 0.981465 0.9131 0.7648
Pak Meezan 2011 0.982232 0.9154 0.7735
Mean Efficiency 0.981967 0.914494 0.7703
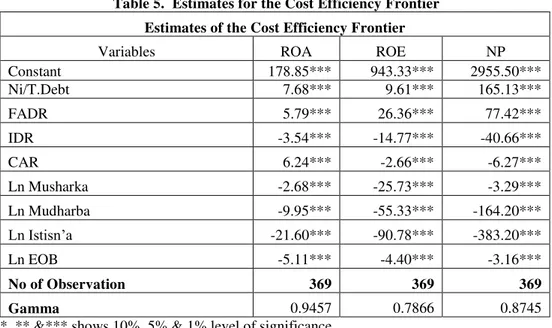
Table 5 shows the estimates of cost efficiency frontier. The results show that net income to debt ratio, financing advances to deposit ratio is positive to ROA, ROE and NP ratio. The efficiency of Islamic banks in each country is different. The efficiency of Islamic banks of Brunei is higher in south Asia with 93.25% followed by Islamic banks in Pakistan with 92.34 % efficiency level. The efficiency level of Islamic banks in Bangladesh and Iran is 91.93% and 91.6% respectively. Kablan and Yousfi (2011) measured 92.72% efficiency of Islamic banks of the world. The efficiency result of this study is 98.18% as compare to Kablan and Yousfi study because the study area is only Islamic countries where demand of Islamic banking system exists. Mokhtar et all (2006) used stochastic frontier approach to estimate the efficiency of Malaysian Islamic banks by using only ROA ratio and their efficiency level is 80%, while this study used ROA, ROE and NP ratio for the south Asian country. The results of this study show that Islamic banks are efficient 98% efficient on ROA and 91% on ROE base ratios in south Asia.
4.3. Cost Efficiency Frontier
by 383 time when cost of istisna increase by one percent. The environment of bank in this study is measured by no of branches of bank which shows that cost of one additional branch has negative impact on profitability ratio especially in case of ROA which is 5.1 percent per additional branch.
Table 5. Estimates for the Cost Efficiency Frontier Estimates of the Cost Efficiency Frontier
Variables ROA ROE NP
Constant 178.85*** 943.33*** 2955.50***
Ni/T.Debt 7.68*** 9.61*** 165.13***
FADR 5.79*** 26.36*** 77.42***
IDR -3.54*** -14.77*** -40.66***
CAR 6.24*** -2.66*** -6.27***
Ln Musharka -2.68*** -25.73*** -3.29***
Ln Mudharba -9.95*** -55.33*** -164.20***
Ln Istisn’a -21.60*** -90.78*** -383.20***
Ln EOB -5.11*** -4.40*** -3.16***
No of Observation 369 369 369
Gamma 0.9457 0.7866 0.8745
*, ** &*** shows 10%, 5% & 1% level of significance
CONCLUSION AND RECOMMENDATION
The Islamic banks in south Asia are efficient on average at 91.44% with respect to Return on Asset ratio, 98.19% with respect to Return on Equity ratio and 77.03% with respect to Net profit ratio. The efficiency of Islamic banks parameters shows that Return on Asset ratio is more efficient as the financing mode of Islamic banks is based on equity basis. The mode of Islamic financing like Musharka, Mudharba and Istisna is cost effective in ROA and ROE ratio. Since the cost has direct negative impact on net profits therefore the financing of Islamic finance and adverse impact on net profit ratio.
The study tries to provide empirical results of Islamic Banking in South Asian countries. The Islamic Banking in South Asia especially in Pakistan grow rapidly. The modes of Islamic Finance have negative impact on cost but positive impact on efficiency. It would be easy to formulate policies either focusing on cost side or on efficiency side. The results also provide significant insights to bank management and policy makers for the optimal utilization of scarce resources.
REFERENCES
Ahmad, A U., Hasan, M.K. (2007). Regulations and Performance of Islamic Banking in Bangladesh. Thunderbird International Business Review, 49(2), 251–277
AL-Jarrah, I., Molyneux, P. (2003). Cost Efficiency, Scale Elasticity and Scale Economies in Arabian Banking. Paper presented in 10th Annual Conference of Economic Research Form For the Arab Countries, Iran and Turkey in Morocco 16-18 December 2003.
Dar, H. (2003). Handbook of International Banking, Edward Elgar, chap. 8.
El-Din, S., Abdullah, N.I. (2007). Issues of Implementing Hire Purchase in Dual Banking
System’s. Malaysia’s Experience. Thunderbird International Business Review, 49(2) 225–249
Garas, N.S., (2007). Internationalization of Islamic financial institution. Challenges and paths to solution. Thunderbird International Business Review, 49(2) 225–249 Hameed, A., Bashir, M. (2003). Determinants of Profitability in Islamic Banks: Some
Evidence from the Middle East. Islamic Economic Studies, 11(1), 121-132.
Hussein, K., (2004). Banking Efficiency in Bahrain: Islamic vs. Conventional Banks. Islamic Development Bank, Islamic Research and Training Institute, Research Paper no. 68.
Kablan, Y. (2011). Performance of Islamic Banks across the World: An empirical analysis from2001-2008. Munich Personal Repec Archive.
Kader, J. M., Asaporta, A, J., AL-Maghaireh, A. (2007). Comparative Financial Performance of Islamic Banks vis-à-vis Conventional Banks in the UAE. Thunderbird International Business Review, 47(5) 127-135.
Kahf, M. (2002). Strategic Trends in the Islamic Banking. Paper presented at the Harvard Forum on Islamic Finance and Banking, Harvard University, Cambridge, Boston, April 6-7
Karbhari, Y., Naser, K., Shahin Z. (2004). Problem and Challenges Facing the Islamic Banking System in the west The case of the UK. Thunderbird International Business Review, 46(5) 521–543
Khan, M., & Mirakhor, A. (1987). Theoretical studies in Islamic banking and finance, Houston: IRIS Books
Khan, M., (1986). Islamic Interest-Free Banking, IMF Staff Papers 33, 1–27.
Mester, L .J. (2007). Some thoughts on the evolution of the banking system and the process of financial intermediation. Economic Review 1(2), 67 – 75
Moktar, H.S., Abdullah, N., AL-Habshi, S.M. (2006). “Efficiency of Islamic Banks in Malaysia: A Stochastic Frontier Approach,” Journal of Economic Cooperation among Islamic Countries 27 (2), 37–70.
Patnam, B. H. (1983). Concept of Financial Monetary. Federal Reserve Bank of Atlanta Economic Review, pages 6-13.
Sabi, M., (1996). Comparative Analysis of Foreign and Domestic Bank Operation in Hungray. Journal of Comparative Economics 22(2), 1979-1988.
Saleh, A. H., Zeitun, R. (2006). Islamic Banking Performance in the Middle East: A Case study of Jordan, University of Wollongong, http://ro.uow.edu.au/ commwkpapers/157
Saleh, A. S., Rami, Z. (2005). Development of Islamic Banking in Lebanon: Prospects and Future Challenges. Review of Islamic Economics, 9(2), 72-91.
Samad, A. (1999). Relative Performance of Conventional banking vis-à-vis Islamic Bank in Malaysia. IIUM Journal of Economics and Management 7 (1), 1-25.
Samad, A. (2004). Bahrain Commercial Bank’s Performance during 1994-2001. Credit and Financial Management Review 10 (1), 33-40
Stefflar, W., Cornilisse, P. (1995). Islamic banking in practice: The case of Pakistan. Development and Change, 26, 687-699.