юopyright © нлмр
by Academic Publishing House Researcher
Published in the Russian Federation
European Researcher
Has been issued since 2010. ISSN 2219-8229
E-ISSN 2224-0136
Vol. 100, Is. 11, pp. 711-718, 2015
DOI: 10.13187/er.2015.100.711 www.erjournal.ru
Economic sciences
UDC 33
Complex Network Analysis of Guangzhou Metro
1 Yasir Tariq Mohmand 2 Fahad Mehmood
3 Fahd Amjad 4 Nedim Makarevic
1-3 COMSATS Institute of Information Technology, Islamabad, Pakistan 1 E-mail: [email protected]
2 E-mail: [email protected] 3 E-mail: [email protected]
4 Embassy of Bosnia and Herzegovina in Pakistan, Pakistan
E-mail: [email protected]
Abstract
The structure and properties of public transportation networks can provide suggestions for urban planning and public policies. This study contributes a complex network analysis of the Guangzhou metro. The metro network has 236 kilometers of track and is the 6th busiest metro
system of the world. In this paper topological properties of the network are explored. We observed that the network displays small world properties and is assortative in nature. The network possesses a high average degree of 17.5 with a small diameter of 5. Furthermore, we also identified the most important metro stations based on betweenness and closeness centralities. These could help in identifying the probable congestion points in the metro system and provide policy makers with an opportunity to improve the performance of the metro system.
Keywords: Guangzhou metro, complex networks, betweenness centrality, closeness
centrality.
Introduction
[12], and the underground transportation in Boston and Vienna [13, 14]. While some of the studies have focused on the dynamic properties of complex network, most of the works in the literature of complex networks have focused on the characterization of topological properties such as the small world behavior and scale free structure [15]. In this paper, we study the topological properties of the Guangzhou Metro. The network, which transfixes all directions with 236 kilometers of tracks, has been formed in Guangzhou, with an average passenger capacity of 3,240,000 passenger trips per day. Having delivered 1.85 billion rides in 2012, Guangzhou Metro is the sixth busiest metro system in the world, after the metro systems of Tokyo, Seoul, Moscow, Beijing, and Shanghai [16].The rest of the paper is laid out as follows. In section 2 we discuss the network construction and the topological properties of the network whereas section 3 concludes the paper.
Network Construction and Topological properties
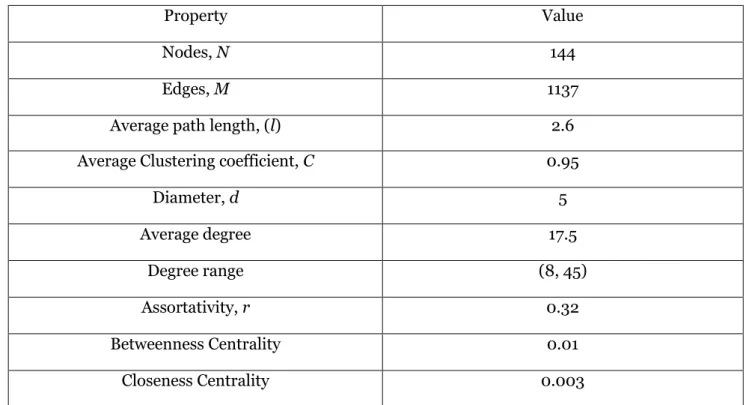
The Guangzhou metro consists of N = 144 stations extending across Guangzhou city. Two different methodologies exist in common literature for the representation of a network as a graph. The first methodology (space L) consists of nodes representing stations and a link between two nodes exists if they are consecutive stops on the route. Secondly, although nodes in the second methodology (space P) are the same as in the previous topology, here an edge between two nodes means that there is a direct route that links them. We adopt the second methodology and hence our network can be considered as a graph with N nodes and K edges and is represented by the adjacency matrix {aij}, i.e., the N · N matrix whose entry aij is 1 if and only if there is an edge directly joining node i to node j and 0 otherwise. Table 1shows all the computed network statistics, from basic network properties such as the number of nodes and edges to the more complex analysis such as clustering, assortativity and centralities.
Table 1: Computed Properties of Guangzhou Metro
Property Value
Nodes, N 144
Edges, M 1137
Average path length, (l) 2.6
Average Clustering coefficient, C 0.95
Diameter, d 5
Average degree 17.5
Degree range (8, 45)
Assortativity, r 0.32
Betweenness Centrality 0.01
Closeness Centrality 0.003
We start off with the average shortest path length. The average shortest path length
(The minimum number of edges passed through to get from one node to another) between one node to all other nodes of the network is calculated using the following equation:
,
,
1 s t V
d a b D
N N
т
(1)
V = set of nodes in the network,
d (a, b) = shortest path from a to b
N = total number of nodes in the network.
A small average path length of a single stop (l = 2.6) means that there is travel among almost all the stations of Guangzhou Metro, regardless of geographical distance. The network also features small diameter (maximum path length of a network) d = 5. The degree of a node, a measure of its connectivity, is defined as the fraction of nodes with degree k in the network. In our case, the degree is defined as the number of stations that can be reached from a given station via a single route. For a given node i, the degree can be represented using:
N i ij
j
k
a
(2)The average degree of the whole graph can thus be obtained using the following equation: 1 N 1 N N
i ij
i i j
k k a
N N
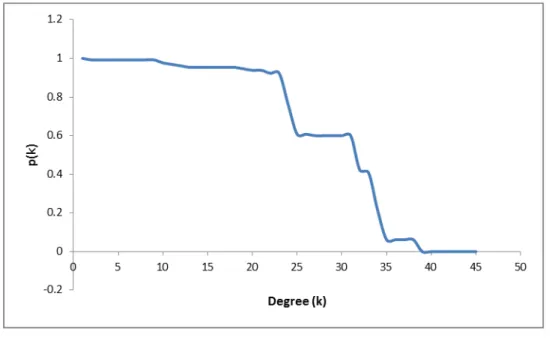
(3)The network possesses a high average degree of 17.5, indicating high connectivity among the nodes. The degree distribution of the network is presented in Fig. 1.
Clustering coefficient (Ci) of a node i is defined as the ratio of the number of mutually shared links by its neighboring nodes to the highest number of potential probable links among them. The average clustering coefficient is defined as
0 1 N
i i
C C
N
(4)Using the above equation, the average clustering coefficient (C) of the network is calculated to be 0.95, indicating that the Guangzhou metro is a highly clustered network. This result is
substantially higher than the value of an equivalent ёrdös–Rényi random graphз гCER) = 0.06. The
clustering coefficient together with the small average path length (see above) indicates that the Guangzhou metro is a small-world.
Figure 1. Degree Distribution
by Newman in 2002 [17]. Mathematically, this expression can be represented by the following equation.
2
1
jk j k jq
q
r
jk e
q q
(5)Where
k jk j
q
e
and q2 2 k k2k k
k q
kq
(6)
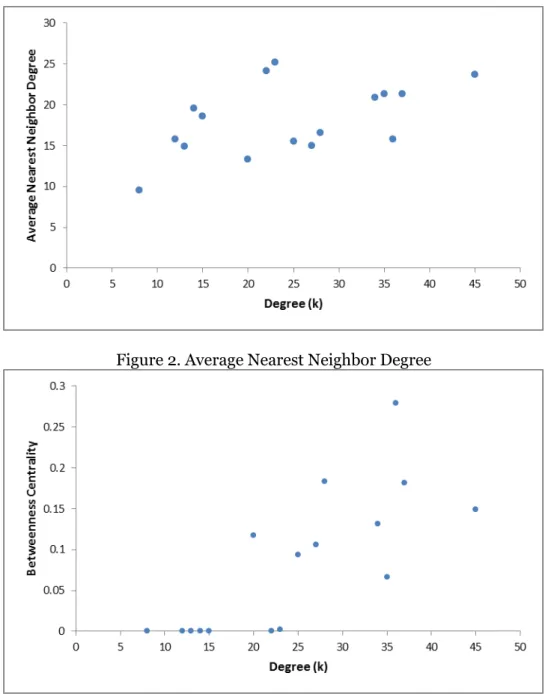
This statistic lies in between the range of [-мз м]з where Ем indicates a completely disassortative network and 1 indicates a completely assortative network. For Guangzhou metro, the assortativity is measured to be 0.32 illustrating high degree nodes at one end of a link showing preference towards high degree nodes at the other end. A closer inspection of the degree correlations can be done using another measure, the average degree of nearest neighbor, Knn(k) for nodes of degree k.
,
1
1
N nn i ij ji j
k
a k
k
(7)
If knn(k) increases with k, the network is assortative. If knn(k) decreases with k, the network is disassortative. Fig. 2 represents the average degree of nearest neighbor and it can be seen that the
knn(k) increases with degree k, which is consistent with a positive assortativity of 0.32. To identify the stations with high congestion, betweenness centrality is used. Betweenness centrality of a node
i can be defined as sum of the fraction of all-pairs shortest paths that passes through i. Mathematically:
,, |
,
Bs t V
s t i
c
i
s t
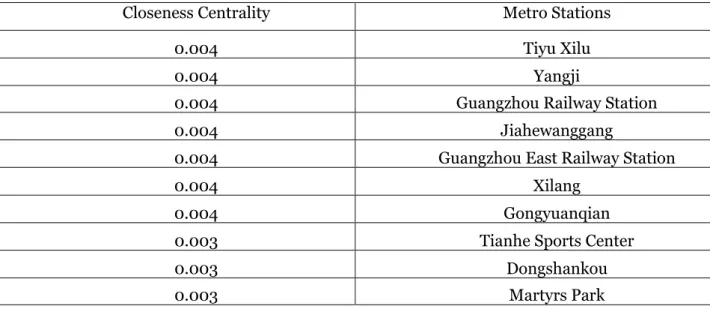
т (8)Where V is the set of nodes, σ(s, t) is the total number of shortest paths and is the number of shortest paths passing through i [18]. Betweenness centrality is presented in Fig. 3 whereas the top ten metro stations according to high betweenness centrality are given in Table 2. The interchange Tiyu Xilu leads the list as it provides a link between three different subway lines and hence has the largest congestion. The other interchanges following Tiyu Xilu are Chebeinan, Xilang, Yangji and Guangzhou Railway Station. Another studied parameter is the Closeness centrality, defined as the average shortest distance from node i to all the other nodes, which reflects the closeness degree of the node with other nodes in the network. The mathematical expression is
11
i n i j jN
C V
d VV
(9)Figure 2. Average Nearest Neighbor Degree
Figure 3. Betweenness Centrality
Conclusions and future work
Table 2: Betweenness Centrality of Top Ten Stations
Betweenness Centrality Metro Stations
0.28 Tiyu Xilu
0.18 Chebeinan
0.18 Xilang
0.18 Yangji
0.15 Guangzhou Railway Station
0.14 Kecun
0.13 Jiahewanggang
0.12 Linhexi
0.11 Wanshengwei
0.07 Gongyuanqian
Table 2: Closeness Centrality of Top Ten Stations
Closeness Centrality Metro Stations
0.004 Tiyu Xilu
0.004 Yangji
0.004 Guangzhou Railway Station
0.004 Jiahewanggang
0.004 Guangzhou East Railway Station
0.004 Xilang
0.004 Gongyuanqian
0.003 Tianhe Sports Center
0.003 Dongshankou
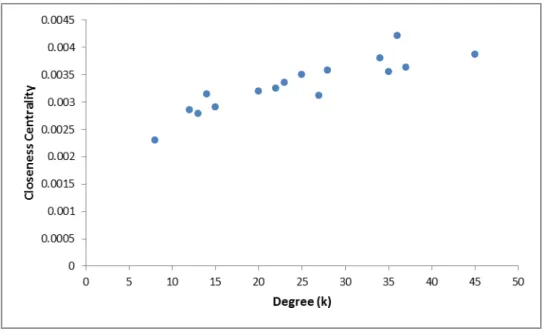
Figure 4. Closeness Centrality
Acknowledgements
This research is supported by 2011 Founded Project of National Natural Science Foundation of China (71171084), 2011 Research Fund for the Doctoral Program of Higher Education of China (20110172110010) and The Fundamental Research Funds for the Central Universities (2012, x2gsD2117850).
References:
1. O. Sporns, Complexity 8, 56 (2003).
2. R. Pastor-Satorras, A. Vespignani, Evolution and structure of the internet: A statistical
physics approach, (Cambridge University Press, Cambridge, 2004).
3. V. Latora, M. Marchiori, Phys. Rev. E 71, 015103(2005). 4. R. Albert, et al., Phys. Rev. E 69, 025103 (2004).
5. A.-L. Barabasi and R. Albert, Nature 286, 509 (1999). 6. W. Li and X. Cai, Phys. Rev. E 69, 046106 (2004). 7. G. Bagler, Physica A 387, 2972 (2008).
8. Rй Guimera´з et alйз Procй Natl. Acad. Sci. USA 102, 7794 (2005).
9. W. Li and X. Cai, Physica A 382, 693 (2007). 10. P. Sen, et al., Phys. Rev. E 67, 036106 (2003). 11. H. Soh, et al., Physica A, 389, 5852 (2010).
12. J. Sienkiewica and J.A. Holyst, Phys. Rev. E 72, 046127 (2005). 13. V. Latoraa and M. Marchiorib, Physica A 314, 109 (2002). 14. K. A. Seaton and L. M. Hackett, Physica A 339, 635 (2004). 15. X. Xu, et al, Chaos 17, 023129 (2007).
16. Guangzhou Metro Corporation, http://www.gzmtr.com/en/ 17. M.E.J. Newman, Phys. Rev. Lett 89, 208701 (2002).
оо
1
2
3 4
1-3 з з
1 E-mail: [email protected] 2 E-mail: [email protected] 3 E-mail: [email protected]
4 з
E-mail: [email protected]
й з
й
й
нос с- й
й
мтйр - рй з
й
й
х з з з