ISSN 1553-3468
© 2011 M.I. Kotb-El-Sayed et al., This open access article is distributed under a Creative Commons Attribution (CC-BY) 3.0 license
Corresponding Author: Mohamed-I Kotb-El-Sayed, Department of Biochemistry and Molecular Biology, Faculty of Pharmacy, Helwan University, Ain Helwan, Helwan, P.O. Box 11790, Cairo, Egypt
Tel: +20114-0400-767 Fax: +202-2554-1601
179
Effects of Camel’s Milk as a Vehicle for Insulin on
Glycaemic Control and Lipid Profile in Type 1 Diabetics
1
Mohamed-I Kotb-El-Sayed,
2Zakaria-Y Al-Shoeibi,
3
Ahmed-A Abd El-Ghany and
4Zayed-A Atef
1
Department of Biochemistry and Molecular Biology, Faculty of Pharmacy,
Helwan University, Ain Helwan, Helwan, P.O. Box 11790, Cairo, Egypt
2
Department of Organic Chemistry, Faculty of Pharmacy,
Sana’a University, Madbah, P.O. Box 19065, Sana’a Yemen
3
Department of Biochemistry, Faculty of Pharmacy,
Al-Azhar University, Assuit Bransh, P.O. Box 71511, Assuit, Egypt
4
Department
of Internal Medicine, Faculty of Medicine,
Sana’a University, Madbah, P.O. Box 19065, Sana’a Yemen
Abstract: Problem statement: To evaluate effects of oral insulin carried by camel’s milk on type 1 diabetes patient in comparison with both insulin injection requirements and camel’s milk alone.
Approach: Total of fifty randomly selected type 1 diabetic subjects were divided into three groups; A, B and C (n = 15). All subjects received a usual care (diet, exercise and insulin injection) but group B subjects in addition received 500 mL day−1 of camel’s milk, while group C their subjects in addition received insulin mixed with 500 ml day−1 of camel’s milk. Blood samples were taken at beginning and at end of treatment to measure lipid profile and HbA1c % while blood glucose measured weekly.
Results: Data shown significant improvements in FBG (205.3±2.16-47.26±1.89), PBG (339.86±3.18-161.26±2.89), HbA1c % (9.9±0.25±5.62±0.21) and significant reduction in insulin requirement
(59.26±0.7-20±0.35) in group C receiving insulin mixed with camel’s milk in comparison with groups A and B. Conclusion: Camel’s milk mixed with insulin was indicated to be an effective supplementation, as adjunctive therapy in management of type 1 diabetes than camel milk or insulin injection.
Key words: Camel’s milk,oralinsulin, body mass index, diabetes type 1, anti-coagulium
INTRODUCTION
Type 1 diabetes mellitus is a common organ specific auto-immune and endocrine disorder, characterized by chronic hyperglycaemia and disturbances of carbohydrates, fat and protein metabolism associated with insulin deficiency. Prevention and early treatment is important because diabetes interrupts normal developments in children and carries the threat of severe complication in more active period of life (Singh and Palmer, 2005) Its primary treatment is insulin injection replacement, however at present neither entire physiological insulin replacement could be achieved in clinical practice nor could metabolic disturbances be normalized. Insulin therapy is still the best treatment, however, among certain social groups needle phobia, cost and routine treatment forces these patients to adopt alternative treatments in the context of traditional ethno-medical practices.
Oral insulin therapy has been known for many years but the important drawback is its coagulum formation in acidic environment such as the stomach, thereby neutralising its potency. The potential benefits of oral delivery of insulin include control of plasma glucose levels without peripheral hyper-insulinnaemia and restoration of the physiological pathway of endogenous insulin, this result in preservation of the counter-regulatory responses to hypoglycaemia, with a concomitant reduction in hypoglycaemic events.
180 It is claimed that the value of camel’s milk is to be found in the high concentrations of volatile acids especially, linoleum acid and polyunsaturated acids, which are essential for human nutrition. El-Agamy et al. (1996) found good amount of lysozyme, lactoferrin, lactoperoxidase, immunoglobulin G and secretory immunoglobulin a in camel’s milk. The milk protein, lactoferrin, has some anti-viral and anti-bacterial properties. Camel’s milk was therapeutically used against dropsy, Jaundice, problems of the spleen, tuberculosis (Akhundov et al., 1972; Urazakov and Bainazarov, 1974). Camel’s milk works as a laxative on people unaccustomed to drinking this milk (Rao et al., 1970), other lung ailments (Gast et al., 1969) and hepatitis (Sharmanov and Kadyrova, 1978). Several studies have been carried out at the Zayed Complex; UAE showed that camel milk has the IgA and IgG that have proved effective against several viral and bacterial pathogens (Amir, 2003). The milk also has slimming properties (Yasin and Wahid, 1957).
We have heard of many folkloric stories which describe the use of camel’s milk in the treatment of type-1 diabetes mellitus. There is also an account in memories of Emperor Jahangir (1579-1627 AD) referring to the usefulness and acceptability of camel milk (Rogers, 1989). Camel’s milk is used traditionally to treat diabetes (Hamers-Casterman et al., 1993; Hull, 2004). Breitling (2002) and believed that camel’s milk had an anti-diabetic activity possibly because of insulin-like activity, regulatory and immuno modulators effect on beta cells. One of the camel milk proteins has been reported to have similar characteristics to insulin (Beg et al., 1986a; 1986b).
It is important to note that a certain level of scientific testing on camel’s milk has already been attempted and documented, particularly, insulin levels in camel milk and this scientific wisdom can be remarkable achievement for diabetic patients while there is no any attempting to assess anti-coagulum effect of camel milk on oral insulin in treatment of diabetes mellitus type 1. Depending on above literatures, we aim in the current study to evaluate the effects of raw camel’s milk mixed with insulin orally on glycaemia control, lipid profile parameters and insulin requirements in type 1 diabetic subjects in comparison to treatments with camel’s milk alone or insulin replacement.
MATERIALS AND METHODS
Materials:
Milk sample source, collection and preservation:
Milk samples were obtained from multifarious lactating
camels (Camelus dromedarius) of the Experimental Station of Al-Mahra in Yemen republic. Samples were collected from bulk milk of single Naga from early morning milking in dry sterile screw clean bottles (250 mL) after thoroughly mixing and immediately labelled, cooled to 4°C and transferred in an icebox to the laboratory within 24 h. To prevent microbial growth 10 mg of 2-bromo-2-nitro-1, 3 propanediol (Bronopol Tablets, preservative systems Ltd from Chemgo Organica, Basel, Switzerland) were added to each 50 mL of camel milk.
Insulin vials: Insulin (Human Mixtard(R) 30/70, 100 IU mL−1) vials were purchased from NOVO NORDISK Denmark. Mixtard(R) 30/70 is a pre-mixed neutral suspension of human insulin consisting of neutral soluble insulin injection (30%) and isophane insulin injection (70%). When shaken gently, the liquid appears white and cloudy. Together, the combination of insulins is called biphasic isophane insulin.
Reagents and chemicals: Kits of TGs, Tc, LDLc and
HDLc were obtained from Beijing Chengxinde
Biochemistry Reagent Company (Beijing, China). 2-bromo-2-nitro-1, 3 propanediol (Bronopol Tablets, preservative systems Ltd) was purchased from Chemgo Organica, Basel, Switzerland).
Equipments: The HbA1c level was measured by HPLC
(variant BIO-RAD Company, USA), Centrifuge (HERNIE Z 400, Wehingen), UV/Visible spectrophotometer (Shimadzu), micropipette of different size, deep freeze, Accu-Chek(R) (Roche) and plastic syringe were used.
Patients and treatment schedule: A fifty Yemeni subjects previously diagnosed with type 1 diabetes mellitus since two years were randomly recruited from the outpatient of Diabetes and Endocrine Center at Al-Thawra Hospital in Sana’a Capital of Yemen Republic. Subjects gave written consent before participation in the study and the study protocol approved by local ethical committee. The patients were advised to follow strict diet, exercise and insulin treatment for 1 month. During this period frequent monitoring of blood sugar was done to maintain euglycemia.
181 camel milk (in which X unit of insulin dissolved) in addition to usual care for 3 months (age = 20.22 ±1.9; 11 M/ 4 F).
In all studied groups, insulin injection doses gradually reduced according to glycaemia control and case improvements. In addition, insulin injection doses in group C reduced according to previously added doses to milk. In groups C insulin added to milk at beginning of each month in gradually increased mixed doses (5, 10 and 20 units). Patients with any acute metabolic complications like hypoglycaemia, ketoacidosis, cardiovascular event, renal or acute infections were excluded from the study. Baseline data of the experimental groups were similar in demographic and clinical variables.
Blood sugar was measured once weekly before- and 2 h after breakfast using one touch profile memory glucometer (Accu-Chek(R)) which were provided for all patients. At beginning and at end of treatment regimen, blood samples were collected from participants for measuring HbA1c % and serum separation, then serum
samples preserved at-20°C until measurement (within 2 weeks) of total cholesterol (Tc), low density lipoprotein
cholesterol (LDLc), High Density Lipoprotein cholesterol
(HDLc) and triglycerides (TGs). Finally, BMI for all
individual before and after treatments was recorded. Diagnosis of diabetes was made if fasting blood sugar was >126 mg dL−1 and 2 h blood glucose was>200 mg dL−1 or a personal detail of known diabetes with the history of treatment was available.
Biochemical estimations: Fasting and postprandial blood glucose level was measured by Accu-Chek Active device as described by Joslin (1971). Body Mass Index (BMI) was measured according to the equation, BMI = weight (kg)/length2 (m2). HbA1c% was
measured by High Performance Liquid Chromatography (HPLC) using a spherical cation exchange gel. Serum lipids were estimated by colorimetric methods. TGs were estimated using the
phosphate oxidase method as described by Trinder (1969), total cholesterol was estimated using the Chod-Pap method as described by Zoppi and Fellini (1976), LDLc was measured as described by
Bergmeyer (1983) and HDLc was estimated using
the dextran-sulphate Mg(II) method as described by Wieland and Siedel (1981).
Statistical analysis: Statistical calculations were performed using SPSS (version 15.0) Computer software. Values before and after treatment within each group was analyzed by using paired student’s test. Data were prepared as mean ± S.E.M. P value <0.05 was considered statistically significant.
RESULTS
Data of the present study were illustrated in Table 1-5 and Fig. 1-5 The present study showed that a significant decrease in FBG, PBG and HbA1c% after
treatment in three studied groups after treatment except a non-significant change in HbA1c% of group A as
compared with baseline data (Fig. 1; Table 1). Diabetes mellitus is usually complicated with hyperlipoproteinemia. The effects of these treatments on lipid profile in type 1 diabetic subjects were shown significant decrease in TGs, Tc and LDLc after treatment
in three studied groups while a significant increase in HDLc of three groups after treatment except in group A
as compared with baseline data (Fig. 2; Table 1).
Table 1: Effects of camel’s milk mixed with insulin (C), camel’s milk alone (B) and insulin injection (A) on biochemical parameters within group before and after treatment of type 1 diabetic patients
Group A (control group) Group B (camel milk group) Group C (camel milk + insulin roup)
--- --- ---
Variable Before After Before After Before After
FBG (mg/dL) 195.6 ± 2.01 173.4±1.66♦♦♦ 199.46 ±4 155.13±3.5♦♦♦ 205.3±2.16 147.26±1.89♦♦♦
PBG (mg/dL) 339.6±10 299.1±8.9♦♦♦ 345.6±6.3 239.2±5.5♦♦♦ 339.86±3.18 161.26±2.89♦♦♦
HbA1c (%) 9.39±0.39 9.27±0.36 9.7 ± 0.39 7.28±0.23♦♦♦ 9.9± 0.25 5.62±0.21♦♦♦
BMI (Kg/m2) 18.04±0.34 17.79±0.27 16.78±0.25 17.38±0.18♦♦ 17.68±0.30 20.79± 0.28♦♦♦
TGs (mg/dL) 193.1±1.7 175.7±3.0♦♦♦ 184±2.1 133.6±4.2♦♦♦ 182.8±2.15 100.8±2.15♦♦♦
Tc (mg/dL) 271.8±3.35 248.6±3.7♦♦♦ 251.8±9.3 209.2±3.2♦♦♦ 283.6±2.56 153.3±1.69♦♦♦
LDLc (mg/dL) 109.9±2.45 102.6±1.51♦♦ 110±2.9 92.4±2.6♦♦♦ 103.5±2.91 70.6±3.32♦♦♦
HDLc (mg/dL) 43.1±1.53 43.7±1.26 44.3±2.0 49±1.5♦♦ 41±1.89 48.9±1.22♦♦♦
Dose of 50±0.64 45.46±0.9♦♦♦ 55.1±1.4 36.2±1.22♦♦♦ 59.26±0.7 20±0.35♦♦♦
insulin (units/day)
Each group represents the mean ± S.E.M. (n = 15). Control = insulin (X units/day, S.C. injection); Group B = camel milk (500 mL day−1) +
insulin injection (X units/day, S.C. injection); Group C = camel milk (500 mL day−1 ) in which X units of insulin mixed + insulin injection (X units day-1, S.C. injection). FBG = fasting blood glucose; PBG = postprandial blood glucose; HbA
1c% = glycated haemoglobin; BMI = body mass
182
(a) (b)
(c)
Fig. 1: The effects of S.C. insulin injection [X units/day] (a), camel milk [500 mL day−1] (b) and camel milk [500 mL day−1] in which X units of insulin mixed (c) on FBG, PBG and HbA1c% in type 1 diabetic subjects. Data
were shown as mean ± S.E.M. (n = 15), ♦♦♦p<0.001 when compared with data before treatment. B = before treatment; A = after treatment; FBG = fasting blood glucose; PBG = postprandial blood glucose; HbA1c% = glycoselated haemoglobin. Data had shown a significant decrease in FBG, PBG and HbA1c%
after treatment in three studied groups except a non-significant change in HbA1c% of group A when
compared with baseline data
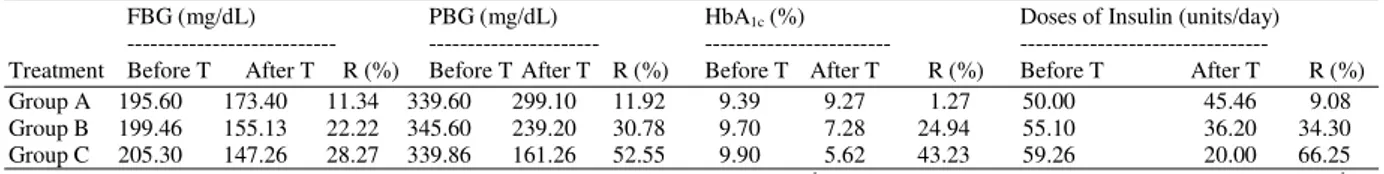
Table 2: Percentage reduction in insulin requirements in control (A) and experiment groups (B and C) with respect to baseline values
FBG (mg/dL) PBG (mg/dL) HbA1c (%) Doses of Insulin (units/day)
--- --- --- ---
Treatment Before T After T R (%) Before T After T R (%) Before T After T R (%) Before T After T R (%)
Group A 195.60 173.40 11.34 339.60 299.10 11.92 9.39 9.27 1.27 50.00 45.46 9.08
Group B 199.46 155.13 22.22 345.60 239.20 30.78 9.70 7.28 24.94 55.10 36.20 34.30
Group C 205.30 147.26 28.27 339.86 161.26 52.55 9.90 5.62 43.23 59.26 20.00 66.25
Each group represents the mean ± S.E.M. (n = 15). Group A = insulin (X units day-1, S.C. injection); Group B = camel milk (500 mL day−1) +
insulin injection (X units day-1, S.C. injection); Group C = camel milk (500 mL day−1) in which X units of insulin mixed + insulin injection (X
183
(a) (b)
(c)
Fig. 2: The effects of S.C. insulin injection [X units/day] (a), camel milk [500 mL day-1] (b) and camel milk [500 mL day-1] in which X units of insulin mixed (c) on lipid profile in type 1 diabetic subjects. Data were shown as mean ± S.E.M. (n = 15), ♦♦p<0.01, ♦♦♦p<0.001 when compared with data before treatment. B = before treatment; A = after treatment; TGs = triglycerides; Tc = total cholesterol; LDLc = low density
lipoprotein cholesterol; HDLc = high density lipoprotein cholesterol. Data had shown a significant decrease
in TGs, Tc and LDLc after treatment in three studied groups while a significant increase in HDLc of three
groups after treatment except group A when compared with baseline data
Table 3: Levels of FBG (mg/dL) during 12 week in studied groups with respect to baseline values
Treatment 0 1 2 3 4 5 6 7 8 9 10 11 12
Group A 195.6 ± 2.0 191.3±0.3 190±1.24 188.2±2.7 187.3±1.0 185±2.10 183.5±0.4 180.9±0.7 176.7±2.5 175.4±0.1 174.6±1.4 173.9±1.6 173.4±1.660 Group B 199.46 ±4.0 196.2±5.6 195.6±2.3 190.4±3.3 186.2±1.2 182.6±0.8 177±0.60 170±2.2 164.1±6.7 159.3±3.4 156±2.90 156.1±0.8 155.13±3.50
Group C 205.3±2.10 200±2.20 196.1±1.5 190.2±2.5 184.3±3.5 179.4±0.8 162±1.10 157±2.4 153±0.5 151±2.10 149±0.10 147.5±0.3 147.26±1.89
Each group represents the mean ± S.E.M. (n = 15). Group A = insulin (X units day-1
, S.C. injection); Group B = camel milk (500 mL day−1
) + insulin injection (X units day−1
, S.C. injection); Group C = camel milk (500 mL day−1) in which X units of insulin mixed + insulin injection (X units day-1, S.C. injection)
Table 4: Levels of PBG (mg/dL) during 12 week in studied groups with respect to baseline values
Treatment 0 1 2 3 4 5 6 7 8 9 10 11 12
Group A 339.6±10.00 340±2.2 335±7.6 330±3.40 325±3.8 321±1.9 327±9.8 318±5.5 311±3.300 309.3±1.4 304±0.77 301±0.67 299.1±8.90
Group B 345.6±6.300 333±2.2 324±6.7 315±3.90 307±1.8 292±2.4 280±0.93 273±3.3 264.2±10.2 256±0.46 249±2.60 244±1.10 239.2±5.50
Group C 339.86±3.18 321±3.2 306±3.5 292±1.22 277±4.4 264±6.5 248±1.1 223±2.9 205±0.780 183±1.50 173±0.37 166±2.10 161.26±2.89
Each group represents the mean ± S.E.M. (n = 15). Group A = insulin (X units day−1, S.C. injection); Group B = camel milk (500 mL day−1) + insulin injection (X units day−1, S.C. injection);
Group C = camel milk (500 mL day−1
y) in which X units of insulin mixed + insulin injection (X units day-1
184
(a) (b)
(c)
Fig. 3: The effects of S.C. insulin injection [X units/day] (a), camel milk [500 mL day−1] (b) and camel milk [500 mL day−1] in which X units of insulin mixed (c) on BMI and insulin doses in type 1 diabetic subjects. Data were shown as mean ± S.E.M. (n = 15), ♦♦ p<0.01, ♦♦♦ p< 0.001 when compared with data before treatment. B = before treatment; A = after treatment; BMI = body mass index; Ins D = insulin doses. Data had shown significant increase in BMI after treatment in both B and C studied groups while non significant change in group A when compared with baseline data. In addition, data were shown significant reduction in daily insulin requirements in three studied groups after treatment when compared with baseline values but with different percentages among studied groups
Table 5: Insulin requirements (units/day) during 12 week in studied groups with respect to baseline values
T 0 1 2 3 4 5 6 7 8 9 10 11 12
Group A 50±0.640 50±0.6400 50±0.9900 49.2±1.00 48.5±0.45 47.0±1.3 47.0±1.1 46.5±2.1 46.2±0.47 46.0±3.4 46.0±2.23 45.55±0.78 45.46±0.9 Group B 55.1±1.40 55.1±1.400 53.7±1.200 51.3±0.89 49.6±1.10 47.2±2.12 45.1±0.55 43.4±3.2 41.0±3.40 39.4±0.88 38.2±0.43 36.7±2.500 36.2±1.22 Group C 59.26±0.7 50.1±.0.99 47.2±.1.11 42.7±0.77 41.1±2.20 40.3±1.70 37.2±0.35 34.7±2.1 33±1.400 31.4±3.20 25.3±4.20 22.5±0.5500 20±0.350 Each group represents the mean ± S.E.M. (n = 15). Group A = insulin (X units day-1
, S.C. injection); Group B = camel milk (500 mL day-1
) + insulin injection (X units day-1
, S.C. injection); Group C = camel milk (500 mL day−1
) in which X units of insulin mixed + insulin injection (X units day-1
185
(a) (b)
(c)
Fig. 4: The effects of S.C. insulin injection [X units/day] (a), camel milk [500 mL day−1] (b) and camel milk [500 mL day−1] in which X units of insulin mixed (c) on FBG during 12 week of treatment of type 1 diabetic subjects. Data were shown as mean ± S.E.M. (n = 15). w = week; FBG = fasting blood glucose. Data had shown significant decrease in FBG after treatment in three studied groups but in both B and C studied groups than in group A and in group C than B when compared with baseline data
(a) (b)
(c)
186 In addition, data had shown significant increase in BMI after treatment in both B and C studied groups while non significant change in group A as compared with baseline data. In contrast, data were shown a significant reduction in daily insulin requirements in three studied groups after treatment as compared with baseline values but with different mode among studied groups (Fig. 3; Table 1). Data had shown significant decrease in FBG, PBG and insulin doses after treatment in three studied groups but in both B and C studied groups than in group A and in group C than B during 12 week of treatment as compared with baseline data (Fig. 4 and 5; Table 2-5). The acceptability of camel’s milk was fairly good and only two patients complained of flatulence which disappeared after 3 days. Nausea, flatulence and mild diarrhoea (2-4 semisolid) was reported by four patients who also subsided spontaneously. Five patients were excluded from the current study due to three of them have chronic diseases (renal failure and heart disease) and two of them hate the odour of mixed insulin with milk. No severe hypoglycaemic event or diabetic ketoacidosis were reported in all groups. Out of 45 patients, only ten patients in group A, five in group B and one patient in group C required the same doses of insulin and the other 29 patients had lower requirement.
DISCUSSION
The present study intended to explore the grounds on which camel’s milk is based as traditional use in achieving glycaemia control in type-1 diabetes patients, in addition; to assess the role of camel milk as a natural vehicle for carrying and protecting insulin hormone from acidity and digestion in stomach.
In the current study, significant improvements were observed in all studied biochemical parameter after 3 month of treatment in all studied groups. However, these improvements were clear and significant in group C than other studied groups; particularly in reduction of blood glucose and insulin requirements to obtain glycaemia control along with significant improvement in HbA1c % level at the end of three months.
Requirements of mean doses of insulin day-1 before treatment in patients of group C was 59.26±0.7. It was rapidly declined during the early experimental stages then gradually reached a mean value of 20±0.35, (p<0.001). There appears to be a connection between camel’s milk and diabetes; it is common practice in Africa, Asia and the Middle East to drink camel’s milk for treating diabetes mellitus, without defining which type there is (Yagil et al., 1994). The results of the present study in the same line with repeated trials of
Agrawal et al. (2002) whom observed that there was 30-35% reduction in daily doses of insulin in patients of type 1 diabetes receiving raw camel’s milk. They stated that camel milk had shown to possess insulin like activities, which decrease the requirement of exogenous insulin in type 1 diabetes patients (Agrawal et al., 2002; 2003; 2005).
Camel’s milk dyes have special properties not found in milk of other mammals (Yagil, 1987), which favours it to treats diabetics. It contains large concentrations (52 units/liter) of insulin and used traditionally to treat diabetes (Hamers-Casterman et al., 1993; Yagil et al., 1994; Singh, 2001) thereby it may be the reason for lesser requirement of insulin in groups B and C than group A. In addition, Beg et al. (1986a; 1986b) found that amino acid sequence of some of the camel’s milk protein is rich in half cystine, which has superficial similarity with insulin family of peptides. Moreover, Breitling (2002) suggested that camel milk is having anti diabetic activity possibly because of: insulin like activity, regulatory and immuno modulatory functions on β cells. El-Agamy et al. (1996) found good amount of lactoferrin, in camel milk. The milk protein, lactoferrin, which known to enhance the immune response and is present in large quantities in camel milk (ten times higher than in cow milk) does have some anti-viral and anti-bacterial properties. Insulin is a metallic hormone contains Zn, in this point; Saitmuratova et al. (2001) stated that the proteins of camel's milk and shubat were studied by electrophoresis. It was found that Fe and Zn occur in greater quantities in both camel's milk and shubat than in cow’s milk. Then camel’s milk contains insulin like protein with its Zn.
There is strong evidence that oral insulin products would provide insulin in a more physiological manner, resulting in a decrease in peripheral insulin concentrations this “insulinsing” the live (Gwinup et al., 1991; Hoffam and Ziv, 1997). Scientists have developed hexylinsulin monoconjugate 2(HIM2), in which a single amphiphilic olignmer is covalently linked to the free amino group on the lys-β 29 residue of recombinant human insulin via an amide bond (Still, 2002). HIM2 alterations in physio-chemical are a characteristic which resists the enzymatic degradation and facilitates absorption. A similar trial in France, using two doses of oral insulin (2.5 and 7.5 mg day−1) also did not show any positive effect (Chaillous et al., 1999).
187 whereas it is low in cow milk (16.32±5.98 micro unit/mL) (Shehadeh et al., 2001) but probably because of coagulation in stomach it is not available for absorption in the intestine. Intestinal absorption of large proteins and, therefore, insulin is only possible in the first few days of life (Lawrence and Lawrence, 2010). After this period proteins are destroyed in the stomach by acid and pepsin, especially in milk, which forms a coagulum in the stomach. However, among the pertinent properties is a high acid content ascorbic acid (Farah et al., 1992) and does not react to the acid and not form coagulum in acidic environment (Abu-Lehia, 1989; Wangoh, 1993) and so will pass into the intestines ready for absorption of insulin, so the therapeutic efficacy of camel’s milk may be due to lack of coagulum formation of camel’s milk in acidic media and antibacterial and antiviral properties (El-Agamy et al., 1992).
Even if camel milk passes into the small intestine without forming cheese it is not known how insulin, a protein, is absorbed by humans with diabetes mellitus. The validity of this hypothesis was proven in the current study by decline in blood glucose after treatment in groups C and B than A. This decline validates the observation that camel milk acts on regulating cellular sugar in the absence of endogenous insulin and in presence of exogenous oral insulin.
Fat dispersed as small micelles in the camel’s milk instead of a layer of fat in other types of milk so non-reaction to acid (Shamsia, 2009). Hence we predict that micelles in camel’s milk could be take the insulin present in the milk within it and protect it from coagulation by acidity or digestion by pepsin in the stomach to be absorbed as it in the micelles or release it again in small intestine for absorption.
Diabetes mellitus is usually complicated with
hyperlipoproteinemia in particular
hypercholesterolemia. The effects of treatments in the current study on lipid profile in type 1 diabetic subjects were shown significant decrease in TGs, Tc
and LDLc after treatment in three studied groups but
with different percentage of reduction. In contrast, a significant increase in HDLc of three groups after
treatment was observed except in group a when compared with baseline data.
These results in agreement with Saitmuratova et al. (2001) and Hamers-Casterman et al. (1993) whom found that the camel’s milk, lower in fat, lactose and contains no cholesterol and more nutritious. It has been reported that camel’s milk contain high levels of vitamins C (three times that of cow milk and one-and-a-half times that of human milk), A, B2, E and very rich
in potassium, iron, magnesium and other trace elements
(Pozzilli et al., 2000; Gast et al., 1969; Al-Hashem, 2009). In addition, Gast et al. (1969) claim that the value of camel’s milk is to be found in the high concentrations of volatile acids, especially, linoleum acid and the polyunsaturated. These vitamins and polyunsaturated are antioxidants thereby removing free radicals and useful in preventing the tissues injury including β-cells of pancreas. High concentrations of antioxidants and removal of fat from the body may make the insulin receptors more responsive to available insulin. Moreover, these free radicals have a role in intensifying oxidized-LDLc and exhausting HDLc.
We observed a significant increase in mean BMI of group B and C (16.78±0.25-17.38±0.18 and 17.68±0.300-20.79±0.28 respectively) after three months of camel milk mixed with insulin suspension or camel milk alone treatment, while non-significant decrease in BMI in group A. This positive effect in weight gain and stability in lipid profile of the experimental group (B and C) may be attributed o the good nutritional value and relatively lower fat percent and extremely low cholesterol or anabolic effect of camel milk. However, camel milk is most beneficial for human nutrition (Agrawal et al., 2007; Konuspayeva et al., 2007; El-Fakharany et al., 2008); in particular the hypoallergenic properties of its protein fraction suggest that this product is more similar to human than cows’ milk (El-Agamy et al., 2009). Nutrition plays a vital role in the health of a community especially malnutrition. Malnourished populations are more susceptible to most infections and severity of illness worsening the mortality rates (WHO, 2001).
CONCLUSION
188 However, more research is necessary and further studies are warranted to fractionate the active principle of camel’s milk and to find out its exact mode of action as a suitable vehicle for oral insulin before a final conclusion can be made.
ACKNOWLEDGMENT
We appreciate the staff of the Diabetes and Endocrine Centre at Al-Thawra Hospital for assistance in diagnosis and monitoring subjects involved in the current study and we are indebted to all the patients and their family members who participated in this study.
Funding: There is no any funding for the current work.
Conflict of interest: The authors declare that there are none conflict of interest.
Author contributions: Mohamed-I Kotb El-Sayed: protocol oversight, data collection, data interpretation, statistical analysis, organization and manuscript writing; Zakaria-Y Al-Shoaibi and Ahmed-A Abd El-Ghany: data collection, data analysis, data interpretation and organization; Zayed-A Atef: data collection, interpretation and analysis.
REFERENCES
Agrawal, R.P., R. Beniwal, D.K. Kochar, F.C. Tuteja and S.K. Ghorui et al., 2005. Camel milk as an adjunct to insulin therapy improves long-term glycemic control and reduction in doses of insulin in patients with type-1 diabetes A 1 year randomized controlled trial. Diabetes Res. Clin. Pract., 68: 176-177. PMID: 15860247
Agrawal, R.P., S. Budania, P. Sharma, R. Gupta and D.K. Kochar, 2007. Zero prevalence of diabetes in camel milk consuming Raica community of north-west Rajasthan, India. India Diabetes Res. Clin. Pract., 76: 290-296. PMID: 17098321
Agrawal, R.P., S.C. Swami, R. Beniwal, D.K. Kochar and M.S. Sahani et al., 2003. Effect of camel milk on glycemic control, lipid profile and diabetes quality of life in type 1 diabetes: A randomised prospective controlled cross over study. Indian J. Anim. Sci., 73: 1105-1110.
Agrawal, R.P., S.C. Swami, R. Beniwal, D.K. Kochar and R.P. Kothari, 2002. Effect of camel milk on glycemic control, risk factors and diabetes quality of life in type-1 diabetes: A randomised prospective controlled study. Int. Diab. Dev. Countries, 22: 70-74.
Akhundov, A.A., B. Dyrdyev and E.R. Serebryakov, 1972. Effect of combined treatment on water electrolyte exchange in pulmonary TBC patients. Zdravookhr. Turkm., 16: 40-44.
Al-Hashem, F.H., 2009. Camel's milk alleviates oxidative stress and lipid peroxidation induced by chronic aluminum chloride exposure in rat's testes. Am. J. Applied Sci., 6: 1868-1875. DOI: 10.3844/ajassp.2009.1868.1875
Amir, K.A., 2003. Camel milk plasma may help produce anti-microbial vaccine. Al Nisr Publishing LLC.
Arthur, J.V., J.H. Sherman and D.S. Luciano, 2001. Human physiology: the mechanisms of body function. 8th Edn., McGraw-Hill, Boston, ISBN-10: 0072908017, pp: 800.
Beg, O.U., H.V. Bahr-Lind Z.H. Zaidid and H. Jhornvall, 1986b. Characterization of a camel milk protein rich in proline identifies a new beta-casein fragment. Regul. Pept., 15: 55-61. PMID: 3763959 Beg, O.U., H.V. Bahr-Lind, Z.H. Zaidid and H.
Jhornvall, 1986a. A camel milk whey protein rich in half-cystine. Primary structure, assessment of variations, internal repeat patterns and relationships with neurophysin and other active polypeptides. Eur. J. Biochem., 159: 195-201. PMID: 3743571 Bergmeyer, H.U., 1983. Methods of Enzymatic
Analysis. 3rd Edn., John Wiley and Sons, Weinheim, Florida, ISBN: 3527260412, pp: 574. Breitling, L., 2002. Insulin and ant diabetic activity of
camel milk. J. Camel Practice Res., 9: 43-45. Chaillous, L., H. Lefevre, C. Thivolet, C. Boitard, N.
Lahlou et al., 2000. Oral insulin administration and residual beta-cell function in recent-onset type 1 diabetes: A multicentre randomised controlled trial. Diabete insuline orale group. Lancet, 356: 545-549. PMID: 10950231
Chaillous, L., J.C. Carel and C. Thivolet et al., 1999. Lack of effect of one year oral insulin therapy in recent-onset type 1 diabetes: Results of a multicentric randomized controlled trial. Diabetologia, 42: A62- A62.
El-Agamy, E.I., M. Nawar, S.M. Shamsia, S. Awad and G.F.W. Haenlein, 2009. Are camel milk proteins convenient to the nutrition of cow milk allergic children? Small Ruminant Res., 82: 1-6. DOI: 10.1016/j.smallrumres.2008.12.016
189 El-Agamy, E.I., R. Ruppanner, A. Ismail, C.P.
Champagne and R. Assaf, 1992. Antibacterial and antiviral activity of camel milk protective proteins. J. Diary Res., 59: 169-175. PMID: 1319434 El-Fakharany, E.M., A. Tabll, A.A.E Wahahb, B.M.
Haroun and E.R.M. Redwan, 2008. Potential activity of camel milk-amylase and lactoferrin against hepatitis c virus infectivity in hepG2 and lymphocytes. Hepatitis Monthly, 8: 101-109. Farah, Z., R. Rettenmaier and D. Atkins, 1992. Vitamin
content of camel milk. Int. J. Vitam. Nutr. Res., 62: 30-33. PMID: 1587705
Gast, M., J.L. Mauboisj and J. Adda, 1969. Le Lait et les Produits Laitiers en Ahaggar. 1st Edn., Arts et Métiers Graphiques, Paris, pp: 69.
Gwinup, G., A.N. Elias and E.S. Domurat, 1991. Insulin and C-peptide levels following oral administration of insulin in intestinal-enzyme protected capsules. General Pharmacol., 22: 243-246. PMID: 2055417
Hamers-Casterman, C., T. Atarhouch, S. Muyldermans, G. Robinson and C. Hamers et al., 1993. Naturally occurring antibodies devoid of light chains. Nature, 363: 446-448. PMID: 8502296
Hoffam, A. and E. Ziv, 1997. Pharmacokinetic considerations of new insulin formulations and routes of administration. Clin. Pharmacokinetics, 33: 258-301. PMID: 9342504
Hull, S.J., 2004. Camel’s milk to treat diabetes. Nature, 363:446-448.
Joslin, E.P., 1971. Diabetes Mellitus. 11th Edn., Lea and Febiger, Philadelphia, ISBN: 0812101375, pp: 884.
Konuspayeva, G., B. Faye, G. Loiseau and D. Levieux, 2007. Lactoferrin and immunoglobulin contents in camel's milk (Camelus bactrianus, Camelus dromedarius and Hybrids) from Kazakhstan. J. Dairy Sci., 90: 38-46. PMID: 17183073
Lawrence, R.A. and R.M. Lawrence, 2010. Breastfeeding: A Guide for the Medical Professional. 7th Edn., Elsevier-Health Sciences Division, Maryland Heights, ISBN: 1437707882, pp: 1114.
Pozzilli, P., D. Pitocco, N. Visalli, M.G. Cavallo and R. Buzzetti et al., 2000. No effect of oral insulin on residual beta-cell function in recent-onset Type I diabetes (the IMDIAB VII). Diabetologia, 43: 1000-1004. DOI: 10.1007/s001250051482
Rao, M.B., R.C. Gupta and N.N. Dastur, 1970. Camels’ milk and milk products. Ind. J. Dairy Sci., 23: 71-78.
Rogers, A., 1989. Memories of Jahangir. 1st Edn., Allantic Publishers and Distributor, New Delhi, pp: 315.
Saitmuratova, O.K., G.I. Sulaimanova and A.A. Sadykov, 2001. Camel's Milk and Shubat from the Aral Region. Chem. Natural Comp., 37: 566-568. DOI: 10.1023/A:1014881202792
Shamsia, S.M., 2009. Nutritional and therapeutic properties of camel and human milks. Int. J. Genetics Mol. Biol., 1: 052-058.
Sharmanov, T.S. and R.D. Kadyrova, 1978. Changes in the indicators of radioactive isotope studies of the liver of patients with chronic hepatitis during treatment with whole camels’ milk and mares’ milk. Voprosy Pytaniya, 1: 9-13.
Shehadeh, N., L. Gelertner, S. Blaxer, R. Perlman and L. Solovachik et al., 2001. Importance of insulin content in infant diet: Suggestion for a new infant formula. Acta. Paediatr., 90: 93-95. PMID: 11227343
Singh, N. and J.P. Palmer, 2005. Therapeutic targets for the prevention of type 1 diabetes mellitus. Curr. Drug Targets Immune Endocr. Metabol. Disord., 5: 227-236. PMID: 16089357
Singh, R., 2001. Annual Report of National Research Center on Camel. 1st Edn., Bikaner, India, pp: 50. Still, J.G., 2002. Development of oral insulin: Progress
and current status. Diabetes. Metab. Res. Rev., 18: S29-S37. DOI: 10.1002/dmrr.207
Trinder, P., 1969. Estimation of triacylglycerol. Ann. Clin. Biochem., 6: 24-27.
Urazakov, N.U. and S. Bainazarov, 1974. "Tushchibek" - the 1st clinic in history for the treatment of pulmonary tuberculosis with camel's sour milk. Probl. Tuberk. PMID: 4281921
Wangoh, J., 1993. What steps towards camel milk technology. Int. J. Anim. Sci., 8: 9-11.
WHO, 2001. Management of Severe Malnutrition. 1st Edn., World Health Organization, Beijing, ISBN: 7117041676.
Wieland, H. and D. Siedel, 1981. HDL cholesterol estimation. Artzl. Lab., 27: 141-154.
Yagil, R., 1987. Camel milk - a review. Farm Anim., 2: 81-89.
Yagil, R., O. Zagorski, C.V. Creveld and A. Saran, 1994. Science and Camel Milk Production. In: Chameaux et Dromedaires, Animeaux Laitiers, G. Saint-Martin, (Edn.). Expansion Scientifique Francaise, Paris, pp: 75-89.
Yasin, S.A. and A. Wahid, 1957. Pakistan camels. A preliminary survey. Agric. Pak., 8: 289-297. Zoppi, F. and D. Fellini, 1976. Cholesterol estimation.

![Fig. 2: The effects of S.C. insulin injection [X units/day] (a), camel milk [500 mL day -1 ] (b) and camel milk [500 mL day -1 ] in which X units of insulin mixed (c) on lipid profile in type 1 diabetic subjects](https://thumb-eu.123doks.com/thumbv2/123dok_br/18288618.346358/5.892.131.766.191.755/effects-insulin-injection-insulin-lipid-profile-diabetic-subjects.webp)
![Fig. 3: The effects of S.C. insulin injection [X units/day] (a), camel milk [500 mL day −1 ] (b) and camel milk [500 mL day −1 ] in which X units of insulin mixed (c) on BMI and insulin doses in type 1 diabetic subjects](https://thumb-eu.123doks.com/thumbv2/123dok_br/18288618.346358/6.892.142.760.189.838/effects-insulin-injection-insulin-insulin-doses-diabetic-subjects.webp)
![Fig. 5: The effects of S.C. insulin injection [X units/day] (a), camel milk [500 mL day −1 ] (b) and camel milk [500 mL day −1 ] in which X units of insulin mixed (c) on insulin requirements during 12 week of treatment in type 1 diabetic subjects](https://thumb-eu.123doks.com/thumbv2/123dok_br/18288618.346358/7.892.125.764.654.987/insulin-injection-insulin-insulin-requirements-treatment-diabetic-subjects.webp)
