Study and Characterization
Dissertation
to obtain the Doctor’s degree in Chemical and Biological Engineering by University of Porto
Supervisors Adélio Miguel Magalhães Mendes (FEUP) Fernão Domingos de Montenegro Baptista Malheiro de Magalhães (FEUP) Paulo Alexandre Pereira Araújo (CUF-Químicos Industriais)
by
Ana Catarina de Bastos Vidal Dias
LEPAE – Laboratory of Engineering Processes, Environment and Engineering Chemical Engineering Department
Faculty of Engineering - University of Porto CUF – Químicos Industriais
First of all, I am grateful to Portuguese Foundation for Science and Technology (FCT) for my Ph.D. grant (SFRH/BDE/15558/2005) and to CUF-Químicos Industriais for providing financial support.
I would like to thank Professor Adélio Mendes for giving me the opportunity to carry out this thesis and for his support and to my co-supervisor Professor Fernão Magalhães. I am very grateful to Eng. Francisco Sotto Mayor for accepting me as a Ph.D. student at CUF-QI as for the three months of fruitful discussions. I would like to express my gratitude to Doctor Paulo Araújo for the chance to continue this work, and for his support. I am also grateful to CUF-QI and LEPAE/FEUP for providing me the necessary conditions to develop my work.
I wish to thank Professor Matthias Wessling for receiving me at Membrane Technology Group (MTG), University of Twente, the Netherlands, and to Doctor Jörg Balster for his guidance during my three months internship.
I am greatly indebted to Doctor Lúcia Brandão, who got involved in my impedance adventures. I have really appreciated her help and motivation.
It was a great pleasure for me to perform my thesis at CUF-QI. On the way many people accompanied me giving me practical and theoretical support and bringing me forward in my professional and personal
development. I would like to express my special thanks to Andrew Parker for being always ready for explaining me all my questions, to colleague Alejandro Ribeiro for helping me with the building up of the experimental setup, to my fellow workers Ana Tavares, Alberto Caires, Paula Costa, Rui Andrade, Teresa Marques and Vitor Pinto, for their friendship and advice and to the production Engineers Pedro Costa and António Sousa for their availability to discuss and clarify some doubts. Thankful words are also directed to Maria José Pereira for her help during the experimental tests. Maintenance personnel are also acknowledged for their active help during the experimental setup building up and for sharing their knowledge with me. I also wish to thank Eng. Mário Jorge Pinho, Eng. António Mesquita de Sousa and Eng. David Lopes for their comments and help for this investigation.
I would also like to acknowledge the helpful discussion with Professor Christopher Brett from University of Coimbra, Portugal.
Finally, I would like to thank César Águia for his support, motivation, patience and for listening me in the most turbulent moments. I am also very grateful to my family for their trust and help. Special thanks for my grandparents who lived this journey as intensively as I.
“Nothing in life is to be feared. It is only to be understood.” Marie Curie
The chlor-alkali industry is one of the most energy intensive electrochemical processes in the world. Moreover, the electrical energy consumption is the major fraction of the total producing cost. Therefore, high-energy efficiency processes are crucial for this type of industry. Despite being a mature technology, the knowledge about the chlor-alkali membrane process is dominated by three membrane suppliers and there are few studies reported in the scientific journals. The need for developing independent know-how on this technology was the major motivation of this thesis that also serves the interests of CUF-QI, the most important Portuguese chlor-alkali company.
Two experimental setups were designed, built and tested: an experimental setup for characterizing cation exchange membranes and an electrochemical membrane reactor for studying the membrane cell process. The former unit was built to determine one of the most important properties of ion-exchange membranes, the permselectivity. Concerning this unit and the electrochemical membrane reactor, it was found good agreement between experimental data and reference values. The electrochemical reactor was used to identify the most important parameters of the chlor-alkali membrane process (current density, feed flow rate,brine and caustic concentrations, and temperature) and to investigate their effect on the cell performance. It was
also studied in situ the hydrogen evolution reaction (HER) kinetics using cathodes of solid and mesh nickel plates.
The ohmic resistances of the membrane reactor were determined in situ by electrochemical impedance spectroscopy (EIS); this technique revealed to be a powerful tool for the characterization of the electrochemical process and namely the cathode and membrane. The hydrogen evolution reaction at commercial nickel cathodes were also investigated in situ by EIS. The anode overpotential was assumed to be negligible in comparison to the cathode overpotential and therefore used as a reference electrode; this assumption was validated experimentally. The kinetic properties of solid and mesh nickel cathodes were studied at 75 ºC. The effect of the electrode shape on overpotential and on impedance spectra was addressed. The experimental observation of a second semicircle on the impedance spectra of the mesh electrode was attributed to ac penetration through the mesh structure. Potential-current density curves (k-factor) were obtained and compared to the ones computed using the kinetic data.
Significant energy savings can be achieved by choosing the most adequate membrane and by replacing the membrane in the right moment. The average total process cost per ton of chlorine was calculated monthly for three electrolyzers each using a set of a different type membrane. From this
A indústria cloro-álcalis é uma das indústrias electroquímicas com maior consumo de energia, sendo que este representa a maior parte dos custos totais de produção. Desta forma, é essencial neste tipo de indústria operar com elevados níveis de eficiência energética. Apesar da tecnologia de células de membrana ter surgido nos anos 80, a informação científica disponível é dominada pelos grandes fornecedores industriais que mantêm limitado o acesso a esse conhecimento. A necessidade de desenvolver conhecimento estratégico sobre a tecnologia de células de membrana, foi a grande motivação desta tese. A investigação nesta área também permitirá aumentar o poder negocial da CUF-QI.
Foram projectadas e construídas duas unidades experimentais: uma unidade para a caracterização da membrana de permuta catiónica e uma unidade experimental de electrólise por células de membrana. A unidade de caracterização de membranas foi construída com o intuito de determinar a selectividade das membranas. O reactor electroquímico de membrana (electrolizador) foi utilizado para identificar os parâmetros críticos de operação (densidade de corrente, caudal de alimentação, concentrações de soda cáustica e salmoura e temperatura) e o seu efeito no desempenho do processo. A cinética da reacção de produção de hidrogénio em cátodos de níquel foi também investigada in situ nesta unidade experimental. As
instalações experimentais foram descritas detalhadamente e os dados experimentais comparados com valores de referência. Verificou-se que os valores obtidos estavam de acordo com os valores de referência para este tipo de processo.
A contribuição dos vários componentes da resistência óhmica que constituem a célula de membrana foi investigada in situ utilizando a espectroscopia de impedância electroquímica. Esta técnica revelou ser uma ferramenta poderosa na caracterização electroquímica do processo de células de membrana.
A espectroscopia de impedância foi também utilizada in situ para o estudo da cinética da reacção de produção de hidrogénio em cátodos de níquel comerciais. O sobrepotencial do ânodo foi considerado desprezável em relação ao sobrepotencial do cátodo e como tal foi usado como eléctrodo de referência. As propriedades cinéticas da reacção de produção de hidrogénio em cátodos sólidos e de rede a 75 ºC foram discutidas. A observação experimental de um segundo semicírculo no espectro de impedância obtido para os eléctrodos de rede, foi atribuído à penetração do sinal CA na rede do eléctrodo. Obtiveram-se curvas de polarização (densidade de corrente - potencial) que foram comparadas com as calculadas utilizando os parâmetros cinéticos.
aspectos essenciais para minimizar os custos de energia. A média mensal dos custos totais de operação por tonelada de cloro foi estimada para cada electrolizador. Com estes dados desenvolveu-se uma metodologia de benchmarking e avaliou-se o desempenho de três tipos diferentes de membranas.
L'industrie de chlore-alcalis reste parmi les industries chimiques les plus consommatrices d’énergie, ce qui représente une fraction importante du coût total de production. Par conséquent, l’efficacité énergétique est cruciale pour ce type d'industrie. En dépit d'être une technologie mûre, les connaissances sur les procédés chlore-alcalis basée dans la technologie de membrane est dominée par trois fournisseurs de membrane et il y a peu d'études rapportées dans les journaux scientifiques. Le besoin de développer savoir-faire indépendant sur cette technologie était la motivation à la base de cette thèse qui est par ailleurs en accord avec la stratégie de CUF-QI, la compagnie de chlore-alcali portugaise la plus importante.
Deux installations expérimentales ont été conçues, mises en œuvre et utilisées pour des testes: une installation expérimentale pour caractériser des membranes d'échange cationique et un réacteur électrochimique (électrolyseur) de membrane pour étudier le procédé des cellules de membrane. L’installation de caractérisation a été construite afin de déterminer l'une des propriétés les plus importantes des membranes d’échange d'ions, la permsélectivité. En ce qui concerne les résultats obtenu avec cette installation de caractérisation et ceux avec le réacteur électrochimique à membrane, un bon accord avec les valeurs de référence a été trouvé. Le réacteur électrochimique a été utilisé pour identifier les
paramètres les plus importants des procédés chlore-alcalis basée dans la technologie de membrane (densité de courant, débit d'alimentation, concentrations de saumure et de soude, et température) et pour étudier leur effet sur la performance des électrolyseurs. Il a également été étudié in situ la cinétique de la réaction de dégagement d'hydrogène (HER) en utilisant des cathodes constitué par des plaques de nickel solide ou en maille.
Les résistances ohmiques du réacteur à membrane ont été déterminés in situ par spectroscopie d'impédance électrochimique (SIE); cette technique s'est révélé être un outil puissant pour la caractérisation du procédé électrochimique et notamment la cathode et la membrane. La réaction de dégagement d'hydrogène à cathodes de nickel commerciaux a également été étudiée in situ par l'EIS.
La surtension anodique a été considéré négligeable par rapport à la surtension de la cathode et donc utilisé comme une électrode de référence; cette hypothèse a été validée expérimentalement. Les propriétés cinétiques des cathodes de nickel constitué par des plaques solides ou par des mailles ont été étudiées à 75 ºC. Les effets de la forme des électrodes sur les surtensions et sur les spectres d'impédance ont été discutés. L'observation expérimentale d'un deuxième demi-cercle sur les spectres d'impédance de l'électrode de mailles a été attribuée à la pénétration du courant alternatif à travers la structure en maille de l’électrode. Les courbes de densité de
calculées en utilisant les données cinétiques.
Des économies d'énergie significatives peuvent être réalisées en choisissant la membrane la plus adéquate et en remplaçant la membrane au bon moment. Le coût total moyen par tonne de chlore a été calculé mensuellement pour trois électrolyseurs, chacun utilisant un ensemble d'un type différent de membrane. De ces données une méthodologie d'évaluation a été développée et la performance des trois types différents de membranes a été rapportée.
Chapter 1 – Introduction... 1
1.1. Chlor-alkali process ... 1
1.2. Chlor-alkali membrane process ... 6
1.2.1. Thermodynamics ... 7
1.2.2. Kinetics... 9
1.2.3. Charge and mass transport... 13
1.2.4. Electrochemical characterization techniques ... 19
1.3. State of the art of the chlor-alkali membrane process ... 21
1.3.1. Electrodes ... 22
1.3.2. Membranes ... 25
1.3.3. Electrolyzers ... 28
1.4. Motivation and Outline... 29
1.5. References ... 32
Chapter 2- Chlor-alkali membrane cell – laboratorial setups ... 35
2.1. Abstract... 35
2.2. Introduction ... 36
2.3. Experimental... 38
2.3.1. Membrane characterization ... 38
2.4. Assessment of the Chlor-alkali Membrane cell unit ... 54 2.5. Conclusions ... 66 2.6. References ... 68 Appendix A ... 71 Appendix B... 73 Appendix C... 74 Chapter 3 - Characterization of the Chlor-Alkali Membrane Process by EIS.Part I- Ohmic resistance... 78 3.1. Abstract... 78 3.2. Introduction ... 79 3.3 Experimental... 82 3.3.1. Experimental setup ... 82 3.3.2. Design of experiments ... 84 3.3.3. Electrolyte conductivity... 85 3.3.4. EIS analysis ... 86 3.4. Results and discussion ... 89 3.4.1. Design of experiments ... 89 3.4.2. Impact of different operating variables on cell ohmic resistance by using EIS ... 93
3.5. Conclusions ... 105 3.6. References ... 107
EIS. Part II- Kinetic analysis of two different nickel cathodes ... 110 4.1 Abstract... 110 4.2. Introduction ... 111 4.3. Experimental... 114 4.4. Results ... 116 4.4.1. Comparison between solid and mesh electrodes based on the k-factor method... 116 4.4.2. Electrode kinetics ... 119 4.4.3. EIS Analysis ... 125 4.4.4. Impedance analysis of the mesh structure electrodes... 139 4.5. Conclusions ... 142 4.6. References ... 144 Chapter 5 - Benchmarking methodology for Ion-Exchange Membranes used in the Chlor-Alkali Process ... 149
5.1. Abstract... 149 5.2. Introduction ... 151 5.3. Experimental section ... 154 5.4. Results and discussion ... 157 5.5. Conclusions ... 175 5.6. References ... 176
Chapter 6 – General Conclusions and Future Work ... 177 6.1. General Conclusions... 177 6.2. Future Work... 179
Figure 1.1 - Geographic distribution of the worldwide chlorine production in 2008 [2].
Figure 1.2 – Schematic representation of a chlor alkali mercury cell [3-5]. Figure 1.3 – Schematic representation of a chlor-alkali membrane cell. Figure 1.4 – Volcano plot for the hydrogen evolution reaction (HER) (adapted from [4]).
Figure 1.5 – Illustrative scheme of the selective transport of counter ions across the membrane matrix [11].
Figure 1.6 – Illustrative scheme of the structure of different commercial membranes [4].
Figure 1.7 – Schematic representation of a commercial ion-exchange membrane (adapted from [22])
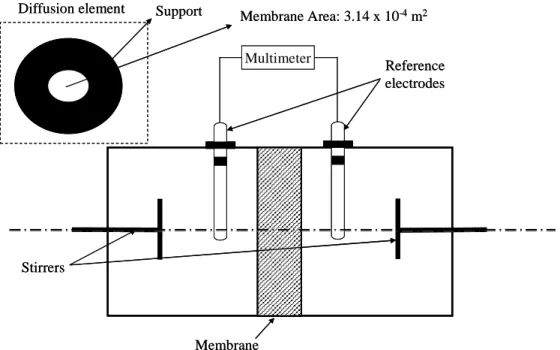
Figure 2.1 – Picture illustrating the unit used to obtain the permselectivity of membranes
Figure 2.2 – Schematic representation of the unit used to measure the permselectivity of membranes.
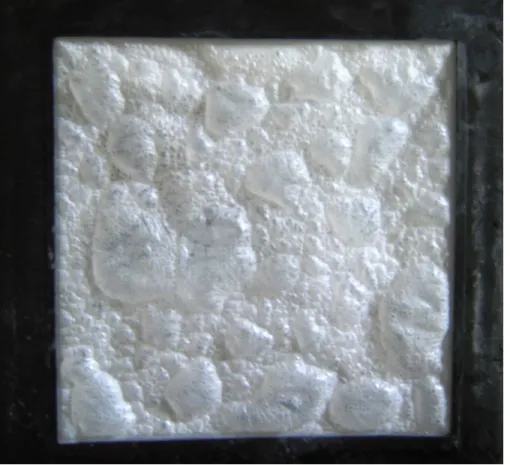
Figure 2.3 – View of the blistered carboxylic layer of membrane A (40 x). Figure 2.4 – Schematic representation of the membrane cell setup.
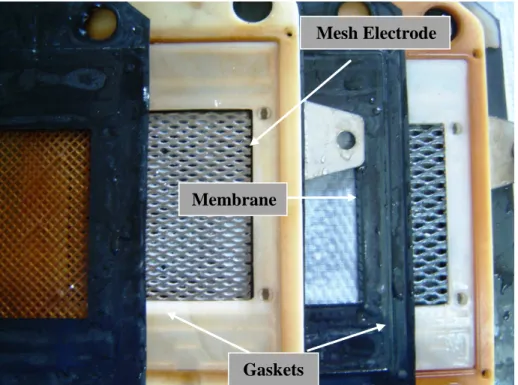
Figure 2.6 – View of the different components of the membrane cell using mesh electrodes.
Figure 2.7 – Shell and tube heat exchanger used for heating the electrolyte solutions.
Figure 2.8 – Air trap placed before the membrane cell inlet. Figure 2.9 – Gas-liquid separator.
Figure 2.10 – Ex-situ membrane dimensional changes during the start-up of a membrane cell for type A membrane.
Figure 2.11 – Outlet (anolyte and catholyte) temperature history.
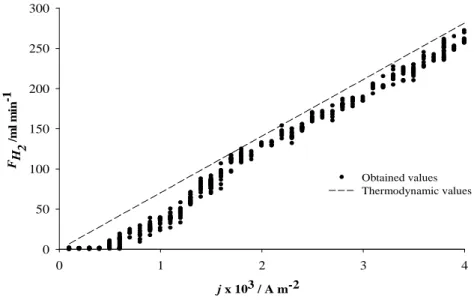
Figure 2.12 – Hydrogen gas flow rate as a function of current density; the thermodynamic hydrogen flow rate based on the applied current was added as a reference.
Figure 2.13 – Polarization curves for type B, E and F membranes. Figure 2.14 – Blister schematic representation (adapted from [21]). Figure 2.15 – View of a blistered membrane.
Figure 2.16 – Cell ohmic resistance (Rohm) as a function of current density. Figure 2.17 – Polarization curve for membranes with and without blisters - lines were introduced to improve readibility.
Figure 3.1 – Process flow diagram of the membrane cell setup used in this work: Membrane flow cell (MP Cell); electrolyte vessels (R1, R2); peristaltic pumps (P1, P2); heat exchanger (H1, H2); thermometer (T1); gas-liquid
absorption (R3, R4); gas-liquid separator (S1, S2).
Figure 3.2– Comparison between predicted cell voltage and experimental results (R2 = 0.9863) in terms of cell voltage.
Figure 3.3 – Cell voltage at 1.5 kA m-2 and as a function of: a) feed flow rate and temperature of the cell; b) brine (anolyte) and sodium hydroxide (catholyte) concentrations.
Figure 3.4 - Impedance spectra (Nyquist plot) of the membrane cell.
Figure 3.5 - Ohmic resistance as a function of the current density ([NaCl] =300 g L-1; [NaOH] =28 wt.% and T=75 °°°°C).
Figure 3.6 - Anolyte void fraction as a function of the current density ([NaCl] =300 g L-1; [NaOH] =28 wt.% and T=75 °°°° C).
Figure 3.7 - Electrolyte conductivity at different temperatures and brine concentrations: a) anolyte and b) catholyte.
Figure 3.8 – Ohmic resistances (R) as a function of brine concentration. Figure 3.9 – Ohmic resistances as a function of caustic concentration.
Figure 4.1– Polarization curves obtained for the solid and mesh nickel electrodes.
Figure 4.2 – Cathode overpotential as a function of the current density for solid and mesh electrodes - lines were introduced to improve readibility. Figure 4.3 – Tafel polarization curves for solid and mesh nickel electrodes.
Figure 4.4 – Nyquist and bode plots (figures a) and b) respectively) for HER on the solid and mesh nickel electrodes measured at 25 A m-2. Dots – experimental data; lines – fittings of the equivalent circuits.
Figure 4.5 - Nyquist plots for HER on the solid nickel electrode measured at current densities between a) 25 A m-2 and 300 A m-2; b) 400 A m-2 and 700 A m-2 and c) 800 A m-2 and 1.00x10³ A m-2. Dots – experimental data; lines – fittings of the equivalent circuits.
Figure 4.6 – Randles equivalent electrical circuit.
Figure 4.7 – Nyquist plots for HER on the mesh nickel electrode measured at current densities between a) 25 A m-2 and 300 A m-2 and b) 400 A m-2 and 800 A m-2. Dots – experimental data; lines – fittings of the equivalent circuits.
Figure 4.8 – Equivalent circuit used to fit the impedance data obtained for the cathode mesh electrode.
Figure 4.9 - SEM image of the surface of the cathode mesh electrode.
Figure 4.10 – Charge transfer resistance as a function of the applied overpotential, for HER on nickel electrodes (solid and mesh).
Figure 4.11 – Double layer capacitance as a function of the applied overpotential for HER on nickel electrodes (solid and mesh).
Figure 4.12 – Inverse of charge transfer resistance obtained from impedance data as a function of overpotential for the HER on nickel cathodes.
of the current density, and as function of the inverse of charge transfer resistance obtained from impedance data.
Figure 4.14 - Cathode overpotential as a function of the current density for solid, mesh and coated mesh electrodes.
Figure 4.15 – Nyquist plots for the HER on the mesh and coated mesh nickel electrodes measured at 25 A m-2: a) complete spectra and b) high frequency region.
Figure 5.1 - Schematic representation of a bipolar plant where three types of membranes (M1, M2 and M3) were installed in three different electrolyzers. Figure 5.2 - Schematic representation of the comparative voltage and mechanical strength of membranes M1, M2 and M3.
Figure 5.3 - Polarization curves obtained at 0, 12 and 24 months online (MOL) for the membrane M1, electrolyzer E1 – lines were introduced to improve readability.
Figure 5.4 – Dimensionless slope of polarization curves as a function of months online for each type of membrane – lines were introduced to improve readability.
Figure 5.5 – Dimensionless corrected voltage as a function of the month online – lines were introduced to improve readability.
Figure 5.6 – Dimensionless chlorine current efficiency (
ξ
Cl 2*
) as a function of months online (MOL) – lines were introduced for improving the readability. Figure 5.7 – Dimensionless specific energy consumption per ton of chlorine (corrected for 5 kA·m-2, 32 % NaOH and 90 ºC) for each electrolyzer as a function of months online (MOL) - lines were introduced for improving the readability.
Figure 5.8 – Dimensionless average maintenance costs per month of operation for each electrolyzer.
Figure 5.9 – Dimensionless average energy cost per ton of chlorine produced for membranes M1, M2, M3 as a function of months online (MOL).
Figure 5.10 –Dimensionless total process costs per ton of chlorine as a function of months online (MOL): a) complete plot and b) zoom in for the last months of operation. - lines were introduced for improving readability. Figure 5.11 – Dimensionless average total process costs per ton of chlorine as a function of months online (MOL) for membranes M1 and M3.
Table 1.1 – Equilibrium electrode potentials of the half electrochemical reactions taking place in a typical chlor-alkali membrane cell [4].
Table 1.2 – Summary of transport processes to charge transport (adapted from [7]).
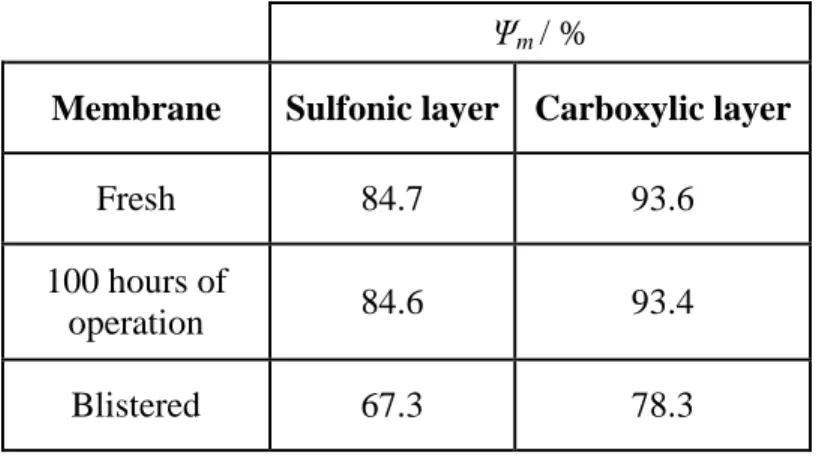
Table 2.1 – Permselectivity of membrane A under different conditions: fresh membrane, membrane with 100 hours of operation and a blistered membrane. Table 2.2 – Characteristics of the membranes used.
Table 2.3 – Slope (k) and interception (E0) of the polarization curve, and corrected slope for zero gap cell and reference values from the suppliers, for type B, E and F membranes.
Table 2.4 – Ohmic resistance of the membrane cell and conductivity of type B, E and F membranes.
Table 3.1 – Range of the operating variables.
Table 3.2 – Operating conditions of the experiments suggested by the design. Table 3.3 – Operating conditions of the experiments performed and the results in terms of voltage, ohmic and membrane resistance and average gas void fraction (
φφφφ
).Table 3.4 – Influence of the cell temperature on the conductivity of the membrane and on the electrolytes at a current density of 0.5 kA m-2.
Table 4.1 – Estimated parameters for solid (12 mm gap) and mesh electrodes (5.5 mm gap).
Table 4.2 – Tafel slopes (b), exchange current densities (j0) and charge transfer coefficients (
α
) of HER at nickel solid and mesh nickel cathodes determined from the polarization curves.Table 4.3 – Parameters Q and S obtained directly from the polarization curve for j < 1 kA m-2 (Q-factor method) (Table 1) and calculated from the kinetic data in Table 4.2.
Table 4.4 – Charge transfer resistance and double layer capacitance of the cathode (solid electrode) obtained by fitting the experimental results to the equivalent circuit.
Table 4.5 – Charge transfer resistance and double layer capacitance of the cathode (mesh electrode) obtained by fitting experimental results.
Table 4.6 – Tafel slopes, exchange current densities and charge transfer coefficients of HER at nickel solid and mesh nickel cathodes determined from the EIS analysis.
Table 5.1 – Dimensionless slope of the polarization curve ( k*) for each type of membrane at the beginning of operation (month 0).
Chapter 1
– Introduction1.1. Chlor-alkali process
The chlor-alkali industry is one of the major electrochemical processes producing mainly chlorine and sodium hydroxide (caustic soda). Chlorine and sodium hydroxide are among the most produced chemicals in the world. They are used in the manufacturing of a variety of intermediates in the chemical (e.g. polymers, pulp and paper), pharmaceutical (85 % of medicines use chlorine) and crop protection industries [1,2].
There are three different processes for the manufacture of chlorine and sodium hydroxide from saturated sodium chloride solutions (brine): mercury, diaphragm and membrane cell. Diaphragm cell was the first chlor-alkali technology developed to produce chlorine and sodium hydroxide [3-5]. It was invented in 1851 by Charles Watt and the first commercial cell was built in 1888. Few years later (1892), Hamilton and Castner developed the mercury cell process [3,4]. During approximately 100 years these two technologies were used to produce chlorine and sodium hydroxide all over the world. From mid-1950s efforts were made to replace the asbestos used as a separator on the diaphragm cell by a polymer membrane [3,4]. Although, serious problems were found concerning the short life-time of the membrane [3,4]. The erosion of the carbon anodes was also an issue in the membrane
cell process. In the early 1960’s, the increasing concern about the toxicological effects of asbestos and mercury used in the mercury cell led to the study and development of alternative solutions [3-5]. The development of metal anodes in the early 1970’s revolutionized the chlor alkali industry and foster the research to develop a suitable membrane-cell technology. In 1970, 30 % of the world production of chlorine and sodium hydroxide was by diaphragm cells and 70 % using mercury cells [3,4]. The first commercial membrane cell plant was commissioned in 1975 in Japan, which was the first country producing chlorine and sodium hydroxide using a membrane cell technology [3,4]. Fifteen years later, the membrane cell technology represented 15 % of the world production of chlorine and sodium hydroxide. Since then, many developments have made the membrane cell process more economical and environmentally safe [3,4]. The membrane cell technology accounted for 35 % of world’s capacity in 2002 whereas the diaphragm process was the most used representing 41 % [4]. In 2003, the chlorine production using the membrane technology exceeded the chlorine produced from diaphragm process and became the technology with the major world chlorine production capacity (40 %) [4]. The worldwide fraction of chlorine produced by membrane cells is expected to be 55 % in 2010 [2]. In 2008, the world chlorine production capacity was 62.8 million metric tons, distributed as shown in Figure 1.1 [2].
Figure 1.1 - Geographic distribution of the worldwide chlorine production in 2008
[2].
The chlor-alkali process involves the electrolysis of sodium chloride solution (brine) producing chlorine at the anode and sodium hydroxide (caustic soda) at the cathode, via the overall reaction [3-5]:
2 2 2O 2NaOH Cl H H 2 NaCl 2 + → + + (1.1)
To prevent the mixing of anolyte and catholyte a separator is used between the compartments. In the diaphragm cell a permeable diaphragm, usually made of asbestos fibers, is used to separate the anode from the cathode compartments. A weak caustic (30 %) stream contaminated with sodium chloride is produced by this technology [3-5]. On the other hand, a mercury cell produces a strong high purity caustic solution (50 %). A
mercury cell is divided in two units: the electrolyzer and the secondary electrochemical reactor (often called decomposer), Figure 1.2.
Figure 1.2 – Schematic representation of a chlor alkali mercury cell [3-5].
In the electrolyzer chlorine is produced at the anode and sodium amalgam forms at the cathode. Then, the sodium amalgam goes to a secondary electrochemical reactor where water is used to decompose the sodium amalgam into sodium hydroxide and mercury producing hydrogen. [4]. Moreover, water is reduced at the cathode and the sodium amalgam decomposed at the anode. The chlorine and sodium hydroxide produced via the mercury-cell are contaminated with trace amounts of mercury. The membrane cell process appeared as an alternative to the diaphragm and
mercury cells. It is very similar to a diaphragm cell but the permeable diaphragm is replaced by a permselective ion-exchange membrane.
CUF – Químicos Industriais is a chemical company operating in the fields of the organic and inorganic (chlor-alkali) intermediates to the chemical and pharmaceutical industries. CUF-QI is nowadays focused on the production of key raw materials (aniline, chlorine and caustic soda) for the production of MDI (methylene diphenyl diisocyanate) that is an intermediate to the polyurethane industry. Additionally, other products as hydrochloric acid, sodium hypochlorite, hydrogen, nitric acid, mononitrobenzene, sulphanylic acid and ciclohexylamine are also been produced.
CUF-QI is the third major chlorine producer in Iberian Peninsula [1]. Since 1959 CUF-QI has been producing chlorine and caustic soda by mercury cells. In 1992, the first membrane cell electrolyzers were installed and recently, in 2002, the mercury cell technology was entirely converted to the most modern membrane cells. The present thesis aimed developing knowledge on membrane cell technology and implementing characterization tools and operating procedures targeting the reduction of costs. Furthermore, it allows developing strategic knowledge at CUF to improve its autonomy and negotiation ability with suppliers.
1.2. Chlor-alkali membrane process
The membrane cell technology has several advantages compared to the other processes: high energy efficient, high purity of caustic and smaller environmental impact [3-5]. However, high brine quality is required to avoid membrane fouling. A membrane cell consists of two compartments divided by an ion-exchange membrane as can be seen schematically in Figure 1.3.
A saturated sodium chloride solution is fed to the anode where the chloride ions are oxidized to chlorine. The sodium ions migrate through the membrane to the cathode compartment and combine with the hydroxyl ions produced from the water reduction at the cathode where hydrogen is also produced. The reactions evolved in this process are the following [3-5]: At the anode: − − →Cl +2e Cl 2 2 (1.2) At the cathode: − − → + +2e H 2OH O H 2 2 2 (1.3) 1.2.1. Thermodynamics
The electrochemical reactions can proceed spontaneously or can be driven by an electric potential. Electrochemical cells in which the electrode reactions take place spontaneously (∆G < 0) are called galvanic cells. On the other hand, an electrochemical cell where a chemical reaction is driven by a power supply is termed electrolytic cell ( G∆ > 0). The Gibbs free energy (∆G) of an electrochemical reaction at constant temperature and pressure is given by [6]:
0
nFE G=−
∆ (1.4)
where n is the number of moles of electrons transferred, F the Faraday’s constant (the charge required to drive a mole of electrons) and E0 is the
standard electrode potential. ∆G is the minimum electrical work that must be supplied to an electrolytic cell to drive the electrochemical reactions. The standard electrode potential values can be easily found in the literature and the standard potential of a given electrochemical cell can be calculated by combining the potentials of the two half reactions (oxidation and reduction). The equilibrium electrode potentials (E0,a and E0,c) corrected for the electrolytes concentration, temperature and pressure are given by equation (1) and (2) [4,7]. + − + − + = [NaCl] p F RT . ) (T dT E d ) (T dT dE E E / Cl T a T a a ,a 2 1 2 2 0 2 0 0 0 2 log 303 2 25 2 1 25 (1.5) + − + − + = −2 2 2 2 0 2 0 0 0 2 2 log 2 303 2 25 2 1 25 E OH H O H T c T c c ,c a p a F RT . ) (T dT E d ) (T dT dE E (1.6) where 0 a E and 0 c
E are the anode and cathode standard electrode potentials (25 ºC and with reactants and products at unit activity), T the cell temperature, R the ideal gas constant,
2
Cl
p and 2
H
p refers to the partial pressure of chlorine and hydrogen, [NaCl] is the concentration of the sodium chloride solution and 2
2O
H
a and aOH−2the activity of water and hydroxyl ions
operating conditions in a chlor-alkali membrane cell. These conditions are: 90 °C, 1 bar, 3.5 M of NaCl and 10 M of NaOH.
Table 1.1 – Equilibrium electrode potentials of the half electrochemical reactions
taking place in a typical chlor-alkali membrane cell [4].
Reaction E0/V Anode Cl2(g) 2e 2Cl (aq) − − → + 1.23 Cathode 2H2O(l) 2e H2(g) 2OH (aq) − − → + + -0.99
Overall 2NaCl(aq)+2H2O(l)→2NaOH(aq)+Cl2(g)+H2(g) -2.23
1.2.2. Kinetics
An electrochemical reaction comprises the transfer of electrons between an electronically conducting electrode and an ionically conducting electrolyte. The rate of electrons transfer through this boundary phase is limited by an activation barrier that depends on the reaction mechanism. Furthermore, the reaction mechanism determines the rate of the electrochemical reaction. Since the activation barrier (electron energy at the Fermi level) depends on the potential of the cell, the kinetics of electrochemical reactions can be controlled by the applied potential. Current is directly related to the rate of electrochemical reactions and is related to the activation overpotential by the well known Butler-Volmer equation [6-8]:
− − − = RT α)ηF ( RT αηF j j 0 exp exp 1 (1.7)
where
η
is the activation overpotential, j0is the exchange current density andα
is the transfer coefficient. The activation overpotential of an electrochemical reaction is the difference between the applied potential (E) and the equilibrium cell potential (E0). This is related to the difference between the Fermi energy of the metal and the free energy of the electron in the redox system (electrolyte). At the equilibrium between the metal and the surrounding electrolyte these two levels of energy are equal and the resulting current density is known as exchange current density. When a potential difference is applied to the cell, the potential of the metal electrodes are changed relative to the electrolytes. The magnitude of the activation overpotential and then the rate of the electrochemical reaction is essentially determined by the interaction between the excess charge on the metal and the ions on the electrolyte [6-8]. Two limiting cases of Butler-Volmer equation (1.7) can be identified [6-8]: for small (< 5 mV) overpotentials the Butler-Volmer equation can be fitted to a linear relation: − = RT αηF j j 0 (1.8)
while for high overpotentials (> 200 mV) the Butler-Volmer equation is well described by the Tafel equation:
{
(j ) (j)}
k
where − = αF RT
k and is defined as the Tafel slope.
Electrocatalysis studies the factors affecting the activation barrier and how the rate of an electrochemical reaction can be improved. The electrocatalytic activity of the metals is strongly correlated with the electron structure of their atoms, which in turn determines the adsorption behavior of the species on their surface [6-8]. A good electrocatalyst is characterized by a high value of exchange current density. The so-called volcano plot relates the bond energy between the metal and the adsorbed species (e.g. hydrogen) with the exchange current density, Figure 1.4.
Figure 1.4 – Volcano plot for the hydrogen evolution reaction (HER) (adapted from
[4]). - lo g j0 / A c m -2
Maximum exchange current densities (j0) are achieved for Pt-group metals and intermediate values are found for the transition metals such as Cu, Au, Ag, Fe, Cu and Ni. The selection of the proper electrode material is a determinant factor for electrochemical reaction rate.
One of the most important problems in chlorine production is the occurrence of a side reaction producing oxygen at the anode. The standard reversible potential of the electrochemical oxidation of water (equation (1.11)) is lower than the chlorine standard potential, being then thermodynamically favorable: ) V 1.36 ( 2e Cl 2Cl− → 2 + − E0 =− (1.10) V) 1.23 ( 2e O 4H O 2H2 → + 2 + 0 =− − + E (1.11)
Due to the kinetics and reaction mechanism of the oxygen evolution reaction, low exchange current densities are obtained at noble metals and the exchange current densities for the chlorine evolution reaction are usually greater [4,6-8]. This way, the chlorine evolution reaction is predominant at intermediate and high current densities. To minimize the oxygen production, high chloride concentrations should be kept in the anode surface and the pH maintained in the optimum range of 2-5. In practice, saturated brine solutions are fed to the anode compartment to assure high coverage of chloride ions at the surface of the electrode. The main requirements for the anode material are: electrochemical stability against oxidation and chemical attack by NaCl,
HCl, Cl2, HOCl, ClO3- and O2, high electrical conductivity and high electrocatalytic activity for the chlorine reaction (high exchange current density) [4,6-8]. The cathode material must have high corrosion resistance in concentrated alkaline solutions, high stability at open circuit conditions and exhibit high electrocatalytic activity towards hydrogen evolution [4,6-8].
1.2.3. Charge and mass transport
Charge transport in aqueous electrolytes
In an electrochemical system charges are present as electrons and ions. The electrons (negatively charged) are transported through the external circuit from the electrode where they are produced (anode) to the electrode where they are consumed (cathode). The accumulation/depletion of ions on the electrode surfaces creates a potential and a concentration gradient that drives the ion transport through the electrolytes. There are three major
driving forces for charge transport: electrical potential gradient ( dx dE ), concentration gradient ( dx dc
) and pressure gradient ( dx dp
) [4,7]. Table 1.2
Table 1.2 – Summary of transport processes to charge transport (adapted from [7]). Transport Process Driving force Coupling coefficient Equation Conduction Jm Conductivity σ dx dE F z J i
σ
= Diffusion Jd dx dc Diffusivity D dx dc D J =− Convection Jc dx dp Viscosityµ
dx dp G J c µ =While in metal electrodes only an electrical potential gradient drives the electron charge transport, the motion of ions through electrolyte solutions can be driven by any of the transport mechanisms present in Table 1.2. In a membrane cell process the most relevant driving force to the charge transport is the electrical potential gradient (electric field) generated by the depletion of anions/accumulation of cations and accumulation of electrons on the anode surface and the depletion of cations/accumulation of anions and depletion of electrons on the cathode surface. Moreover, positively charged ions (cations) are transported from the anode to the cathode compartment. Conductivity measures the ability of a material to conduct electric current and is affected
dx dE
by the material properties and by the temperature. Conductivity is related to the resistance of a conductor by the following equation:
A
σ
R
c=
l
(1.12)where Rc is the conductor resistance, σ is the conductor conductivity, l is the length of the conductor and A is the cross-sectional area of the current flow. As shown in Table 1.2, charge transport due to an electric field (Jm) increases as the potential gradient increases. Ohm’s law relates the potential (E) applied to the cell with the rate of electric charge flow:
j R
E= (1.13)
where j is the charge flux (current density) through the cell.
The presence of gas bubbles in the electrolytes greatly affects the electrolyte conductivity and consequently the cell potential. The effect of bubbles on electrolyte resistivity is given by the Bruggemann equation [4, 9]:
2 3 0 1− − =( ε) ρ ρ (1.14)
where ρ is the resistivity (inverse of conductivity: σ
1
) of the electrolytes, ρ0 is the resistivity of pure electrolyte (free of gas bubbles) and
ε
is the gas void fraction.Charge and mass transport through the ion-exchange membrane
Ion-exchange membranes are classified by their function as a separator; cation-exchange membranes, that contain fixed negatively charged ions, are used in the electrolysis process to prevent the anion transport from the cathode compartment to the anode compartment [10]. The fixed ions of the membrane are in equilibrium with the mobile ions (referred to as counter-ions) whereas the ions that carry the same charge as the fixed charge (referred to as co-ions) are more or less efficiently excluded from the membrane matrix – Donnan exclusion effect - as illustrated in Figure 1.5.
-+
+
+
+
+
+
+
+
+
+
+
-+
+
-Membrane Potential x distanceFigure 1.5 – Illustrative scheme of Donnan exclusion effect [11].
The most important characteristics of an ion-exchange membrane are: high permselectivity for the counter-ions (exclusion of co-ions), high ionic conductivity, good mechanical, form and chemical stability [10]. The ion
permselectivity of an ion-exchange membrane is related to its ability to reject co-ions. Due to the Donnan exclusion effect the permselectivity is affected by the electrolyte concentration of the surrounding solution and by the ion-exchange capacity of the membrane. An ideal permselective membrane should totally exclude co-ions from the membrane matrix. The ionic conductivity of the membrane also depends on the concentration of the electrolyte solution which affects the swelling of the membrane (membrane water content). Furthermore, the mobility of the ions through the membrane matrix depends strongly on the water content of the membrane, on the interaction between the mobile and fixed ions (that depends on the valence, size and extent of hydration of the ions) and on the temperature. Water content increases the free volume inside the membrane matrix improving the ability of ions to move across the polymer [4,10]. The nature of the membrane polymer, the nature and concentration of the ion-exchange groups and counter-ions and the degree of cross-linking of the polymer determines the membrane water content. Moreover, membrane water content affects not only the membrane selectivity and conductivity but also its dimensional stability (i.e. dimensional changes between wet and dry states of the membrane) [10]. Additionally, the ion-exchange membranes used in the chlor-alkali industry must have low permeability to hydrogen, chlorine and
oxygen to prevent the hazardous mixture of these gases and to allow high gas purity production [4].
The water transport across the ion-exchange membrane is due to osmosis and electroosmosis. While the osmotic water transport through the membrane is the result of different transport rates of water and salts through the membrane under the effect concentration gradients, the electroosmosis is the water transported under the influence of an electric field. Moreover, the electroosmotic water transport results from the water molecules carried across the ion-exchange membrane in the hydration shell of the ions. The membrane water content is greatly affected by the water transported across the membrane [4,10].
Mass transport
Transport of the reactants from the bulk of the solution to the electrode surface and the removal of products from the surface are inherent steps in electrochemical reactions. When these steps are slow and or the electric field very high, the mass transport at the surface of the electrodes become rate controlling and adversely affects the rate of the electrochemical reaction; in the limit we may reach cR*→
0 and c*p→
0 (equation 1.7). This phenomenon is called concentration polarization and is often neglected
in the electrolysis process because the raw materials are supplied in excess and no limitations to the mass transport are normally found.
1.2.4. Electrochemical characterization techniques
In electrochemical systems there are three fundamental variables: current, potential and time. The relationship between current and potential, j-E curves, gives information about the overall performance of the system.
When a current is applied to the electrochemical cell an activation overpotential is needed for the reaction to proceed in a given direction. The electric field that results from the polarization of the electrodes drives the ion transport through the electrolytes and membrane whereas the electrons are transported across an external circuit. This way, the output cell potential is the sum of all these contributions (thermodynamics, reaction kinetics, charge and mass transport) and is given by the following equation [4,7]:
ohmic c a ,c ,a
E
η
η
η
E
E
=
0−
0+
−
+
(1.15)where E0,a and E0,c are the thermodynamic potential of anode and cathode reactions, ηa and ηc are the anodic and cathodic activation overpotentials, and ηohmic is the ohmic resistance to the charge transport through the electrolytes and the membrane. Substituting and rearranging equations that describe the activation overpotential (1.8) and the ohmic resistances (1.12) the following equation is obtained [4]:
)j R (R (j) ) k (k E* E= + a − c log + ele + m (1.16) where ) log( ) log( * E0,a E0,c ka j0,a kc j0,c E = − − + (1.17)
Subscripts a and b refers to the anode and to the cathode, respectively.
The current-density potential curve provides an overall evaluation of the membrane cell performance. Although, a more sophisticated technique is required to accurately study the different interfaces present in the cell: metal/solution interface and membrane/solution interface [7]. The electrochemical impedance spectroscopy (EIS) allows the differentiation between the different components of an electrochemical membrane reactor. Similarly to the electrical resistance, the impedance of an electrochemical system measures the ability of a system to influence the electrical current flux. While the electrical resistance is time and frequency independent, impedance varies with these two parameters and is defined as [7]:
) ( ) ( t j t E Z = (1.18)
where E (t) and j (t) are the potential and current density at time t, respectively. A small sinusoidal perturbation (e.g.E(t)=E0cos(wt)) is applied to the potential or to the current and the system response monitored. Usually, the impedance of a system is represented in Nyquist and Bode plots and gives detailed information about the electrochemical processes.
Energy consumption is the major factor affecting the chlor-alkali production cost. Therefore, it is the most import feature of the process performance. The energy consumption calculation requires knowledge about the potential and current efficiency and is given by [4]:
NaOH q c E E P ξ 1 = (1.19)
where Eq is the electrochemical equivalent of caustic soda, ξNaOHis the
caustic soda current efficiency and E the potential across the electrolyzer. The caustic soda current efficiency is obtained from the ratio of the total caustic soda produced by the amount of caustic soda that is expected to produce. The Faraday’s law of electrolysis gives the expected amount of caustic soda produced when a given amount of current is applied to the cell (current) over a certain period of time (t) [6]. This is given by:
F It E
mNaOH = q (1.20)
where I is the applied current and t is the time.
1.3. State of the art of the chlor-alkali membrane process
In the last 30 years many improvements were made in the chlor-alkali industry. There are two main milestones that revolutionized this process, the development of metal anodes and the changeover of the old diaphragm and mercury technologies to membrane cells [3]. Nowadays, the membrane cell
process is the most used in the world [1,2]. The complete conversion to the membrane technology is expected in the next years due to the mandatory deadline (2020) to phase out the mercury cells in Europe [1]. CUF-QI converted the old mercury cells to the state of the art membrane cell technology already in 2002. At that time, the newly developed Azec-B1 electrolyzers from Asahi Glass were installed and represented 75 % of the total chlorine production capacity of the company. These electrolyzers have a narrow gap between membrane and electrodes. DSA anodes and Raney nickel cathodes are currently used as electrodes. Different types of membranes have been tested.
1.3.1. Electrodes Anode
The primarily materials used in the chlor-alkali industry as anodes were platinum, magnetite and carbon. Platinum was expensive and magnetite had poor conductivity leading to really low current densities (0.4 kA m-2). The graphite anodes were widely used from the 1900s to the late 1960s. However, their short life (6-24 months), the products contamination with chlorinated hydrocarbons and their negative effect on the cell performance led to the replacement of the graphite anodes by coated metal anodes. Many mixed oxide coatings were tested without success until the discovery of titanium
anodes coated with a layer of the mixed dioxides of titanium and ruthenium in 1965 by Henry Beer. A few years later these anodes were commercialized by DeNora under the trade name of Dimensionally Stable Anodes (DSA) [3-5].
The DSA anodes have very high electrocatalytic activity and selectivity towards anodic chlorine evolution, exhibiting then low overpotential. These electrodes are also very stable during a long period of time; their expected lifetime is 8 years. While titanium dioxide is catalytically inactive but gives stability to the coating, the ruthenium dioxide exhibits high exchange current densities for the chlorine reaction [4,6,8]. When the ruthenium dioxide content is higher than 30 % the obtained Tafel slopes are in the range of 40-60 mV. However, with extend usage the anode can deactivate and can achieve Tafel slopes of 300-400 mV (at this point the anode is considered deactivated) [13]. The deactivation mechanism has been investigated by several authors. It is known that for ruthenium dioxide (RuO2) contents below 20 wt. % the chlorine overpotential increases significantly [13-16]. Generally, the anode deactivation mechanism is attributed to the consumption of RuO2 and/or to the formation of an insulating TiO2 layer at the titanium/coating interface [13-16]. The blockage of the electrode surface by impurities can also give rise to the loss of active sites. The addition of iridium dioxide (IrO2) to the DSA anode coatings is a
common procedure as it prevents the Ru corrosion; as a result higher anode durability can be achieved. The anolyte pH has an important effect on the reaction rate of the water oxidation reaction and on the lifetime of the anode. At high anolyte pH, the water oxidation reaction is favored (pH > 5) and the dissolution of the coating is more likely to occur (pH >12). Low pH (< 2) can lead to titanium dissolution [4,8].
Alternative anode compositions have been investigated and the most promising are: titanium substrate coated with a mixture of platinum and iridium, cobalt spinels, palladium oxide based coatings and platinates [4, 17, 18].
Cathode
Carbon steel cathodes had been used in diaphragm cell since 1910. After the development and commercialization of the ion-exchange membranes, carbon steel cathodes were replaced by stainless steel and nickel cathodes in the membrane cells [3-5]. In the early 90’s the nickel cathodes come into general use due to their excellent corrosion resistance in the chlor-alkali cells, i.e. high stability in high concentration sodium hydroxide solutions. Another important concern on the choice of the cathode material is its resistance against oxidation (corrosion) by chlorine-based chemical species that can be reduced in the anode during shutdowns [3-5]. The improvement of the membrane cell performance made the energy savings a
crucial issue to the investigation of new high performance materials. As nickel is not the most suitable material in terms of electrocatalytic activity for the hydrogen reaction (HER), high surface nickel based cathodes were investigated and developed; i.e. metals with higher electrocatalytic activity for the HER (see Figure 1.4) were incorporated in a nickel substrates. Several techniques have been investigated for the preparation and characterization of nickel type coatings doped with different elements (e.g. Cr, Co, Ti, W, Mo and Fe) [19,20]. An activation overpotential of c.a. 500 mV is expected for the hydrogen evolution reaction (HER) at smooth nickel surfaces while 200 mV can be attained with Ni-Al type Raney nickel cathodes [4]. Significant energy savings, above 10 %, arise from using cathodes with lower overpotential.
1.3.2. Membranes
The first generation of commercial membranes (1975) was able to directly produce sodium hydroxide solutions of 2-40 wt. %. They were made from fluoropolymers functionalized with sulfonic groups. However, the current efficiencies were low being the highest efficiency (85 %) attained for concentrations in the range 10-15 wt. % NaOH [4]. These membranes were relatively thick with heavy reinforcement cloths and the electrode gap was 9 mm. Due to these membrane characteristics the typical operating potentials
were high (3.8 to 4.0 V at 2.5 kA m-2) that combined with low current efficiency give a DC energy consumption of 3300 kWh ton-1 of caustic soda [3]. Additionally, the current efficiency decline was quite fast due to impurities precipitation in the membrane structure. Later on, the development of a laminated membrane structure with two different functional groups revolutionized the chlor-alkali membrane cell process by improving the current efficiency and reducing the operating potential.
Nowadays, the commercially available membranes in the chlor-alkali industry are bilayer membranes with a polymeric matrix made of tetrafluoroethylene. Sulfonic and carboxylic groups are used as fixed ionic groups on the anode and cathode side of the membrane, respectively (Figure 1.6).
Figure 1.6 – Illustrative scheme of the structure of different commercial membranes
The use of different ionic groups, as illustrated in Figure 1.6, has significant effects on the permselectivity and conductivity of each layer. Furthermore, the sulfonic groups are excellent proton conductors while the carboxylic groups are highly permselective to cations due to their lower water content [10]. The mechanical properties of the membranes (tensile and tear strength) are greatly improved by reinforcements; a PTFE woven cloth is used to reinforce the membrane structure to prevent damage or tearing of the membrane. There are different types of cloths to reinforce the membranes and in some cases sacrificial fibers are also used. More and thinner fibers increase mechanical strength besides providing low voltage and high current efficiency [4,19]. To prevent the adherence of bubbles to the membrane surface, the membranes surfaces are made hydrophilic [4,10]. The typical structure of a commercial ion-exchange membrane is shown in Figure 1.7.
Figure 1.7 – Schematic representation of a commercial ion-exchange membrane
(adapted from [22]). Sulfonic layer
Reinforcement (PTFE woven cloth)
Carboxylic layer
Surface coating (gas release)
There are three main manufacturers of ion-exchange membranes to the chlor-alkali industry: DuPont (USA), Asahi Glass (Japan) and Asahi Kasei (Japan). The differences between suppliers are related to the modifications made on the polymer and on the functional groups, the type of reinforcement used and other chemical and mechanical details. The membranes commercially available for the chlor-alkali industry can be divided in two classes regarding their characteristics: high performance and high mechanical strength membranes. Low resistance membranes are more adequate to narrow gap electrolyzers due to their low voltage. On the other hand, high strength membranes are used in more robust electrolyzers where the main requirement is high physical strength. Today, membranes operate at higher current densities with current efficiencies of about 97 % producing a caustic soda stream of 32 wt. %. The typical DC energy consumption values are as low as 2100 kWh/ton of caustic soda [4].
1.3.3. Electrolyzers
A commercial membrane plant has several individual membrane cells, called elements, which are combined to form an electrolyzer. The electrolyzers can be classified in two categories with respect to their electrode configuration: monopolar and bipolar [3,4]. Monopolar electrolyzers are connected in series and the individual cells in parallel,
forming an electrolyzer with high current and low voltage. On the other hand, the bipolar electrolyzers are connected in parallel and the single elements in series. This results in a low current and high voltage electrolyzer. The main differences between these two arrangements are related to the capital cost of the cells and the electrical supply system (rectifiers and transformers) [3,4]. Nowadays, there are five suppliers of membrane cell electrolyzers (monopolar and bipolar): Asahi Kasei (Japan), Chlorine Engineers (Japan), Eltech (USA), Uhde (Germany) and Ineos Chlor (UK). Currently, the bipolar technology is the most popular due to the trend of higher current density operation [4].
1.4. Motivation and Outline
The present thesis aims to study the chlor-alkali membrane cell technology, which is the process used by CUF-QI. Despite being a mature technology little information can be found in the literature about this process. Furthermore, there are only three main manufacturers of the cation exchange membranes and a few suppliers for electrolyzers. These suppliers dominate the knowledge of this technology. The process performance has a great impact on the energy consumption that is the major cost factor in the production cost; this way, it is desirable to operate at high performance. The need for further know-how to continuously improve the process performance
and the negotiation ability of CUF-QI were the major motivations for this research work.
The main questions that this thesis addresses are:
• Which factors affect the most the cell performance and what is the contribution of each of them?
• How can we do the characterization of each component of the cell?
• What are the strategies for decreasing the operating costs of the process?
The first part of this work is focused on the development of the experimental setups needed for the research work: a unit to characterize the membrane permselectivity and an experimental chlor-alkali membrane cell. This was a rather great challenge because information on this subject is scarce [22-24]. Chapter 2 describes the experimental setups developed and their performance.
After optimizing the experimental electrochemical membrane reactor, the effect of the operating parameters (current density, feed flow rate, brine and caustic concentration and temperature) on the overall performance was studied and reported in Chapter 3. The electrochemical impedance spectroscopy (EIS) was used to characterize in situ the ohmic resistances of the cell.
Following the characterization of the ohmic resistances of the cell, the EIS was used to study the hydrogen evolution reaction (HER) on nickel cathodes. Solid and mesh electrodes were investigated and the kinetic parameters of HER obtained. This is discussed in Chapter 4.
Chapter 5 presents a benchmarking methodology of three different types of ion exchange membranes. This also allows deciding the best moment for membrane replacement. The methodology is based on the average cost history of the chlorine produced. The performance of three different membranes operating at CUF-QI industrial plant were assessed and compared.
Finally, Chapter 6 presents the conclusions of this work and suggests future developments and lines of work.
1.5. References
[1] – www.eurochlor.org/, accessed in May 2010. [2] – worldchlorine.com/, accessed in May 2010.
[3] – T. Navin, “Membrane Cell Technology - State of the art industry”, Eltech Systems Corporation, 2002.
[4] – T. F. O'Brien, T. V. Bommaraju, and F. Hine, in Handbook of Chlor-Alkali Technology, Springer, New York, Volume I and V, 2005.
[5] - P. Schmittinger, Chlorine-Principles and Industrial Practice, 1st edition, Wiley-VCH (2000).
[6] – C.H. Hamann, A. Hamnett, W. Vielstich, in Electrochemistry, 2nd edition, Chapter 4 and 5, Wiley-VCH (2007).
[7] – R. O’ Hayre, Suk- Won Cha, W. Colella and F. B. Prinz, in Fuel Cell Fundamentals, Wiley, New York (2006).
[8] – V.S. Bagotsky, in Fundamentals of Electrochemistry, 2nd edition, Chapter 15, 17 and 26, Wiley Interscience, New Jersey (2006).
[9] – Ph. Mandin, J. Hamburger, S. Bessou, G. Picard, Electrochimica Acta, 51 (2005) 1140-1156.
[10] – H. Strathmann, in Ion-Exchange Membrane Separation Processes, Chapter 3, Membrane Science and Technology Series, 9, Hungary (2004). [11] – M. Mulder, Basic Principles of Membrane Technology, Chapter 5, Kluwer Academic Publishers,2nd edition, Netherlands (1997).
![Figure 1.1 - Geographic distribution of the worldwide chlorine production in 2008 [2]](https://thumb-eu.123doks.com/thumbv2/123dok_br/15155165.1013239/35.774.167.610.102.440/figure-geographic-distribution-worldwide-chlorine-production.webp)