Trimming and clustering sugarcane ESTs
Guilherme P. Telles
1and Felipe R. da Silva
2Abstract
The original clustering procedure adopted in the Sugarcane Expressed Sequence Tag project (SUCEST) had many problems, for instance too many clusters, the presence of ribosomal sequences, etc. We therefore redesigned the clustering procedure entirely, including a much more careful initial trimming of the reads. In this paper the new trimming and clustering strategies are described in detail and we give the new official figures for the project, 237,954 expressed sequence tags and 43,141 clusters.
INTRODUCTION
The Sugarcane EST project (SUCEST) produced 291,689 expressed sequence tags (ESTs) (Adams et al., 1991). In the pipeline of the project it was important to clus-ter together sequences from the same transcript molecule and to obtain a representative sequence for each group. Clustering was important to evaluate the redundancy of the set of ESTs during library production and sequencing, and at the end of the project. Clustering also produces a smaller set of sequences which facilitates investigation of the data by biologists and computer scientists (Telleset al., 2001).
As in any other EST project, the raw SUCEST se-quences sometimes contained unwanted segments like polyadenylation (poly-A), regions with low base quality, fragments from vectors and adapters, and slippage. Some reads may also came from ribosomal RNA or contaminant DNA. Such segments are unwanted because they introduce similarity between ESTs that has no relevance for cluster-ing, and removal of such segments is essential to cluster correctly.
Trimming and clustering procedures were established at the beginning of the SUCEST project in July 1999, but the amount of data grew each day and it soon became clear that the trimming and clustering procedures were both not good enough. SUCEST data-users were pointing out many problems when we designed and implemented new trim-ming and clustering procedures.
A trimming procedure is essentially the task of sear-ching ESTs for unwanted regions, identifying them and then deciding whether to remove the unwanted region or to discard the entire EST. Trimming has already been de-scribed for UniGene (www.ncbi.nlm.nih.gov/UniGene), TIGR Gene Indices (Quackenbush et al., 2000) and STACK (Milleret al., 1999).
In the SUCEST project, clustering was always per-formed using a fragment assembler for the whole set of ESTs. This is different from the procedure used by Uni-gene, TIGR Gene Indices, JESAM (Parsons and Rodri-gues-Tomé, 2000) and STACK which use some kind of pairwise comparison to estimate distance between ESTs, build clusters and then, if ever, assemble the clusters sepa-rately. In its first version, SUCEST clustering scheme pro-duced 81,223 clusters (41,582 singletons) while the current version has 43,141 clusters (16,838 singletons).
In this paper we describe trimming in detail, because it had a major influence on the work performed by the as-sembler at the clustering stage. We have also compared the results of different assemblers for our set of ESTs before we decide in favor of the CAP3 program (Huang and Madan, 1999). Although we had confidence in the fragment assem-blers comparison performed by Lianget al. (2000), three is-sues motivated us to produce our own comparison routines. Firstly, we wanted to examine the assembly results for our particular set of ESTs, secondly, we were using ESTs qual-ity data and, thirdly, we used parameters for the assemblers that differ from the default ones. We also introduce the trimming and clustering procedures early in the project. Our intention in this paper is not to emphasize our im-proved results but to show the remarkable effect that ‘noi-se’ (i.e.unwanted sequences) can have on clustering.
METHODOLOGY AND RESULTS
Clone libraries were prepared as described by Vettore et al. (2001) and sequenced by ABI 377 (Applied Biosystems) machines. After being processed by the phred base-calling program (version 0.980904.e, www.phrap.org) and by the phd2fasta program (version 0.990622.d, www.phrap.org), ESTs were stored as fasta and quality files in the 5’ to 3’ orientation. These files con-tained 291,689 sequences with an average length of
1
Bioinformatics Laboratory, Institute of Computing, UNICAMP, CP 6176, 13083-970 Campinas, SP, Brazil. 2
864.5 ± 186.3 bases. The average number of bases with a phred quality value greater than 20 per read was 399.5 ± 151.3. The programs were run on an 8 GB RAM AlphaServer ES40 (Compaq) with 2 processors at 667 MHz executing the OSF1 operating system (version 4.0G).
Trimming
An EST set may contain unwanted sequences made up of poly-A fragments, vector and adapter fragments, low quality ends, ribosomal RNA, contaminant DNA and slipped sequences. When clustering the sequences to pro-duce groups of transcripts, these unwanted sequence intro-duce irrelevant relationships between reads. Trimming is the removal of such regions from ESTs or the removal of entire ESTs from the set.
Trimming refined the reads in several steps, using the blastall program (version 10/31/2000, www.ncbi.nlm. nih.gov) that implements the BLAST algorithm (Altschul et al, 1997), the cross-match program (version 0.990319, www.phrap.org), the SWAT program (version 0.990319, www.phrap.org) and ad hoc pattern-matching programs written in Perl (version 5.6.0, www.cpan.org). Parsers (pro-grams that do some kind of interpretation on data based on its syntactical structure) for the output of these programs were written in Perl, and bash (version 2.04.0(1), www.gnu.org) scripts were used to filter, build histograms and summarize data. Some regions, like poly-A, were searched several times, each time with a different recogni-tion criterion. Trimming was tuned to keep as much as pos-sible from each sequence.
The trimming scheme is summarized in Figure 1. The first step was the removal of ribosomal RNA sequences, and for this the ESTs were compared against 18S rRNA from Zea mays (GenBank AF168884), 5.8S rRNA from Platanus occidentalis (GenBank AF162215) and 26S rRNA fromLambertia inermis(GenBank AF274652) us-ing the BLAST program. The choice of these rRNA sources was based on the similarity between them and sugarcane rRNA. A match with an e-value less than 10-10 was the threshold to discard a read, a total of 8,473 reads being re-moved in this step.
The next step was vector and adapter sequence mask-ing, using the cross-match program that replaced bases with an X if they were very similar to vector and adapter se-quences used in the clone libraries. This was followed by removing the vector and adapter sequences themselves from the reads by deleting the regions marked with an X. The actual treatment given to these ambiguous regions de-pended on where the X-regions were found and how many there were, an X-region being a contiguous masked sub-se-quence in a read.
Classes were devised based on the analysis of histo-grams of the lengths of X-regions, distance of the X-region
from the 5’ and 3’ ends and on the analysis of the number of ESTs falling into each class. These classes were as follows:
Class 1. There were two distinct X-regions in the read, this being what is to be expected as the result of se-quencing a clone with a small insert. In this case only the sequence between the X-regions was kept.
Class 2. There were more than two X-regions in the read, probably because of a low-quality vector. In this case we did not change the read.
Class 3. There was only one X-region of no more than 300 bases that was less than 50 bases away from the 5’ end. This was the case when the region from the X-region down to the 5’ end probably consisted of vector sequences ex-tending from the sequencing priming site to the cloning
site. In this case we removed the X region together with the 5’ end.
Class 4. There was only one X-region with more than 300 bases that was less than 50 bases away from the 5’ end. In this case the clone probably had no insert so we dis-carded the whole read.
Class 5. There was only one X-region of at most 300 bases that was 51 to 300 bases from the 5’ end. In this case it was hard to decide what the insert was so the read was not changed.
Class 6. There was only one X-region with more than 300 bases that was 51 to 300 bases from the 5’ end. This probably occurred when the X-region and the 3’ end con-sisted of a vector sequence after the cloning site. In this case we removed both the X-region and the 3’ end.
Class 7. There was only one X-region of any length and it was at least 300 bases away from the 5’ end. In this case we again removed both the X-region and 3’ end be-cause the deleted region probably consisted of a post clon-ing-site vector sequence.
While removing X-regions any poly-A fragment close to them was also removed. A poly-A fragment was considered to be any region that scored at least 8 when aligned with a probe sequence of As (adenines) only. The scoring scheme added 1 for a match and -2 for a mismatch, gaps were given a high penalty (-8) because they should not occur. The poly-A had to be at most 10 bases away from X-regions. Alignments were performed using the SWAT program. Depending on the reading direction a poly-A can be read as poly-T, so a poly-T probe was used as well. The removal of X-regions discarded 7,780 sequences.
The next step was quality-trimming, for which a win-dow of 20 bases was slid over every sequence in the set. Starting at the 3’ end, the window was slid one base at a time, dropping the extreme base until 12 or less bases in the window had a quality value below 10, the process being re-peated for the 5’ end. After quality-trimming, X-regions not further than 10 bases away from an end were removed. Quality-trimming removed 1,708 sequences from the set.
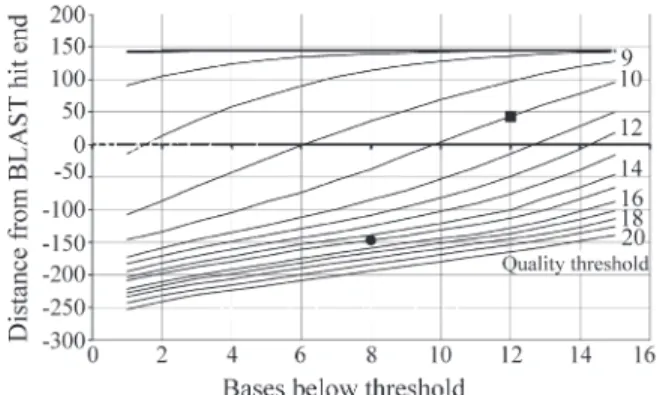
The quality-trimming thresholds were chosen as fol-lows. A subset of 10,000 SUCEST sequences was ran-domly selected on the basis of (i) high similarity (BLASTX e-value below 10-20) with protein sequences in the NCBI nr database (www.ncbi.nlm.nih.gov), (ii) the length of the matching nr sequence was enough to cover the EST and (iii) the region of similarity did not extend to the end of the EST. By using these criteria we had matches showing a re-gion of similarity that could, potentially, extend to the end of an EST. Cases where the region of similarity did not ex-tend to the end of the EST may have been due to the low quality of the EST sequence.
The exact point where the region of similarity ended, the ‘BLAST hit end’ (BHE), was recorded for each EST in the set and then the set went through the quality-trimming procedure with varying values for the length of the window,
quality threshold and number of bases below threshold. Ob-viously, high quality thresholds and low numbers of bases produced shorter reads. The difference between the trimm-ed position (TP) and the BHE (TP-BHE) was calculattrimm-ed and averaged. The results for a 20-base quality window are shown in Figure 2. The square in the figure indicates the se-lected threshold values and shows that, on average, 43 bases after the BLAST hit end were kept.
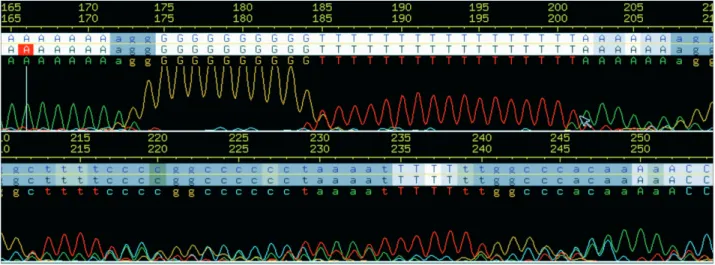
The next step was slippage-trimming, slippage being a sequencing artifact (Anon, 1998) which produces ‘ech-oed’ bases in sequences,i.e.for one occurrence of a nucleo-tide in the template the chromatogram shows several peaks (q.v. Figure 3). Although bases sometimes appeared with high ‘background noise’ (e.g.bases 215-230), generally the intensity of the echoed peak was such that the base caller in-correctly assigned a high quality value for the fake bases (e.g.bases 175-205) and this prevented quality-trimming of these artifacts.
A method to identify slipped reads based on the se-quence of the read was devised, this method being able to find reads having many regions with repetitive bases (ech-oed regions). The product of ech(ech-oed regions lengths (with at least 5 bases) was evaluated for each sequence. Echoed regions larger than 10 bases contributed 10 to the product only. Sequences with a product greater than 108and echoed regions covering more than 20% of its length were dis-carded completely. This was the procedure adopted in most cases when slippage was caused by a long poly-A sequence at the 5’ end of the read. But when a long poly-A at the 3’ end was increasing the product only the poly-A (together with the remaining 3’ sequence) was discarded. The thresh-old for poly-A identification in this situation was an align-ment with a score of at least 160. These thresholds were determined by varying the parameters for echoed region recognition, evaluating the products, and looking at several chromatograms in many product ranges. Slippage-trimm-ing removed 15,621 reads.
The next step in the trimming procedure was another poly-A/T removal round, where poly-A/T scoring at 280 and over was removed from sequences. Smaller poly-A/T,
scoring at least 30 and less than 20 bases away from one of the ends was also removed. This step removed 2,006 reads.
The final step was to remove any read with less than 100 bases or with less than 50 bases having phred quality greater or equal to 20. A total of 18,147 reads fell in this case.
At the end of all the steps described above, 237,954 reads were left with an average length of 641.6 ± 139.8 bases (152.5 Mbp in total). The average number of bases with a phred quality greater or equal to 20 per read was 397.8 ± 120.1.
In contrast, the trimming method formerly used in the SUCEST project was simpler. That method started with only one round of very restricted poly-A removal, search-ing for 12 or more consecutive As adjacent to the vector. The final step was quality-trimming using the same scheme as above with a window length of 20, quality equal to 15 and the number of bases equal to 8. For the reads used in the quality window experiment this combination of thresholds discarded 137 bases from the reads on average (relative to the BHE) as shown in Figure 2. This method applied to the original set of SUCEST reads resulted in 261,609 reads with average length of 512.1 ± 114.8 bases. The average number of bases with a phred quality greater or equal to 20 per read was 392.4 ± 128.3.
BLAST was used to compare the ESTs from the orig-inal set of reads in the SUCEST database with the genomes ofXylella fastidiosa,Xanthomonas citri,Escherichia coli and other potential laboratory contaminants that could have been present in the libraries. A match of at least 100 bases and more than 90% identity resulted in the read being marked as probably resulting from contamination. A total of 114 ESTs were thus marked. Because there were so few matches, and the difficulty of deciding whether or not marked ESTs really were the result of contamination, these
ESTs were not removed by either of the trimming proce-dures.
Clustering
For the SUCEST project it was necessary to estimate the redundancy of the clone libraries as they were se-quenced, which could be achieved by joining similar tran-scripts into clusters. Clustering results allowed project coordinators to decide when to stop sequencing any partic-ular library.
Fragment assemblers were used for clustering. A fragment assembler is a program that takes a set of reads and their qualities as input, builds groups based on the over-laps of reads and creates a consensus sequence for the reads in each group.
Reads processed by the old trimmer were assembled using the phrap program(version 0.990319, www.phrap. org) with the arguments set to predetermined values (pen-alty -15, bandwidth 14, minscore 100, shatter_greedy) which made it more stringent and with quality data. This as-sembly, called ‘old-trim’, produced 81,223 clusters (41,582 singletons).
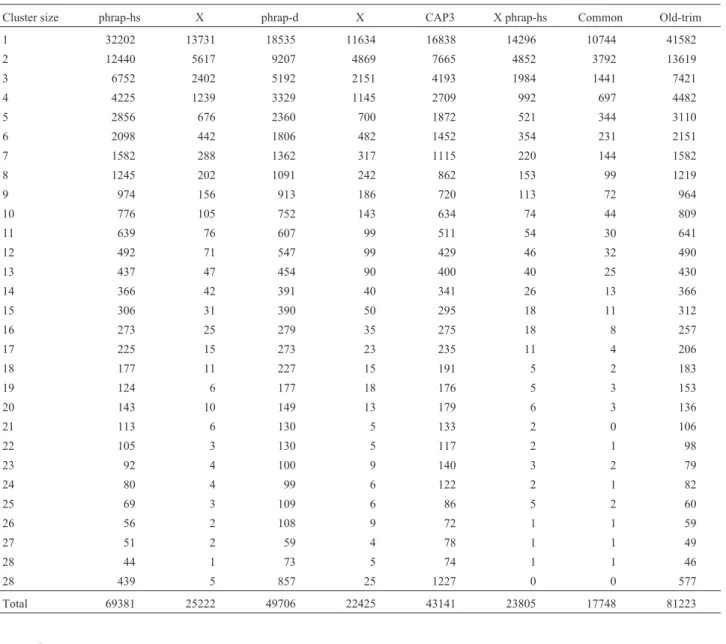
To cluster the reads trimmed by the new procedure, three different assemblies were performed and compared. Phrap was used with two sets of arguments, the default ar-guments (phrap-d assembly) and the more stringent argu-ments listed above (phrap-hs assembly). The CAP3 program was used with its default arguments. Quality data was used for every assembly. Table 1 shows the cluster size (number of ESTs in a cluster) distribution for the assem-blies, as well as the number of equal clusters between them. Equal clusters are those with the same reads.
Two tests were performed for the assemblies. The first verified ‘internal consistency’ by checking every clus-ter with two or more reads for discrepant reads. To be
discrepant, a read base must both disagree with the consen-sus base and have less than a 2% probability of being mis-called by the phred program. An x% discrepant read is a read with at least x% discrepant bases. Figure 4 shows the proportion of x% discrepant reads in each assembly, for values of x varying from 30 to 90 in steps of 10.
The second test verified the ‘external consistency’ of the assemblies by comparing the consensi produced by a given assembly to each other using BLAST. Percentage identity was evaluated for end-overlaps of 200 or more bases found between two clusters, and Figure 5 shows a plot of the percentage of clusters having an identity of more than 75% with other clusters in a given assembly with re-spect to the total of possible overlaps within that set of clus-ters.
Table I- Cluster sizes distribution for CAP3, phrap-d and phrap-hs assemblies by the new trimming procedure. The ‘X’ columns indicate the number of equal clusters between two assemblies, while the ‘common’ column shows the number of clusters equal in the three assemblies. The number of clusters obtained with the original trimming procedure are shown in the ‘Old-trim’ column. Cluster sizes represent the number of expressed sequence
tags (ESTs) in a cluster.
Cluster size phrap-hs X phrap-d X CAP3 X phrap-hs Common Old-trim 1 32202 13731 18535 11634 16838 14296 10744 41582
2 12440 5617 9207 4869 7665 4852 3792 13619
3 6752 2402 5192 2151 4193 1984 1441 7421
4 4225 1239 3329 1145 2709 992 697 4482
5 2856 676 2360 700 1872 521 344 3110
6 2098 442 1806 482 1452 354 231 2151
7 1582 288 1362 317 1115 220 144 1582
8 1245 202 1091 242 862 153 99 1219
9 974 156 913 186 720 113 72 964
10 776 105 752 143 634 74 44 809
11 639 76 607 99 511 54 30 641
12 492 71 547 99 429 46 32 490
13 437 47 454 90 400 40 25 430
14 366 42 391 40 341 26 13 366
15 306 31 390 50 295 18 11 312
16 273 25 279 35 275 18 8 257
17 225 15 273 23 235 11 4 206
18 177 11 227 15 191 5 2 183
19 124 6 177 18 176 5 3 153
20 143 10 149 13 179 6 3 136
21 113 6 130 5 133 2 0 106
22 105 3 130 5 117 2 1 98
23 92 4 100 9 140 3 2 79
24 80 4 99 6 122 2 1 82
25 69 3 109 6 86 5 2 60
26 56 2 108 9 72 1 1 59
27 51 2 59 4 78 1 1 49
28 44 1 73 5 74 1 1 46
28 439 5 857 25 1227 0 0 577
Total 69381 25222 49706 22425 43141 23805 17748 81223
DISCUSSION
The trimming procedure described in this paper dis-carded 53,735 SUCEST reads, 18.4% of the total. In spite of this large number, it is worth noting that 16% of the dis-carded sequences were ribosomal RNA and 34% were smaller than 100 bases. We cannot exclude the possibility of that we have discarded useful reads with this procedure, but we tried to avoid this as much as possible. It is also ob-vious that not every artifact has been removed. For exam-ple, counting how many reads have a sub-sequence of at least 30 consecutive adenines in the output of the trimming procedure found 711 reads. Moreover, trimming is not a light computational task, taking 8.3 h to process all the SUCEST reads.
Nevertheless, the influence of the quality of trimming on the final clustering is remarkable. For instance, it is hard to accept that the number of singletons in the old assembly are uniquely expressed sugarcane genes, and 81,223 was an unreasonably large number of clusters. Good trimming also shortened the CPU time required for clustering, the phrap program took 9.2 h to build the phrap-d assembly and 6.5 h for phrap-hs assembly, while the CAP3 program took 77.1 h. To assemble the old set of trimmed reads, phrap took 5 times more time than it spent to produce phrap-hs, while CAP3 ended abnormally when fed with that data-set.
We have used a fragment assembler for the whole set of ESTs in the SUCEST database and, consequently, the bi-ological definition of ‘one cluster, one gene’ cannot be used. A SUCEST cluster can be better defined as ‘a set of very similar transcripts’.
Building consensus sequences for clusters is useful in several respects. Firstly, electing a representative sequence for each cluster results in a smaller set of sequences to work with. Secondly, the portions of representative sequences covered by more than one read are more accurate than the reads themselves. Thirdly, representative sequences may be longer than individual reads, increasing their usefulness. This third point was confirmed by the fact that 33% of
rep-resentative sequences with homologous genes in other or-ganisms were actually full-length sequences (Vettoreet al., 2001).
However, chimeras may result from assembling ESTs and a further problem is that using a fragment assem-bler for clustering will put alternatively spliced forms of genes into different clusters. But in a dodecaploid organism like sugarcane it is especially difficult to distinguish alleles of genes from very conserved multigene families based on similarity.
The assembly produced by the CAP3 program was taken as the ‘official’ clustering for the SUCEST project. This decision was based on the result of the internal and ex-ternal consistency tests, where the CAP3 assembly outper-formed both the phrap-hs and phrap-d assemblies. Internal consistency shows that the CAP3 assembly has a lower in-cidence of discrepant reads in clusters when compared to the other assemblies. External consistency reveals that the CAP3 program produces fewer redundant clusters,i.e.two or more clusters that probably should be condensed to a sin-gle cluster. Unfortunately, we performed no comparisons of our results with those that would be produced using some other method described in the literature. This is an interest-ing investigation to perform in the future.
The trimming and clustering procedures described in this paper hide a large amount of computational time and human work spent looking at the data, testing insights, ad-justing parameters, and designing the pipeline. There are no ‘magic numbers’. We believe that these guidelines may be used in some other EST projects, although using these pro-cedures with different data sets may require some adjust-ments. The need for many cycles of adjustment and testing is a natural consequence of the nature of the noise present in ESTs, the limitations posed by technological issues and the lack of a complete understanding of the biological pro-cesses occurring within cells.
RESUMO
O método declusteringadotado no Projeto SUCEST (Sugarcane EST Project) tinha vários problemas (muitos clusters, presença de seqüências de ribossomo etc.) Nós assumimos a tarefa de reprojetar todo o processo de cluster-ing, propondo uma “limpeza” inicial mais cuidadosa das seqüências. Neste artigo as estratégias de limpeza das se-qüências e declusteringsão descritas em detalhe, incluindo os números oficiais do projeto (237,954 ESTs e 43,141 clusters).
ACKNOWLEDGMENTS
This work was supported by the Brazilian agencies FAPESP and CNPq.
REFERENCES
Anon. (1998).Chemistry Guide for Automated DNA Sequencing, Applied Biosystems, Foster City-CA, USA, 242 pp. Figure 5- Plot of external consistency test results. For a given assembly
Adams, M.D., Kelley, J.M., Gocayne, J.D., Dubnick, M., Polymeropoulos, M.H., Xiao, H., Merril, C.R., Wu, A., Olde, B., Moreno, R., Kerlavage, A.R., McCombie, W.R. andVenter, J.C.(1991). Complementary DNA sequencing: expressed sequence tags and the human genome project. Sci-ence 252: 1651-1656.
Altschul, S.F., Madden, T.L., Schäffer, A.A., Zhang, J., Zhang, Z., Miller, W.andLipman, D.J.(1997). Gapped BLAST and PSI-BLAST: a new generation of protein data-base search programs.Nucleic Acids Res.25: 3389-3402.
Huang, X.andMadan, A.(1999). CAP3: a DNA sequence as-sembly program.Genome Res. 9: 868-877.
Liang, F., Holt, I., Pertea, G., Karamycheva, S., Salzberg, S. and Quackenbush, J. (2000). An optimized protocol for analysis of EST sequences. Nucleic Acids Res. 28 (18): 3657-3665.
Miller, R.T., Christoffels, A.G., Gopalakrishnan, C., Burke, J.A., Ptitsyn, A.A., Broveak, T.R.andHide, W.A.(1999). A comprehensive approach to clustering of expressed hu-man gene sequence: The sequence tag alignment and con-sensus knowledge base.Genome Res. 9: 1143-1155. Parsons, J.andRodriguez-Tomé, P.(2000). JESAM: CORBA
software components to create and publish EST alignments and clusters.Bioinformatics.4(16): 313-325.
Quackenbush, J., Liang, F., Holt, I., Pertea, G.andUpton, J. (2000). The TIGR Gene Indices: reconstruction and repre-sentation of expressed gene sequences.Nucleic Acids Res. 28(1): 141-145.
Telles, G.P., Braga, M.D.V., Dias, Z., Lin, T.-L., Quitzau, J.A.A., da Silva, F.R. and Meidanis, J. (2001). Bioin-formatics of the Sugarcane EST Project.Genetics and Mo-lecular Biology 24(1-4): 9-15.