Characterization of different strains of common carp (
Cyprinus carpio
L.)
(Cyprinidae, Cypriniformes) in Bangladesh using microsatellite DNA markers
Md. Rashedul Kabir Mondol
1, Md. Shahidul Islam
2and Md. Samsul Alam
11
Department of Fisheries Biology and Genetics, Bangladesh Agricultural University, Mymensingh,
Bangladesh.
2
Department of Biotechnology, Bangladesh Agricultural University, Mymensingh, Bangladesh.
Abstract
Characterization of different strains of common carp (Cyprinus carpio L.) using molecular markers is essential for the management of this fish in respect to the evaluation of the potential genetic effects induced by hatchery operations and the genetic improvement of carp varieties. Five microsatellite loci (MFW1, MFW2, MFW11, MFW15 and MFW20) were analyzed for the molecular characterization of four common carp strains, i.e. scaled carp, mirror carp, red carp and koi carp. We observed differences in heterozygosities and the average numbers of alleles but not in polymorphic loci (P95) among the strains. Koi carp displayed the highest level of variability in terms of heterozygosity.
TheNmvalues and theFSTvalues indicated a low level of gene flow and high level of differentiation among the strains.
The highest genetic distance was observed between the scaled carp and the koi carp whilst the lowest genetic dis-tance was found between the red- and koi carp. The unweighted pair group method with averages (UPGMA) dendrogram resulted in two clusters, one containing only the scaled carp and the other the remaining three varieties. Microsatellite markers have been found to be effective tools for characterization of different strains of common carp.
Key words:characterization,Cyprinus carpio, microsatellite marker. Received: August 4, 2005; Accepted: May 8, 2006.
Introduction
The common carp (Cyprinus carpioL.) belongs to the Cyprinidae, the largest freshwater teleost family (Nelson, 1994), and is probably the oldest and most extensively cul-tured fish species in the world. The total annual world pro-duction of common carp in 2003 has been estimated to be 3 239 712 tons (FAO, 2005) and this fish has been acclima-tized to a wide range of habitats and environmental condi-tions and therefore enjoys a world-wide distribution. Different varieties of common carp (e.g.races, landraces, strains, breeds and stocks) have been developed through a combination of forces including geographical isolation, ad-aptation, accumulation of mutations and natural as well as human selection pressure (Hulata, 1995). The colourful koi, or fancy, carp was developed in Japan for ornamental purposes, probably from colour mutant types arising in the wild carp (Magoi) of Central Asia (McDowall, 1989). Other commercial stocks (e.g.gold, red and white, tricolour etc.) have been established by selective breeding and cross breeding of colour mutants (Purdom, 1993, Liu et al., 2002).
As many as 15 exotic fishes (Ali, 1998) have been in-troduced into Bangladesh, although the common carp is the most important fish that is being extensively cultured throughout the country. Scaled common carp was first in-troduced into Bangladesh by the Bangladesh Department of Fisheries (DoF) in 1960 from China and then in 1995 from Vietnam. The mirror carp was first introduced into Bangladesh in 1979 from Nepal and then from Hungary in 1982 and 1996 (Rahman, 1985; Hussain, 1997). Koi carp has recently been introduced from Japan and successfully bred in hatcheries in the Jessore district of Bangladesh.
In Bangladesh, common carp is repeatedly bred in the hatchery with a limited number of effective parents (Ne) to
keep the production costs to a minimum. As a result, netic erosion may have occurred through inbreeding, ge-netic drift and the bottleneck effects. Rare alleles may be lost through genetic drift during management of hatchery stocks. According to Basavarajuet al. (2002) precocious maturation, unwanted reproduction and loss of genetic variability have been identified as potential constraints of common carp aquaculture and culture-based fisheries. Moreover, hatchery owners, especially in the Jessore re-gion, sometimes conduct cross-breeding among different strains of common carp to produce attractive colored fish to
Send correspondence to Md. Samsul Alam. Department of Fish-eries Biology and Genetics, Bangladesh Agricultural University, Mymensingh 2202, Bangladesh. E-mail: samsul_bau@yahoo.com.
meet public demand (personal communication). This may lead to the introgression of genes causing loss of the genetic identity of the respective strains. All of these negative man-agement practices have been identified as potential con-straints in common carp aquaculture and culture-based fisheries in Bangladesh and it is imperative to assess any possible genetic erosion that might have been induced by Bangladeshi hatchery management practices.
DNA microsatellites are the most useful markers that are widely and efficiently used in the evaluation of the ge-netic status of different organisms. These markers are highly polymorphic tandem arrays of short nucleotide mo-tifs dispersed throughout the nuclear genome of eukaryotes (Hamadaet al., 1982; Crooijmanset al., 1997) and have re-cently been used successfully for monitoring genetic diver-sity in different common carp strains (Tancket al., 2000; Davidet al., 2001; Lehoczky et al., 2002; Bartfai et al., 2003; Kohlmannet al., 2003).
The study described in this paper examined the levels of genetic polymorphism in different strains of common carp in Bangladesh using microsatellite DNA markers de-veloped by Crooijmanset al.(1997). This study will also provide a genetic background for the management of dif-ferent strains of common carp in the hatcheries and contrib-ute to the identification and characterization of common carp in Bangladesh.
Materials and Methods
Sample collection
Fingerlings of four strains were collected from Anil Fishery, Mymensingh district and Sonali Matsha Hatchery, Jessore district, Bangladesh during August to September of 2004. The Fingerlings were reared for four months in dif-ferent ponds at the field laboratory complex of the Faculty of Fisheries, Bangladesh Agricultural University, Mymensingh. In order to perform microsatellite analysis, samples of fin tissues were cut with scissors from 25 ran-domly-selected specimens of each strain and immediately preserved in 95% (v/v) ethanol and stored at -20 °C.
Genomic DNA extraction
For each sample, approximately 30 mg of fin tissues was cut into small pieces and genomic DNA was extracted by proteinase-K digestion, phenol:chloroform:isoamyl al-cohol (25:24:1 v/v/v) extraction and ethanol precipitation as described by Alamet al.(1996). In brief, tissue samples was homogenized and digested with proteinase-K in ex-traction buffer [100 mM Tris-HCl, 10 mM ethylenedia-minetetraacetic acid (EDTA), 250 mM NaCl and 1% (w/v) sodium dodecyl sulfate (SDS); pH 8.0] at 37 °C overnight. Tissue lysate was purified twice with phenol:chloroform: isoamyl alcohol (25:24:1 v/v/v) and once with chloro-form:isoamyl alcohol (24:1 v/v). The DNA was precipi-tated first using 0.6 volumes of isopropanol, pelleted by
centrifugation and suspended in TE (10 mM Tris-HCl and 1 mM EDTA; pH 8.0) buffer. DNA was re-precipitated by adding twice the volume of absolute ethanol and pelleted by centrifugation. The pellets were then washed with 70% (v/v) aqueous ethanol, air dried and re-suspended in an ap-propriate volume of TE buffer. The quality of the extracted DNA sample was checked by electrophoresis in 1% (w/v) agarose gel and the quantity of the DNA in each sample was determined by UV-spectrophotometry.
Polymerase chain reaction (PCR) amplification of microsatellite DNA marker
A total of five poly (CA) type primer pairs (MFW1, MFW2, MFW11, MFW15 and MFW20) developed by Crooijmanset al.(1997) were used in the study. The ampli-fication conditions recommended by Crooijmans et al. (1997) were followed with some modification especially in annealing temperature and template DNA concentration. The annealing temperatures of the five primer pairs were 55 °C forMFW20, 56 °C forMFW1,MFW11andMFW15, and 57 °C forMFW2. The PCR was performed in a 10mL
reaction volume containing 25-50 ng of template DNA, 2.5mM of forward and reverse primer, 0.25 mM of each
dNTP, 1 unit of Taq DNA polymerase and 1mL of 10 x
re-action buffer containing 15 mM MgCl2. The PCR cycles
were: pre-amplification denaturation at 94 °C for 3 min, then 30 s at 94 °C, 30 s at the respective annealing tempera-ture and 1min at 72 °C for 35 cycles followed by a final elongation step for 5 min at 72 °C.
Gel electrophoresis and staining
The PCR products were separated by electrophoreses on 6% (w/v) denatured polyacrylamide gel containing 19:1 acrylamide:bis-acrylamide and 7 M urea using a Sequi-Gen sequencing gel electrophoresis system (BIO-RAD Labora-tories, Hercules, CA). The gel was pre-run for 30 min at 120 W followed by final run at 60 W and 50 °C for 2-3 h ac-cording to the size of the PCR fragment. After electropho-resis the gel was stained with silver nitrate essentially following the Promega (Madison, WI) silver staining pro-tocol.
Microsatellite data analysis
squares fit of DNA fragment length to gel mobility’ algo-rithm of Schaffer and Sederoff (1981). Allelic variations, fit to Hardy-Weinberg proportions and gene flow (Nm)
were estimated using the POPGENE program version 1.31 (Yehet al., 1999) with 1000 simulated samples. The G-stat program (Siegismund, 1995) was used for estimating allelic frequencies and homogeneity test between the strains. The FSTAT program version 2.9.3 (Goudet, 2001) was used to calculate F-statistics (FST) between strains. The
GDA program (Lewis and Zaykin, 2001) was used for esti-mating genetic distance. The unweighted pair-group
method with averages (UPGMA) dendrogram was drawn using TREEVIEW program (Page, 1996).
Results
Intra-population genetic variation
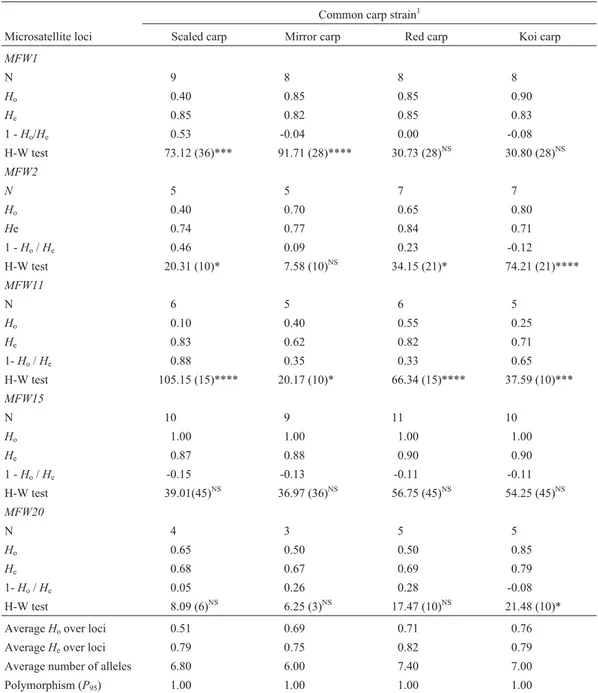
All the microsatellite loci subjected to PCR amplifi-cation were found to be polymorphic (p) (Table 1). The MFW15locus had the highest number of alleles (11) while theMFW20locus had the least (3). The average number of alleles across all loci was the highest (7.40) in the red carp
Table 1- Allelic variations (N= number of alleles,Ho= observed heterozygosity,He= expected heterozygosity) and deviation from Hardy-Weinberg
(H-W) expectations (c2values) at five microsatellite loci in twenty five fish from each of the four common carp strains studied.
Common carp strain1
Microsatellite loci Scaled carp Mirror carp Red carp Koi carp
MFW1
N 9 8 8 8
Ho 0.40 0.85 0.85 0.90
He 0.85 0.82 0.85 0.83
1 -Ho/He 0.53 -0.04 0.00 -0.08
H-W test 73.12 (36)*** 91.71 (28)**** 30.73 (28)NS 30.80 (28)NS
MFW2
N 5 5 7 7
Ho 0.40 0.70 0.65 0.80
He 0.74 0.77 0.84 0.71
1 -Ho/He 0.46 0.09 0.23 -0.12
H-W test 20.31 (10)* 7.58 (10)NS 34.15 (21)* 74.21 (21)****
MFW11
N 6 5 6 5
Ho 0.10 0.40 0.55 0.25
He 0.83 0.62 0.82 0.71
1-Ho/He 0.88 0.35 0.33 0.65
H-W test 105.15 (15)**** 20.17 (10)* 66.34 (15)**** 37.59 (10)***
MFW15
N 10 9 11 10
Ho 1.00 1.00 1.00 1.00
He 0.87 0.88 0.90 0.90
1 -Ho/He -0.15 -0.13 -0.11 -0.11
H-W test 39.01(45)NS 36.97 (36)NS 56.75 (45)NS 54.25 (45)NS
MFW20
N 4 3 5 5
Ho 0.65 0.50 0.50 0.85
He 0.68 0.67 0.69 0.79
1-Ho/He 0.05 0.26 0.28 -0.08
H-W test 8.09 (6)NS 6.25 (3)NS 17.47 (10)NS 21.48 (10)*
AverageHoover loci 0.51 0.69 0.71 0.76
AverageHeover loci 0.79 0.75 0.82 0.79
Average number of alleles 6.80 6.00 7.40 7.00
Polymorphism (P95) 1.00 1.00 1.00 1.00
1Values in parentheses indicate degrees of freedom and statistically significant values are indicated as follows: *p < 0.05; **p < 0.01; ***p < 0.001;
followed by the koi carp (7.00), scaled carp (6.80) and mir-ror carp (6.00).
The observed average heterozygosity (Ho) in the koi
carp was the highest (0.76) which was followed by that of red carp (0.71), mirror carp (0.69) and scaled carp (0.51) in descending order (Table 1). Except for theMFW15locus, in majority of the cases the 1 -Ho/Hevalues were positive in
scaled carp, mirror carp and red carp, indicating that those strains were deficient in heterozygosity at most of the loci (Table 1). On the other hand, the 1 -Ho/Hevalues for koi
carp were negative in most cases except at locusMFW11, suggesting that the koi carp stock showed an excess of heterozygosity at most of the loci.
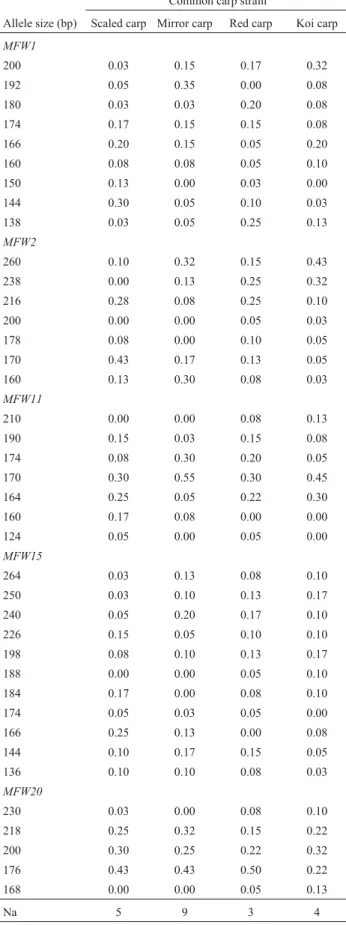
The allelic frequencies of all the loci in all the popula-tions are shown in Table 2. The sizes of the alleles ranged from 124 to 264. No strain-specific private allele was found for any strain at any of the five loci. The total number of lost alleles was the highest in mirror carp (9) followed by scaled carp (5), koi carp (4) and red carp (3).
Deviation from Hardy-Weinberg proportion
In 10 of a total of 20 tests, significant deviations from Hardy-Weinberg expectations (HWE) were detected (Ta-ble 1). The test for fit to Hardy-Weinberg proportions re-vealed that all the strains were found to be deviated from Hardy-Weinberg expectations at locusMFW11while all of them were found to be in equilibrium at locusMFW15. Only one strain (koi carp) was found to be in disequilibrium at locusMFW20and at least two strains were in disequilib-rium at lociMFW1andMFW2. Scaled carp and koi carp deviated in 3 loci while mirror carp and red carp deviated in 2 loci (Table 1).
Inter-population genetic structure and genetic distance
The population differentiation (FST) value between
scaled carp and koi carp was the highest (0.071) while the FST value between red carp and koi carp was the lowest
(0.023). However,FSTvalues were found to be statistically
significant in most of the population pairs except red and koi carp. The gene flow (Nm) value between red carp and
koi carp across all the studied loci was the highest (9.67) while the lowestNmvalue (4.56) was that between scaled
carp and koi carp (Table 3).
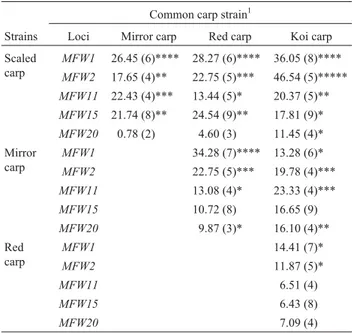
Pair-wise comparisons of the samples of four strains ofC. carpiousing homogeneity tests are shown in Table 4. None of the strain pairs was homogenous at locusMFW1 andMFW2. Except for these loci red carp and koi carp were homogenous at all the loci. Scaled carp and mirror carp and scaled carp and red carp were only homogenous at the MFW20loci. Scaled carp did not form a homogenous group with koi carp at any locus. Mirror carp and red carp and mirror carp and koi carp were homogenous only at locus MFW15(Table 4).
Table 2- Frequency of alleles at five microsatellite loci in four common carp strains.
Common carp strain
Allele size (bp) Scaled carp Mirror carp Red carp Koi carp
MFW1
200 0.03 0.15 0.17 0.32
192 0.05 0.35 0.00 0.08
180 0.03 0.03 0.20 0.08
174 0.17 0.15 0.15 0.08
166 0.20 0.15 0.05 0.20
160 0.08 0.08 0.05 0.10
150 0.13 0.00 0.03 0.00
144 0.30 0.05 0.10 0.03
138 0.03 0.05 0.25 0.13
MFW2
260 0.10 0.32 0.15 0.43
238 0.00 0.13 0.25 0.32
216 0.28 0.08 0.25 0.10
200 0.00 0.00 0.05 0.03
178 0.08 0.00 0.10 0.05
170 0.43 0.17 0.13 0.05
160 0.13 0.30 0.08 0.03
MFW11
210 0.00 0.00 0.08 0.13
190 0.15 0.03 0.15 0.08
174 0.08 0.30 0.20 0.05
170 0.30 0.55 0.30 0.45
164 0.25 0.05 0.22 0.30
160 0.17 0.08 0.00 0.00
124 0.05 0.00 0.05 0.00
MFW15
264 0.03 0.13 0.08 0.10
250 0.03 0.10 0.13 0.17
240 0.05 0.20 0.17 0.10
226 0.15 0.05 0.10 0.10
198 0.08 0.10 0.13 0.17
188 0.00 0.00 0.05 0.10
184 0.17 0.00 0.08 0.10
174 0.05 0.03 0.05 0.00
166 0.25 0.13 0.00 0.08
144 0.10 0.17 0.15 0.05
136 0.10 0.10 0.08 0.03
MFW20
230 0.03 0.00 0.08 0.10
218 0.25 0.32 0.15 0.22
200 0.30 0.25 0.22 0.32
176 0.43 0.43 0.50 0.22
168 0.00 0.00 0.05 0.13
Na 5 9 3 4
The highest genetic distance value (0.47) was be-tween scaled carp and koi carp and the lowest (0.23) was between red and koi carp (Table 5). The UPGMA dendrogram based on Nei’s (1972) genetic distance re-sulted in two major clusters: the scaled carp was alone in one cluster while the remaining three strains grouped into another cluster. The second cluster was further segregated into two sub-clusters: mirror carp being alone in one cluster and red- and koi carp together in the other cluster (Fig-ure 1).
Discussion
In Bangladesh the common carp is an exotic species which contributes significantly to the aquaculture produc-tion of this country. However, since it is an exotic species its gene pool is restricted and subjected to various changes during the course of captive management. Though studies on genetic structure of this species are available elsewhere in the world (Kohlmann and Kersten, 1999; Tancket al., 2000; Davidet al., 2001; Lehoczkyet al., 2002; Bartfaiet al., 2003; Kohlmannet al., 2003) our study is the first at-tempt to reveal the genetic structure of different strains of common carp introduced in Bangladesh.
The changes in gene and genotype frequencies of hatchery population are random and vary from stock to stock. Kohlmann and Kersten (1999) carried out an electro-phoretic study of the allozymes of different strains of com-mon carp and reported that the average number of allozyme alleles per locus was 1.4 to 1.9, the meanH0was 0.112 to
0.256 and the percentage of polymorphic loci was 25 to 50. The above study and the studies conducted by Suman-tadinata and Taniguchi (1990) and Kohlmannet al. (2003) using common carp allozyme markers all showed lower ge-netic variability than that obtained in the present study. However, Lehoczkyet al.(2002) used DNA microsatellite markers to study four strains of common carp and found an observed heterozygosity (H0) of 0.557 to 0.764 slightly
higher than the 0.510 to 0.760 found by us. Bartfaiet al. (2003) used microsatellite markers to study two Hungarian common carp stocks (Attala and Dinnyes) and reported that the meanHovalue was 0.69 and thus equal to the mirror
carp value detected in our study, although theHovalue for
scaled carp was higher than the value for scaled carp ob-served by us. Taken together, these studies suggest that microsatellite DNA markers may be more useful in analyz-ing subtle genetic differences among different stocks of common carp. In our study the number of lost microsatellite alleles for all loci varied from strain to strain, with the high-est being 9 in mirror carp. Loss of allelic variation has also been reported for trout hatchery populations in Poland (Was and Wenne, 2002). Sekinoet al.(2002) found that the number of microsatellite alleles was markedly reduced in
Table 3- MultilocusFST(upper diagonal) andNm(below diagonal) values
between pairs of four common carp strains across all loci.
Common carp strain
Populations Scaled carp Mirror carp Red carp Koi carp
Scaled carp 0.055* 0.034* 0.071*
Mirror carp 5.48 0.042* 0.046*
Red carp 7.36 6.84 0.023NS
Koi carp 4.56 6.50 9.67
*p < 0.05 and NS = not significant.
Table 4- Homogeneity (c2values) between samples of common carp
strains.
Common carp strain1
Strains Loci Mirror carp Red carp Koi carp
Scaled carp
MFW1 26.45 (6)**** 28.27 (6)**** 36.05 (8)****
MFW2 17.65 (4)** 22.75 (5)*** 46.54 (5)*****
MFW11 22.43 (4)*** 13.44 (5)* 20.37 (5)**
MFW15 21.74 (8)** 24.54 (9)** 17.81 (9)*
MFW20 0.78 (2) 4.60 (3) 11.45 (4)*
Mirror carp
MFW1 34.28 (7)**** 13.28 (6)*
MFW2 22.75 (5)*** 19.78 (4)***
MFW11 13.08 (4)* 23.33 (4)***
MFW15 10.72 (8) 16.65 (9)
MFW20 9.87 (3)* 16.10 (4)**
Red carp
MFW1 14.41 (7)*
MFW2 11.87 (5)*
MFW11 6.51 (4)
MFW15 6.43 (8)
MFW20 7.09 (4)
1
Values in parentheses indicate degrees of freedom and statistically signif-icant values (c2test) are indicated as follows: *p < 0.05; **p < 0.01;
***p < 0.001; and ****p = 0.
Table 5- Summary of Nei’s (1972) genetic distance values between four common carp strains.
Populations Scaled carp Mirror carp Red carp
Scaled carp
Mirror carp 0.34
Red carp 0.30 0.29
Koi carp 0.47 0.29 0.23
hatchery strains of Japanese flounder compared with wild populations of the same species.
Loss of allelic variation in different strains of com-mon carp may because comcom-mon carp was introduced into Bangladesh in a few batches and bred repeatedly in hatch-ery units which had a small effective number of broods (Ne), which may have led to genetic drift and genetic
ero-sion of most hatchery populations. The loss of hetero-zygosity may increase as bottlenecking and inbreeding increases, and Desvigneset al.(2001) have argued that the reduction of microsatellite allelic diversity in scaled carp and mirror carp could be related to population bottle-necking associated with breeding practices.
We found that red and koi carp showed more genetic variability than scaled and mirror carp, supporting the re-sults reported by Liuet al.(2002) who studied the micro-satellite markers of four artificially gynogenetic families of ornamental carp and found that each color strain of orna-mental carp was produced through selective hybridization between strains. Zhouet al.(2004) also observed the high-est level of genetic variability in terms of heterozygosity in Japanese decorative carp. In our study, although the aver-age observed heterozygosity was highest in koi carp the av-erage number of alleles observed in koi carp was more or less similar to that in red carp, indicating that both strains were very similar in terms of genetic variability. Moreover, although we found a significant departure from homogene-ity between each pair of strains at the maximum number of loci (Table 4), our study supports the observation that koi and red carp are homogeneous at the maximum number of locii.e.the genetic difference between koi and red carp is relatively low and it is probable that koi carps originated from red carp which are wild colored mutants of common carp (McDowall, 1989).
Our results showed that the 1 -Ho/Hevalues in koi
carp were negative in most of the loci, which indicated rela-tively high level of heterozygosity in koi carp strain whereas significant positive values at different loci in dif-ferent strains indicated a deficit of heterozygosity that could be the result of consanguinity due to preferential mat-ing. Tessieret al. (1997) observed significant changes in al-lele frequencies and losses of low-frequency alal-leles but no reduction in heterozygosity in hatchery stocks in compari-son with wild salmon populations. Since red carp and koi carp have only recently been introduced to the Jessore hatchery and only a few generations have been bred it is reasonable to expect them to show greater genetic variabil-ity than the scaled and mirror carp which had been bred at this hatchery for many generations.
For the five microsatellite loci tested in this study, all the strains were found to deviate from Hardy-Weinberg equilibrium at a number of loci, which might have been due to loss of heterozygosity in the hatchery populations be-cause of the small effective population (Ne) and a
bottle-neck effect. This hypothesis is supported by the work of
Alam and Islam (2005), who found that a hatchery population ofCatla catladeviated from Hardy-Weinberg equilibrium at a number of loci.
Pair wise genetic distance andFSTvalues depicted the
relationship in different strains of common carp. The close relationship with the least genetic distance and population genetic differentiation (FST) values observed between red
carp and koi carp (Figure 1) might be due to the geograph-ical proximity between the origins of the two strains and their breeding strategy. Both strains were introduced into Bangladesh from Japan and the koi carp is known to be de-rived through selective breeding from red carp (Kirpi-chnikov, 1981), as supported by the high gene flow (Nm)
between the red carp and koi carp. In a previous analysis of mtDNA polymorphism among common carp populations from Europe and eastern and southern Asia, Grosset al. (2002) observed that the distribution of haplotypic groups strictly followed the geographic origin of the population and thus European populations which were genetically very similar to each other and less differentiated grouped into one cluster while koi- and Vietnamese carps were sep-arated from each other with high genetic differentiation. However, we found that the scaled carp from China and Vietnam were only distantly related to the koi carp intro-duced from Japan, which had the highest genetic distance andFSTvalues and the lowestNmvalue. The significant
de-parture from homogeneity between scaled carp and koi carp at all loci seen in our study supports these findings (Ta-ble 4). Similarly, Kohlmann and Kersten (1999) observed a discrete relationship between scaled carp and koi carp with relatively high level of genetic distance when analyzed with allozyme marker.
more markers and samples covering different hatcheries throughout Bangladesh still need to be performed to formu-late a good management policy for the common carp strains used in Bangladesh now and in the future.
Acknowledgments
This study was conducted under grant number MOSICT/ sec-9/SAP-28/2003-2004/528 of the Ministry of Science and Information & Communication Technology (MoSICT), Government of the Peoples’ Republic of Ban-gladesh. The Authors are indebted to two unknown referees who helped improve the manuscript.
References
Alam MS and Islam MS (2005) Population genetic structure of
Catla catla (Hamilton) revealed by microsatellite DNA markers. Aquaculture 246:151-160.
Alam MS, Popplewell A and Maclean N (1996) Germline trans-mission and expression of a lacZ containing transgene in tilapia(Oreochromis niloticus).Transgenic Res 5:87-95. Ali ML (1998) Fisheries resources development and management
technique. Fish Week’ 98 Compendium. Department of Fisheries, Ministry of Fisheries and Livestock, Dhaka, pp 1-10.
Bartfai R, Egedi S, Yue GH, Kovacs B, Urbanyi B, Tamas G, Horvath L and Orban L (2003) Genetic analysis of two com-mon carp broodstocks by RAPD and microsatellite markers. Aquaculture 219:157-167.
Basavaraju Y, Penman DJ and Mair GC (2002) Genetic status and strategies for improvement of common carp (Cyprinus carpio) in Karnataka, India - Evaluation of stocks for the de-velopment of a breeding programme. In: Penman DJ, Hussain MG, McAndrew BJ and Mazid MA (eds) Proceed-ings of a Workshop on Genetic Management and Improve-ment Strategies for Exotic Carps in Bangladesh. Bangladesh Fisheries Research Institute, Mymensingh, pp 29-36. Crooijmans RPMA, Bierbooms VAF, Komen J, van der Poel JJ
and Groenen MAM (1997) Microsatellite markers in com-mon carp (Cyprinus carpioL.). Anim Genet 28:129-134. David L, Rajasekaran PJ, Fang J, Hillel J and Lavi U (2001)
Poly-morphism in ornamental and common carp strains (Cyprinus carpioL.) as revealed by AFLP analysis and new set of microsatellite markers. Mol Genet Genomics 266:353-362.
Desvignes JF, Laroche J, Durand JD and Bouvet Y (2001) Genetic variability in reared stocks of common carp (Cyprinus carpio L.) based on allozymes and microsatellites. Aqua-culture 194:291-301.
FAO (2005) World Aquaculture Production of Fish, Crustaceans, Molluscs, etc., by Principal Species in 2003. Yearbook of Fishery Statistics. http://www.fao.org/fi/statist/statist.asp. Gross R, Kohlmann K and Kersten P (2002) PCR-RFLP analysis
of the mitochondrial ND-3/4 and ND-5/6 gene polymorphisms in the European and East Asian subspecies of common carp (Cypriunus carpio L.). Aquaculture 204:507-516.
Goudet J (2001) FSTAT, a program to estimate and test gene di-versities and fixation indices (version 2.9.3). Available from
http://www.unil.ch/izea/softwares/fstat.html. Updated from Goudet (1995).
Hamada H, Petrino MG and Kakunaga T (1982) A novel repeated element with Z-DNA-forming potential is widely found in evolutionary diverse eukaryotic genomes. Proc Natl Acad Sci USA 79:6465-6469.
Hulata G (1995) A review of genetic improvement of the common carp (Cyprinus carpio L.) and other cyprinids by cross-breeding, hybridization and selection. Aquaculture 129:143-155.
Hussain MG (1997) Current status of carp genetic research and breeding practices in Bangladesh. In: Gupta MV, Dey MM, Dunham R and Bimbao G (eds) Proceedings of the Collabo-rative Research and Training on Genetic Improvement of Carp Species in Asia. Central Institute of Freshwater Aqua-culture, Bhubaneshwar. ICLARM Work Documents 1 (un-published), 12 p.
Kirpichnikov VS (1981) Genetic Bases of Fish election. Springer-Verlag, Berlin, 410 pp.
Kohlmann K and Kersten P (1999) Genetic variability of German and foreign common carp (Cyprinus carpioL.) populations. Aquaculture 173:435-445.
Kohlmann K, Gross R, Murakaeva A and Kersten P (2003) Ge-netic variability and structure of common carp (Cyprinus carpio) populations throughout the distribution range in-ferred from allozyme, microsatellite and mitochondrial DNA markers. Aquat Living Resour 16:421-431.
Lehoczky I, Magyary I and Hancz C (2002) Study of the genetic variability of six domestic common carp strains using mi-crosatellite DNA markers. Allattenyesztes es Takarma-nyozas 51:8-19.
Lewis PO and Zaykin D (2001) Genetic Data Analysis. Computer program for the analysis of allelic data. Version 1.0 (d 16c). Free program distributed by the authors over the internet from http://lewis.eeb.uconn.edu/lewishome/software.html. Liu JX, Zhou L, Zhao ZS and Gui JF (2002) Studies on
micro-satellite markers of four artificially gynogenetic families in ornamental carp. Zool Res 23:97-105.
McDowall A (1989) The Interpret Encyclopaedia of Koi. Sala-mander Books, London, 208 pp.
Nash JHE (1991) DNA frag, Version 3.03. Institute for Biological Sciences, National Research Council of Canada, Ottawa, Ontario, Canada.
Nei M (1972) Genetic distance between populations. Am Nat 106:283-292.
Nelson RJ (1994) Fishes of the World. 3rd edition. Wiley, New York, 600 pp.
Page RDM (1996) TREEVIEW: An application to display phylo-genetic trees on personal computers. Comput Appl Biosci 12:357-358.
Purdom CE (1993) Genetics and Fish Breeding. Fish and Fish-eries SFish-eries 8. Chapman and Hall, London, 277 pp. Rahman AKM (1985) Study on the exotic fishes in Bangladesh.
Paper presented at a seminar on the Culture Need of Exotic Species in Bangladesh, organized by the Zoological Society of Bangladesh, Dhaka, 13 p.
Schaffer HE and Sederoff RR (1981) Improved estimation of DNA fragment lengths from agarose gels. Anal Biochem 115:113-122.
Paralichthys olivaceusassessed by means of microsatellite and mitochondrial DNA sequencing analysis. Aquaculture 213:101-122.
Siegismund HR (1995) G-STAT, Version 3.1. Genetical statisti-cal programs for the analysis of population data. Botanistatisti-cal Institute, University of Copenhagen, Denmark.
Sumantadinata K and Taniguchi N (1990) Comparison of electrophorectic allele frequencies and genetic variability of common carp stocks from Indonesia and Japan. Aquaculture 88:263-271.
Tanck MWT, Baars HCA, Kohlmann K, Komen J and van der Poel JJ (2000) Genetic characterization of wild Dutch com-mon carp (Cyprinus carpioL.). Aquac Res 31:779-783.
Tessier N, Bernatchez L and Wright JM (1997) Population struc-ture and impact of supportive breeding inferred from mito-chondrial and microsatellite DNA analyses in land-locked Atlantic salmonSalmo salarL. Mol Ecol 6:735-750. Was A and Wenne R (2002) Genetic differentiation in hatchery
and wild sea trout (Salmo trutta) in the Southern Baltic at microsatellite loci. Aquaculture 204:493-506.
Yeh FC, Yang RC and Boyle T (1999) POPGENE Version 1.31: Microsoft Window-based free software for Population Ge-netic Analysis. http://www.ualberta.ca/~fyeh.
Zhou J, Wu Q, Wang Z and Ye Y (2004) Genetic variation analy-sis within and among six varieties of common carp (Cyprinus carpioL.) in China using microsatellite markers. Russ J Genet 40 (10):1144-1148.