Fascicle VI – Food Technology 36(1) 61-73
ORIGINAL RESEARCH PAPER
EVALUATION OF NUTRITIONAL QUALITY OF THE COMMON CARP (CYPRINUS CARPIO) ENRICHED IN FATTY ACIDS
IULIANA APRODU1*, AIDA VASILE1, GABRIELA GURAU2, AURELIA IONESCU1, ELPIDA PALTENEA3
1
Faculty of Food Science and Engineering, „Dunarea de Jos” University of Galati
2
Faculty of Medicine and Pharmacy, „Dunarea de Jos” University of Galati
3
Institute of Research and Development for Aquatic Ecology, Fishing and Aquaculture Galati, România
*Corresponding author: [email protected]
Received on 15 March 2012 Revised on 25 May 2012
The knowledge of the feed requirements of fish species allows developing well-balanced feed formulations for successful intensive culture. The target of this study was to investigate the effect of supplementing the fish fodder with different types of oils, on fish growing and meat quality. The experiments were conducted on common carp using olive, soy and fish oil preparations. The results of these experiments showed that increasing the content of fats in fish diet allowed a faster growth of common carp and better weight increasing results. The fatty acids and aminoacids profiles of the fish meat highly depended on the type of oil used in the feeding experiment. According to our results, out of the tested variants the fish oil based fodder is most favorable for fish feeding, allowing the accumulation of large quantities of highly unsaturated fatty acids in meat.
Keywords: common carp, fodder, fish oil, olive oil, soy oil, fatty acids, aminoacids
Introduction
Common carp (Cyprinus carpio L.) is the main aquaculture species in many European, Asian and Latin American countries.
feed formulations for certain fish species supports the industrial aquaculture, which must expand to meet the growing demand for safe and high quality fish products at affordable prices.
When fish are raised in closed systems or in high density ponds, they must be provided with a high quality diet, complete and nutritionally balanced, allowing the rapid fish growth and good health. The complete fish feed provides all essential nutritional compounds, such as proteins, carbohydrates, fats, vitamins and minerals (Gangadhara et al., 1997; Cho et al., 2005). Most of the fish feeds available on the market have the following composition: proteins (18-50%), lipids (10-25%), carbohydrates (15-20%), ash (<8.5%), phosphor (<1.5%), moisture (<10%) and traces of vitamins and minerals.
On the other hand, the incomplete fish feed/diets do not contain the whole range of vitamins or mineral and are designed to act as supplements to the natural feeding available in the open fish farming systems.
The effect of fish and vegetable oils on fish nutrition and health is not enough studied. Some authors reported that oil supplemented diets improve the lipid contents in case of Pseudoplatystoma coruscans (Martino et al, 2002), Labeo rohita (Satpathy et al. 2003), Scophthalmus maximus L. (Cho et al, 2005),
Epinephelus coioides (Luo et al, 2005), Sparus latus (Hu et al, 2007), Epinephelus malabaricus (Tuan and Williams, 2007) and Sander lucioperca (Schulz et al, 2008).
The contents of different types of fatty acids in fish and vegetable oils are very different: unlike vegetable oil, fish oil is rich in highly unsaturated fatty acids. Due to these differences, it is expected to involve different metabolic pathways and to have a different impact on fish nutrition and health. The aim of the present study was to investigate the effect of feeding the common carp with fodder supplemented with olive, soy and fish oil. After the feeding experiment, the fish meat was checked in terms of fatty acid and aminoacid profiles.
Materials and methods
Materials
The experiment was conducted in the autumn of 2011 (from 14th of September to 7th of November) on common carp (Cyprinus carpio).
The cyprinids obtained through natural reproduction system in the spring of 2011, were transferred form the Base of Research – Development Brates, Galati into water basins were the fish was fed for 54 days with different nutritional supplements.
Fish feeding experiments
The feeding experiments were carried out in basins of the National Research and Development Institute for Aquatic Ecology, Fishing and Aquaculture, Galati. The feed ratio was 5% from the total mass of biologic mate. The water parameters (O2,
pH, temperature, NH4+, NO2-, PO43-) were monitored twice a day and were checked
Four different types of fodder were used for feeding the summer-aged common carp:
- experiment I (codified with M) - the feeding was performed using the commercial by available fodder CLASSIC K, which is specially developed
for common crap feeding in agreement with AminoBalance and
LipoBalance concepts to ensure the optimum equilibrium of amino acids and lipids profiles;
- experiment II (codified with FC1) - the feeding was performed with
CLASSIC K fodder supplemented with 5% olive oil, having 12.8% saturated fatty acids, 71% monounsaturated fatty acids and 7.8% polyunsaturated fatty acids;
- experiment III (codified with FC2) - the feeding was performed with
CLASSIC K fodder supplemented with 5% soy oil provided by SC 22E-Prod SRL, Alexandria, Romania;
- experiment IV (codified with FC3) - the feeding was performed with
CLASSIC K fodder supplemented with 5% fish oil obtained from cod liver, with the following fatty acids composition: 1.6 g saturated fatty acids/10 ml, 4.6 g monounsaturated fatty acids/10 ml, 3 g polyunsaturated fatty acids/10 ml, 0.7 g eicosapentaenoic acid (EPA)/10 ml and 0.9 g docosahexaenoic acid (DHA)/10 ml.
According to the producers, the CLASSIC K fodder has the following ingredients: whole soy flour, corn, fish flour, wheat, sunflower grist, fish oil, soy oil, rapeseed oil and butylhydroxytoluene. The fodder supplementation with oils was carried out in the laboratories of National Research and Development Institute for Aquatic Ecology, Fishing and Aquaculture, Galati, using a laboratory extruder.
Ten specimens from the four different experiments were randomly selected for biometric and physico-chemical analysis.
Physical and chemical analysis
The composition of the fodder and of the fish before and after feeding in the basins was checked.
The proximate composition was determined as follows: the moisture, protein and ash contents were determined according to standard AOAC (1995) methods; the fat content by extraction with ether through Soxhlet method. The total glucides content was calculated by subtracting the protein, fat, ash and moisture content from the total weight of the samples.
pH measurements were made according to AOAC (1984). Ten grams of sample were homogenized with 90 ml distilled water for 2 min using the Braun mixer. The obtained mixture was filtered and the pH of the filtrate determined by means of a Hanna digital pH-meter.
Fatty acids profiling
The fatty acids profiles of both fodder and fish meat was determined by means of gas chromatography (GC).
In order to extract the lipids, the homogenized samples were dried for 1 h at 105oC. Prior to analysis, the fat was subjected to saponification and the free fatty acids were converted to methyl esters.
GC analyses were performed on Perkin Elmer CLARUS 500 equipped with flame ionization detector (FID) and with DB-23 capillary column (length 60 m, diameter 0.25 mm, film thickness 0.25 µm).
The injector temperature was 250oC, and samples were injected manually (1 μl). The temperature increased from 180oC to 280oC at a rate of 5oC/minut. The hydrogen was used as carrier gas at a flow rate of 35 cm/s, 180oC. The detector temperature was 260oC.
The standard used was Supelco-Supelco ® 37 Component FAME Mix.
Amino acids profiling
The amino acids profile of the fish meat was determined by means of High-Performance Liquid Chromatography (HPLC). The samples were prepared for analyses by the oxidation of sulphur-containing amino acids and acidic hydrolysis of the peptide bonds.
The HPLC Surveyor Plus (Thermo Electro) was used for analyses and the amino acids were separated on a Hypersil BDS C18 column (250 x 4.6 mm, 5 μm) in conjunction with a gradient elution. Eluent A was sodium phosphate buffer pH 7 and eluent B was a mixture of acetonitrile:methanol:water (45: 45: 10). The volume of sample injected was 25 μl, the flow rate was 1.0 ml/min and the column temperature was set at 25oC. The emission wavelength was 336 nm.
Statistical analysis
Statistical analysis was carried out by means of Excel tools. All analyses were carried out in triplicate. The average values are reported together with standard deviations.
Results and discussion
Chemical analyses of fodder
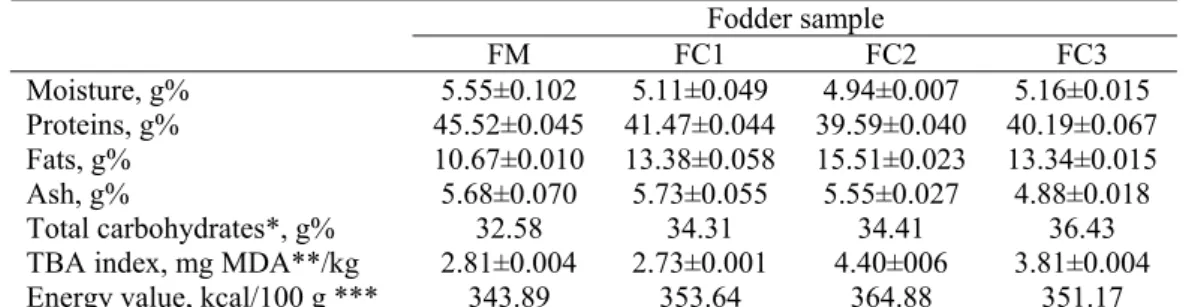
The composition of the fodders used for fish feeding is presented in Table 1. The protein content of the fodder samples supplemented with different types of oil decreased; the lowest value (39.59%) was obtained in case of the fodder supplemented with 5% soy oil.
The energy value of the FM sample was comparable with that indicated by the producer, but lower with respect to the samples supplement with different types of oils (Table 1).
Table 1. Chemical composition of the fodders
Fodder sample
FM FC1 FC2 FC3
Moisture, g% 5.55±0.102 5.11±0.049 4.94±0.007 5.16±0.015 Proteins, g% 45.52±0.045 41.47±0.044 39.59±0.040 40.19±0.067 Fats, g% 10.67±0.010 13.38±0.058 15.51±0.023 13.34±0.015 Ash, g% 5.68±0.070 5.73±0.055 5.55±0.027 4.88±0.018 Total carbohydrates*, g% 32.58 34.31 34.41 36.43 TBA index, mg MDA**/kg 2.81±0.004 2.73±0.001 4.40±006 3.81±0.004 Energy value, kcal/100 g *** 343.89 353.64 364.88 351.17 * Total carbohydrates and other chemical components estimated by subtracting the moisture, proteins, fats and ash from the total weight;
**MDA-malondialdehyde;
***calories conversion factors used: for proteins 4.3 kcal/g, for lipids 9.0 kcal/g; for carbohydrates 1.6 kcal/g.
The composition of the fodders used in our experiment is quite different with respect to those indicated by Kukačka et al. (2009) that have protein contents of 29.5-33.8% and fat contents ranging from 9.1 to 19%. Moreover, Manjappa et al. (2005) used for carp feeding fodder with the following proximate composition: proteins 23.85-24.84%, fats 6.85-13.01% and ash 12.98-13.38%.
The addition of soy and fish oils caused the significant increase of the compounds reacting with TBA. The high values of the TBA index in case of these samples (4.4 and 3.81 mg MDA/kg in case of FC2 and FC3, respectively) give indications about the reduced oxidative stability which requires special storing conditions such as low temperature, absence of light, low relative humidity and the use of well-sealed packages.
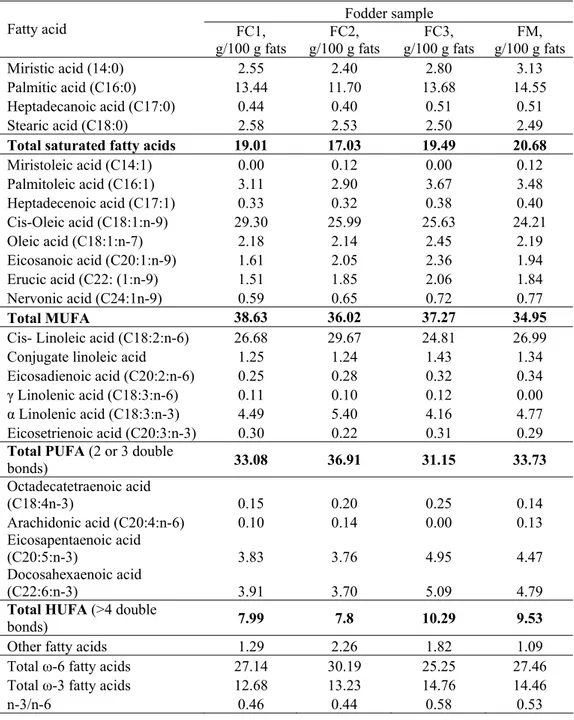
The profiles of the fatty acids of the fodders used in our experiments were comparable (Table 2). The level of saturated fatty acids varied in the following order: FM>FC3>FC1>FC2. The addition of soy oil caused the most important decrease of the saturated fatty acids, mostly as a consequence of the reduced content of palmitic acid. The addition of vegetable and fish oils caused the increase of the monounsaturated fatty acids (MUFA) levels, mainly of oleic acid cis omega 9. The presence of miristoleic acid was registered only in the case of the fodder with soy oil.
Table 2. The profiles of the fatty acids in the fodder samples
Fodder sample
Fatty acid FC1,
g/100 g fats
FC2, g/100 g fats
FC3, g/100 g fats
FM, g/100 g fats Miristic acid (14:0) 2.55 2.40 2.80 3.13 Palmitic acid (C16:0) 13.44 11.70 13.68 14.55
Heptadecanoic acid (C17:0) 0.44 0.40 0.51 0.51 Stearic acid (C18:0) 2.58 2.53 2.50 2.49
Total saturated fatty acids 19.01 17.03 19.49 20.68 Miristoleic acid (C14:1) 0.00 0.12 0.00 0.12 Palmitoleic acid (C16:1) 3.11 2.90 3.67 3.48
Heptadecenoic acid (C17:1) 0.33 0.32 0.38 0.40 Cis-Oleic acid (C18:1:n-9) 29.30 25.99 25.63 24.21
Oleic acid (C18:1:n-7) 2.18 2.14 2.45 2.19 Eicosanoic acid (C20:1:n-9) 1.61 2.05 2.36 1.94 Erucic acid (C22: (1:n-9) 1.51 1.85 2.06 1.84 Nervonic acid (C24:1n-9) 0.59 0.65 0.72 0.77
Total MUFA 38.63 36.02 37.27 34.95
Cis- Linoleic acid (C18:2:n-6) 26.68 29.67 24.81 26.99 Conjugate linoleic acid 1.25 1.24 1.43 1.34 Eicosadienoic acid (C20:2:n-6) 0.25 0.28 0.32 0.34
γ Linolenic acid (C18:3:n-6) 0.11 0.10 0.12 0.00
α Linolenic acid (C18:3:n-3) 4.49 5.40 4.16 4.77
Eicosetrienoic acid (C20:3:n-3) 0.30 0.22 0.31 0.29 Total PUFA (2 or 3 double
bonds) 33.08 36.91 31.15 33.73
Octadecatetraenoic acid
(C18:4n-3) 0.15 0.20 0.25 0.14
Arachidonic acid (C20:4:n-6) 0.10 0.14 0.00 0.13 Eicosapentaenoic acid
(C20:5:n-3) 3.83 3.76 4.95 4.47
Docosahexaenoic acid
(C22:6:n-3) 3.91 3.70 5.09 4.79
Total HUFA (>4 double
bonds) 7.99 7.8 10.29 9.53
Other fatty acids 1.29 2.26 1.82 1.09 Total ω-6 fatty acids 27.14 30.19 25.25 27.46 Total ω-3 fatty acids 12.68 13.23 14.76 14.46
n-3/n-6 0.46 0.44 0.58 0.53
n-3/n-6 ratio was 1.15 in the case of Ro6 and only 0.58 in the case of FC3. These differences in terms of fatty acids are mainly due to the particular composition of the fodders. The Ro6 had the following composition: fish flour (16%), rapeseed flour (12%), soy flour (12%), Vitex (10%), whey (3%); wheat (4%), wheat flour (30%), lecithin (3%), and Aminovitan (2%) (Kukačka et al., 2009).
Analyses of the fish before differential feeding
The common carp used for differential feeding experiments had the following biometric parameters: length of 129.37±18.45 mm, diameter of 110.88±8.04 mm and weight of 59±17.07 g. The statistical analyses indicated good linear correlation coefficients between weight and length (r = 0.976) and between length and diameter (r = 0.931).
The ponderal anatomy parameters of the common carp are presented in Table 3. The amount of fish meat before differential feeding experiments correlates well with the fish weight (r = 0.840) and only lower linear correlation coefficients were indentified in case of the viscera and bones (r = 0.494).
Table 3. Ponderal anatomy of fish before and after 54 days of differential feeding experiments
Fish sample
Meat, %
Head, %
Viscera, %
Scales, %
Skin, %
Bones, %
Flippers, %
Blood, % Initial 42.70 27.82 11.65 3.42 5.72 5.98 2.33 0.31 FC1 41.55 21.12 13.20 3.16 8.68 8.48 3.27 0.54 FC2 42.05 22.16 11.09 3.90 9.21 7.17 3.92 0.50 FC3 42.33 22.17 12.68 3.21 7.02 8.35 3.85 0.39 FM4 41.44 22.27 13.98 4.07 6.55 7.27 3.92 0.51
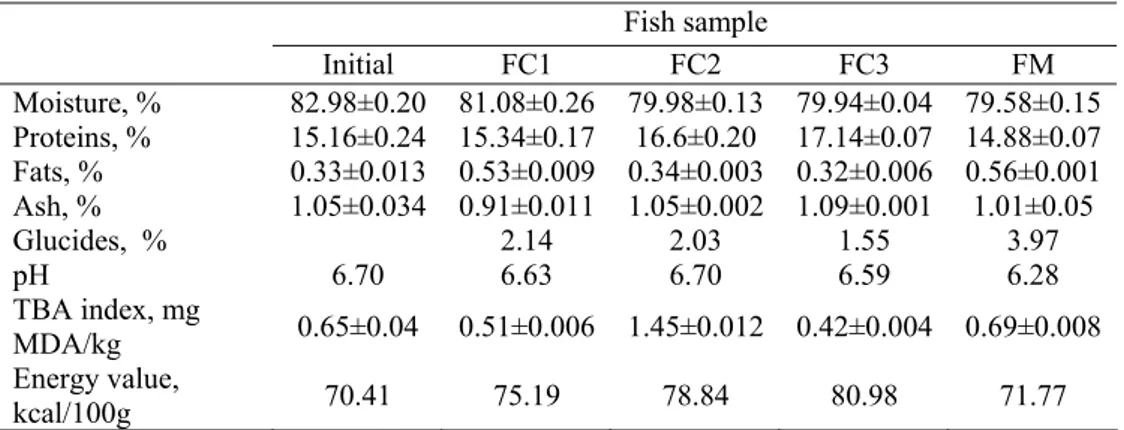
The proximate composition of fish meat is presented in Table 4. Before differential feeding experiments fish meat had high moisture contents, medium protein contents and low fat contents, and therefore had slows energy value of 70.41 kcal/100g.
Table 4. Proximate composition of the fish meat before and after 54 days of differential feeding experiments
Fish sample
Initial FC1 FC2 FC3 FM Moisture, % 82.98±0.20 81.08±0.26 79.98±0.13 79.94±0.04 79.58±0.15 Proteins, % 15.16±0.24 15.34±0.17 16.6±0.20 17.14±0.07 14.88±0.07 Fats, % 0.33±0.013 0.53±0.009 0.34±0.003 0.32±0.006 0.56±0.001 Ash, % 1.05±0.034 0.91±0.011 1.05±0.002 1.09±0.001 1.01±0.05
Glucides, % 2.14 2.03 1.55 3.97
pH 6.70 6.63 6.70 6.59 6.28
TBA index, mg
MDA/kg 0.65±0.04 0.51±0.006 1.45±0.012 0.42±0.004 0.69±0.008 Energy value,
Analyses of fish after differential feeding
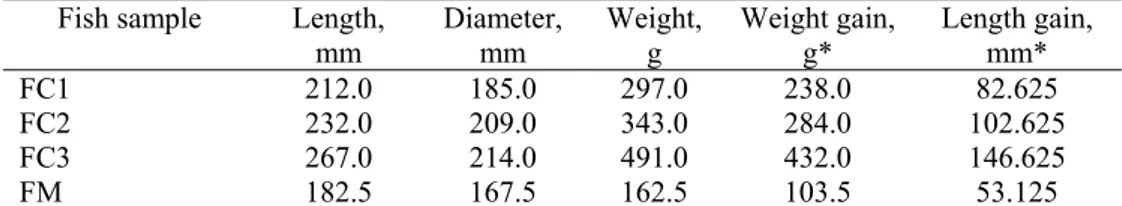
Fish fed with fodder supplemented with fish oil had the highest biometric parameters (Table 5). The fodder supplemented with olive oil was less efficient, the effect on common carp growing being comparable with that of FM. The efficiency of fish growing in case of the feeding with FC 2 and FC3 fodders might be due to the efficient use of available proteins from diet and to the appropriate lipids satisfying the energetic requirements (Caballero, et al., 1999; Satpathy, et al., 2003). The carp proteins requirements vary with the age from 25% to 35% (Hossain, et al., 1997). Steffens (1996) suggested that the increase of diet energetic density can be a strategy for proteins saving and limiting the ammonium production in case of different fish species, including common carp.
According to Manjappa et al. (2002) the addition of 3% sardine oil in common carp fodder as well as a diet with 10% fish flour allows an appropriate growth of the fish. Gangadhara et al. (1997) showed, in the case of the Indian carp rohu (Labeo rohita), that diets with 25% proteins and 9% fats or with 30% proteins and 6% fats allowed comparable results in terms of growing.
Table 5. Biometric parameters of the common carp after differential feeding
Fish sample Length, mm
Diameter, mm
Weight, g
Weight gain, g*
Length gain, mm*
FC1 212.0 185.0 297.0 238.0 82.625
FC2 232.0 209.0 343.0 284.0 102.625
FC3 267.0 214.0 491.0 432.0 146.625
FM 182.5 167.5 162.5 103.5 53.125
*weight and length gain were established in direct relation with the mean values of the samples before differential feeding
Concerning the ponderal anatomy of the fish differentially fed, the results presented in Table 3 indicate that there are no significant differences within samples. On the other hand, the proximate composition varied with the type of fodder (Table 4).
The fish fed with fodder supplemented with fish and soy oil had 1.1-1.98% lower moisture contents with respect to the FC1 and FM. The dry matter increase is mainly related to the advanced protein synthesis (Fafioye et al., 2005); the protein levels in the FC2 and FC3 fish samples were 16.6% and 17.14, respectively. Our results concerning the increase of protein contents in the case of supplementing the fish diets with oil are in agreement with the observations of Gangadhara et al. (1997) for Labeo rohita, of Bazaz and Keshavanath (1993) for Tor khudree and of Cho et al. (2005) for Scophthalmus maximus L.
Wirth (2007) reported 3.4 g fats/100g d.w. when supplementing the fish diets with cereals. These variations in the fat content can be explained by the differences in the fish weight, diet, growing conditions and samples preparation procedure. On the other hand, the increase of oil in the diet causes the increase in lipase activity in the hepatopancreas of Tor khudree, Labeo rohita and Dicentrarchus labrax (Bazaz and Keshavanath, 1993; Gangadhara et al., 1997; Peres and Oliva-Teles, 1999).
Analyzing the results in Table 4, one can see that the fodder FC2 caused the accumulation of high levels of compounds reacting with 2-thiobarbituric acid that can significantly influence fish health and consumer health.
Fodder supplementation with oils caused relative by small increases in the energetic value compared to the control sample (Table 4). The highest energetic value was obtained in the case of the FC3 fish sample (80.98 kcal/100g) which is ~13% higher compared to the control sample.
Fatty acids profiling
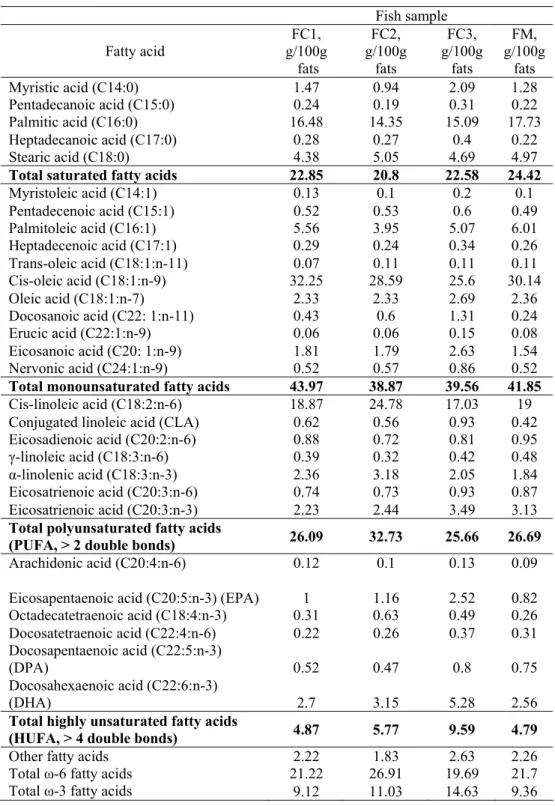
The fatty acids profiles of the fish meat samples are presented in Table 6. Feeding the fish with fodder supplemented with 5% fish, soy or olive oil caused the reduction of the total amount of saturated fatty acids compared to the control sample. The lowest level of palmitic acid (14.35 g/100 g fats) was registered in the case of FC2 fish sample (Table 6).
Concerning the content of MUFA, the FC1 fodder caused the accumulation in the fish meat of 43.97 g MUFA/100 g fats, which is comparable to the control sample (41.85 g/100 g fats) and much higher compared to the FC2 (38.87 g/100 g fats). The contents of palmitoleic (C16:1) and cis-oleic acids (C18:1n-9) are lower in the case of FC2 and FC3 fish samples compared to the FC1 and FM (Table 6). The presence of fish oil in the fodder was the origin of doubling the content of docosanoic acid (C22:1:n-11) with respect to the control sample. A similar trend was observed also in the case of ecosanoic acidul (C20:1:n-9), but at higher levels. The highest level of nervonic acid (C24:1n-9) was found in the FC3 fish sample. The differential fish feeding also reflected in the PUFA profile. The addition of soy oil in fish diet was reflected in the significant increase of PUFA to 32.73 g/100 g fats, while the fish oil induced higher synthesis of conjugated linoleic acid (0.93 g/100 g fats) and eicosatrienoic acid (C20:3:n-3) (3.49 g/100 g fats).
The diet with fish oil favored the highest accumulation of HUFA (9.59 g/100 g fats) in fish, while the other samples had HUFA content ranging from 4.79 to 5.77 g/100 g fats. The highest amounts of HUFA in FC3 fish sample are 5.28 g DHA/100 g fats 2.52 g EPA/100 g fats, and 0.8 g DPA/100 g fats. On the other hand, high amounts of octadecatetraenic acid (C18:4n-3) and DHA were found in the fish samples fed with soy oil (Table 6). The high content of polyunsaturated fatty acids has beneficial health effects (Steffens, 1996).
Table 6. The profiles of fatty acids in the fodder samples
Fish sample
Fatty acid
FC1, g/100g
fats
FC2, g/100g
fats
FC3, g/100g
fats
FM, g/100g
fats Myristic acid (C14:0) 1.47 0.94 2.09 1.28 Pentadecanoic acid (C15:0) 0.24 0.19 0.31 0.22 Palmitic acid (C16:0) 16.48 14.35 15.09 17.73 Heptadecanoic acid (C17:0) 0.28 0.27 0.4 0.22 Stearic acid (C18:0) 4.38 5.05 4.69 4.97 Total saturated fatty acids 22.85 20.8 22.58 24.42 Myristoleic acid (C14:1) 0.13 0.1 0.2 0.1 Pentadecenoic acid (C15:1) 0.52 0.53 0.6 0.49 Palmitoleic acid (C16:1) 5.56 3.95 5.07 6.01 Heptadecenoic acid (C17:1) 0.29 0.24 0.34 0.26 Trans-oleic acid (C18:1:n-11) 0.07 0.11 0.11 0.11 Cis-oleic acid (C18:1:n-9) 32.25 28.59 25.6 30.14 Oleic acid (C18:1:n-7) 2.33 2.33 2.69 2.36 Docosanoic acid (C22: 1:n-11) 0.43 0.6 1.31 0.24 Erucic acid (C22:1:n-9) 0.06 0.06 0.15 0.08 Eicosanoic acid (C20: 1:n-9) 1.81 1.79 2.63 1.54 Nervonic acid (C24:1:n-9) 0.52 0.57 0.86 0.52 Total monounsaturated fatty acids 43.97 38.87 39.56 41.85 Cis-linoleic acid (C18:2:n-6) 18.87 24.78 17.03 19 Conjugated linoleic acid (CLA) 0.62 0.56 0.93 0.42 Eicosadienoic acid (C20:2:n-6) 0.88 0.72 0.81 0.95 γ-linoleic acid (C18:3:n-6) 0.39 0.32 0.42 0.48 α-linolenic acid (C18:3:n-3) 2.36 3.18 2.05 1.84 Eicosatrienoic acid (C20:3:n-6) 0.74 0.73 0.93 0.87 Eicosatrienoic acid (C20:3:n-3) 2.23 2.44 3.49 3.13 Total polyunsaturated fatty acids
(PUFA, > 2 double bonds) 26.09 32.73 25.66 26.69 Arachidonic acid (C20:4:n-6) 0.12 0.1 0.13 0.09
Eicosapentaenoic acid (C20:5:n-3) (EPA) 1 1.16 2.52 0.82 Octadecatetraenoic acid (C18:4:n-3) 0.31 0.63 0.49 0.26 Docosatetraenoic acid (C22:4:n-6) 0.22 0.26 0.37 0.31 Docosapentaenoic acid (C22:5:n-3)
(DPA) 0.52 0.47 0.8 0.75
Docosahexaenoic acid (C22:6:n-3)
(DHA) 2.7 3.15 5.28 2.56
Total highly unsaturated fatty acids
(HUFA, > 4 double bonds) 4.87 5.77 9.59 4.79 Other fatty acids 2.22 1.83 2.63 2.26 Total ω-6 fatty acids 21.22 26.91 19.69 21.7 Total ω-3 fatty acids 9.12 11.03 14.63 9.36
Amino acids profiling of the fish meat
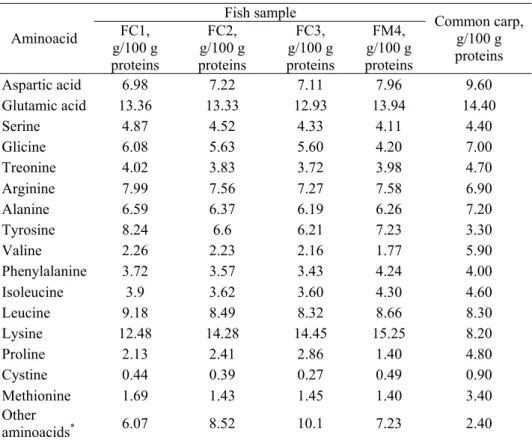
In Table 7 is presented the amino acids profile of the analyzed fish meat samples. Out of the aminoacids known to be present in fish meat, histidine and hydroxyproline were not identified and quantified.
The acid treatment used to hydrolyze the proteins to aminoacids is known to affect totally the tryptophan residues and partially the sulfur containing aminoacids. There are no significant differences between fish samples in terms of aminoacids contents (Table 7). The fish sample FC1 had lower lysine and higher tyrosine and isoleucine contents compared to the other samples. The control sample had the highest contents of lysine, phenylalanine, isoleucine and leucine and the lowest proline contents.
Table 7. The amino acids profile of fish samples fed with different types of fodder
* estimated by subtracting the total amount of aminoacids quantified from 100 g proteins
The fish diet and other growing conditions influence the protein composition of the common carp. Comparing the profile of the aminoacids of the fish samples differentially fed to that of the wild common carp (Table 7), one can see that the levels of aspartic acid, glutamic acid, glycine, alanine, valine, proline, cystine and methionine were higher, while the levels of tyrosine, lysine and other aminoacids are lower in the case of the wild fish. The ratio essential/nonessential aminoacids
Fish sample
Aminoacid FC1, g/100 g proteins
FC2, g/100 g proteins
FC3, g/100 g proteins
FM4, g/100 g proteins
Common carp, g/100 g proteins
Aspartic acid 6.98 7.22 7.11 7.96 9.60 Glutamic acid 13.36 13.33 12.93 13.94 14.40
Serine 4.87 4.52 4.33 4.11 4.40
Glicine 6.08 5.63 5.60 4.20 7.00
Treonine 4.02 3.83 3.72 3.98 4.70
Arginine 7.99 7.56 7.27 7.58 6.90
Alanine 6.59 6.37 6.19 6.26 7.20
Tyrosine 8.24 6.6 6.21 7.23 3.30
Valine 2.26 2.23 2.16 1.77 5.90
Phenylalanine 3.72 3.57 3.43 4.24 4.00
Isoleucine 3.9 3.62 3.60 4.30 4.60
Leucine 9.18 8.49 8.32 8.66 8.30
Lysine 12.48 14.28 14.45 15.25 8.20
Proline 2.13 2.41 2.86 1.40 4.80
Cystine 0.44 0.39 0.27 0.49 0.90
Methionine 1.69 1.43 1.45 1.40 3.40 Other
was significantly higher in the case of the wild common fish compared to the experimental ones.
Conclusions
The fat rich diets allowed a faster growth of the common carp due to a more efficient use of the fodder. The best fish weight growing results were obtained in case of feeding the fish with fodder supplemented with fish oil. The use of the fodder supplemented with fish and soy oil allowed obtaining fish samples with higher dray matter, protein and ash contents compared to the case when the olive oil was used. The fat content of FC1 fish sample was comparable to the control and higher than the FC2 and FC3 fish samples.
The supplementation of the fish diets with lipids reflected on the fatty acids profile of the fish meat. The fodder with fish oil favored the accumulation of HUFA, especially EPA, DPA and DHA. The fodder supplemented with oils of vegetable origin did not influence the ratio n-3/n-6 fatty acids in the fish meat with respect to the control sample.
The different fodder used in the experiment also caused variations in the aminoacids profile of the fish meat; the ratio essential/nonessential aminoacids is lower compared to the wild common carp.
Taking into account the results obtained we may conclude that the best fodder is CLASSIC K supplemented with 5% fish oil.
References
AOAC. 1984. Official methods of analysis (11th ed.). Washington, DC: Association of Official Analytical Chemists.
AOAC. 1995. Official methods of analysis (16th ed.). Washington, DC: Association of Official Analytical Chemists.
Bazaz, M.M., and Keshavanath, P. 1993. Effect of feeding different levels of sardine oil on growth, muscle composition and digestive enzyme activities of mahseer, Tor khudree.
Aquaculture, 115, 111-119.
Caballero, M.J., Lopez, G., Socotto, J., Roo, F., J., Izuierd, M.S., and Fernandez, A.J. 1999. Combined effect of lipid level and fish meal quality on liver histology of Gilthead sea braem (Sparus aurata). Aquaculture, 179, 277-290.
Cho, S.H. Lee, S.M., and Lee, J.H., 2005. Effect of dietary protein and lipid levels on growth and body composition of juvenile turbot (Scophthalmus maximus L.) reared under optimum salinity and temperature conditions. Aquaculture Nutrition, 11, 235-240.
Fafioye, O.O., Fagade, S.O., Adebisi, A.A., Jenyo-Oni, and Omoyinmi, G.A.K. 2005. Effects of Dietary Soybeans (Glycine max (L.) Merr.) on Growth and Body Composition of African Catfish (Clarias gariepinus, Burchell) Fingerlings. Turkish Journal of Fisheries and Aquatic Science, 5, 11-15.
Fajmonová, E., Zelenka, J., Komprda, T., Kladroba,D., and Šarmanová, I. 2003: Effect of sex, growth intensity and heat treatment on fatty acid composition of common carp (Cyprinus carpio) fillets. Czech Journal of Animal Science, 48(2), 85-92.
Hossain, M.A., Naher, N., and M. Kamal, M. 1997. Nutrient digestibility coefficients of some plant and animal proteins for rohu (Labeo rohita). Aquaculture, 151, 37-45. Hu, Y.H., Liu, Y.J., Tian, L.X., Yang, H.J., Liang, G.Y., and Gao, W. 2007. Optimal
dietary carbohydrate to lipid ratio for juvenile yellowfin seabream (Sparus latus).
Aquaculture Nutrition, 13, 291-297.
Ikeda, A.K., Zuanon, J.A.S., Salaro, A.L., Freitas, M.B.D., Pontes, M.D., Souza, L.S., and Santos, M.V. 2011.Vegetable oil sources in diets for freshwater angelfish (Pterophyllum scalare, Cichlidae): growth and thermal tolerance. Arquivo Brasileiro de Medicina Veterinária e Zootecnia, 63(3), 670-677.
Ionescu, A., Berza, M., and Banu C. 1992. Metode şi tehnici pentru controlul peştelui şi al produselor din peşte/Methods and techniques for fish and fishery products control. „Dunărea de Jos” University of Galati Publishing hous Galaţi.
Kukačka, V., Chaloupková, L., Fialová, M., Kopp, R., and Mareš, J. 2009. The influence of linseed oil and fish oil supplements to the fatty acid spectrum of common carp
(Cyprinus carpio L.) muscle. Acta Universitatis Agriculturae et Silviculturae
Mendeleianae Brunensis, LVII, 5, 193-192.
Luo, Z., Liu, Y.J., Mai, K.S., Tian, L.X., Liu, D.H., Tan, X.Y., and Lin, H.Z. 2005. Effect of dietary lipid level on growth performance, feed utilization and body composition of grouper Epinephelus coioides juveniles fed isonitrogenous diets in floating netcages.
Aquaculture International, 13, 257-269.
Manjappa, K., Keshavanath, P., and Gangadhara, B. 2002. Growth performance of common carp, Cyprinus carpio fed varying lipid levels through low protein diet, with a note on carcass composition and digestive enzyme activity. Acta Ichthyologica et Piscatoria, 32, 146-155.
Manjappa, K., Keshavanath, P., and Gangadhara, B. 2011. Influence of sardine oil supplemented fish meal free diets on common carp (Cyprinus carpio L.) growth, carcass composition and digestive enzyme activity. Journal of Fisheries and Aquatic Science, 6(6), 604-613.
Martino, R.C., Cyrino, J.E.P., Portz, L., and Trugo, L.C. 2002. Effect of dietary lipid level on nutritional performance of the surubim, Pseudoplatystoma coruscans. Aquaculture, 209, 209-218.
Narejo, N.T., Dars, B.A., and Achakzai, G.D. 2010. Preparation of low-cost fish feed for the culture of Labeo rohita (hamilton) in glass aquaria. Sindh University Research Journal (Science. Series), 42(2), 7-10.
Peres, H., and Oliva-Teles, A. 1999. Effect of dietary lipid level on growth performance and feed utilization by European sea bass juveniles Dicentrarchus labrax. Aquaculture, 179, 325-334.
Satpathy, B.B., Mukherjee, D., and Ray, A.K. 2003. Effect of dietary protein and lipid levels on growth, feed conversion on body composition in rohu, Labeo rohita
(Hamilton), fingerlings. Aquaculture Nutrition, 9, 17-24.
Steffens, W. 1996. Protein sparing effects and nutritive significance of lipid supplementation in carp diet. Archives of Animal Nutrition, 49, 93-98.
Steffens, W., and Wirth, M. 2007. Influence of nutrition on the lipid quality of pond fish: common carp (Cyprinus carpio) and tench (Tinca tinca), Aquaculture International, 15(3-4), 313-319.
Tuan, L.A., and Williams, K.C. 2007. Optimum dietary protein and lipid specifications for juvenile malabar grouper (Epinephelus malabaricus). Aquaculture, 267, 129-138. Schulz, C., Huber, M., Ogunji J., and Rennert, B. 2008. Effects of varying dietary protein to