Palavras chave: Influência de um defeito Frequências de flexão Ensaio não destrutivo Historic: Recebido 15/02/2013 Aceito 04/02/2015 Keywords: Defect influence Flexural frequencies Non-destructive testing
1 Karaj Branch, Islamic Azad University-Karaj, Iran
2 Agricultural Research Centre for International Development - Montpellier, France Correspondence:
DOI: 10.1590/01047760201521021674
Mehran Roohnia1, Loïc Brancheriau2
ORIENTATION AND POSITION EFFECTS OF A LOCAL HETEROGENEITY ON FLEXURAL VIBRATION FREQUENCIES IN WOODEN BEAMS
ABSTRACT: Studying the influence of defect on the dynamic behavior of wood in order to detect the local heterogeneities is of great importance in non-destructive testing of wood. The natural heterogeneities in wood are oriented in a volume. However, one-dimensional models are still used in dynamic characterization of wooden beams. The aim of this study was to experimentally investigate the effects of the orientation and position of an artificial defect on the flexural vibration frequencies. Different batches of Fagus orientalis specimens were drilled in the radial direction at five positions along the specimen. Dynamic tests in free flexural vibration were performed on the specimens before and after drilling both in the longitudinal-radial (LR) and longitudinal-tangential (LT) bending plan. The behavior in free flexural vibration was found to be different depending on the position and orientation of heterogeneity. When the drilling axis lies in the bending plane (LR), the weakening of frequency was maximal at the location of an antinode of vibration. On the contrary, the frequency offset was maximal in the place of a vibration node when the drilling axis was orthogonal to the bending plane (LT).
EFEITOS DA ORIENTAÇÃO E DA POSIÇÃO DE UMA HETEROGENEIDADE LOCAL SOBRE AS FREQUENCIAS DE VIBRAÇÃO DE FLEXÃO DE VIGAS DE MADEIRA
FREQUENCIES IN WOODEN BEAMS
INTRODUCTION
The one-dimensional theories of vibration, developed by Bernoulli and improved by Timoshenko, are valid for homogeneous isotropic materials. These theories were also applied to uniformly orthotropic materials such as clear wood (BODIG; JAYNE, 1993; BORDONNÉ, 1989; BRANCHERIAU; BAILLÈRES, 2002; HEARMON, 1966). The Euler-Bernoulli’s modulus value decreases when the frequency rank increases because of the effect of the shear deflection and rotary inertia mentioned by Timoshenko (HARRIS; PIERSOL, 2002). But experimental values of the Young’s moduli from Euler-Bernoulli’s elementary theory do not
always show this tendency. In this case, the correlation
coefficient associated to the Timoshenko’s modulus computation would be low and the obtained result would not be reliable (BORDONNÉ, 1989). Such material is thus not homogeneous due to the presence of local heterogeneities.
Previous authors (CAM et al., 2004; DIVOS et al., 2001; SOBUE et al., 2010; SONG et al., 2011) studied the influence of defect on the dynamic behavior of wood in order to detect and positioned the local heterogeneities. Divos et al. (2001), by the means of a time analysis technique, showed that the amplitude of the received signal was more sensitive to the presence of defect than the measurement of the propagation velocity. Cam et al. (2004) studied the vibrations due to impact shock on beams (impact-echo method). They compared the signal obtained from the defective and non-defective beams both in time and frequency domain. It was shown that the differences between defective and non-defective beams cannot be distinguished in the time domain. However, the differences revealed information about the defect in the frequency domain. Sobue et al. (2010) analyzed the resonance frequencies of beams in longitudinal vibrations. They exploited an inverse solution procedure enabling the identification of the defect position within a beam. The defect position was well identified, but the procedure was limited to the identification of two dominant defects. Song et al. (2011) used a modal analysis technique allowing the determination of the mode shapes and resonance frequencies. They were not able to determine the position of the defect by the change rate of frequency. It was found that the modal shape of the node near the defect always jumps abruptly, so it was possible to estimate the particular position of defect in the lumber.
These previous works have used one-dimensional models. However, the natural heterogeneities in wood are oriented in a volume. The aim of this study was thus to investigate experimentally the effects of orientation and position of a local heterogeneity on flexural vibration frequencies. Holes were drilled with different orientations and positions in a set of clear wooden samples and the vibration frequencies were determined before and after drilling.
MATERIALS AND METHODS
Materials
A set of Oriental Beech (Fagus orientalis) timber specimens was collected from two commercial logs. Following ISO 3129 (INTERNATIONAL ORGANIzATION FOR STANDARDIzATION - ISO, 1975), 100 rectangular, visually clear and sound wooden bars were randomly obtained from different parts of the logs (no presence of sapwood or juvenile wood). The specimens were cut to their final nominal dimensions of 20×20×360 mm3 (R, T, L axis) and kept in a conditioning
chamber at 20±1°C and 65±3% relative humidity for 2 weeks until their moisture content was stabilized (beginning from green point).
Experimental protocol
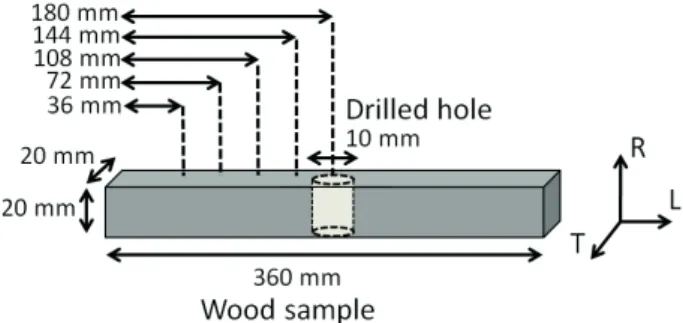
The specimens were selected based on a criterion in accordance with the correlation coefficient of the Timoshenko theory (BRANCHERIAU; BAILLERES, 2002; ROOHNIA et al., 2010). The relative differences between dynamic moduli in radial and tangential flexural vibration (ROOHNIA et al., 2011) were also used to accept the most homogeneous specimens. The best 35 specimens were kept and randomly divided into five groups. The 7 specimens of the first group were then drilled in the radial direction at a distance of 1/10 of the beam length (Figure 1). The next groups were drilled at a position of 2/10, 3/10, 4/10 and 5/10 respectively. Dynamic tests in free flexural vibration were performed on the specimens before and after drilling both in the LR and LT bending plan (ROOHNIA et al., 2010).
Dynamic test
FIGURE 1
FIGURA 1
at 2/9 and 7/9 of the beam length in free vibration. The bending vibration was produced by an impact with a steel pendulum (mass 57 g and diameter 24 mm) at one end of the specimen. The drop height of the steel ball was set in order to ensure a slight impact: the specimen
was always in contact with the supports. The radiated
sound was recorded at the other end of the beam by a unidirectional microphone. An external sound card was used with a sampling rate of 44100 Hz and a dynamic range of 16 bits. The frequency resolution was 2.7 Hz (first frequency close to 700 Hz with an associated measurement error of 0.4%). The rigid body frequency was less than 50 Hz which ensured a free flexural vibration condition (rigid body frequency lower than 1/10th of the first flexural frequency). The first four frequencies were obtained using a fast Fourier transform.
to the positions of the artificial defect located at 1/10, 2/10, 3/10, 4/10 and 5/10 of the beam length. In each graph, the bar values were equal to the average of the 7 specimen tests. The error bars were the associated standard deviations. For all graphs the ratio of frequency with LT was systematically higher than the one associated with LR (except for Figure 3-E, rank 2 and 4).
For a drilling located at 1/10 of the beam length, the behavior was similar between LR and LT with a downward trend in the frequency ratio according to the rank (Figure 3-A). However a significant difference existed between LR and LT for the rank 4 (f/fi = 0.96 with LR and f/fi = 0.98 with LT). The difference between frequencies (f and fi) was minimum for the first rank (f/fi = 1.00) and maximum for the rank 4 with LR (f/fi = 0.96). At the 2/10th location (Figure 3-B), the difference in behavior between LR and LT was significant for the ranks 2 and 3 with a maximum difference for rank 3 (f/fi = 0.96 with LR and f/fi = 1.00 with LT). This difference between LR and LT was minimum for the first rank (f/fi = 0.98 with LR and f/fi = 0.99 with LT). The difference between frequencies (f and fi) was minimum for rank 3 with LT (f/fi = 1.00).
At the 3/10th location (Figure 3-C), the difference between LR and LT was significant for the ranks 1 and 2 with a maximum for the second rank (f/fi = 0.95 with LR and f/fi = 1.00 with LT). The difference between frequencies (f and fi) was minimum for the second rank with LT (f/fi = 1.00).
At the 4/10th location (Figure 3-D), the difference between LR and LT was significant for the first rank (f/fi = 0.93 with LR and f/fi = 1.00 with LT). This difference was minimum for rank 3 (f/fi = 0.98 with LR and f/fi = 0.97 with LT). The difference between frequencies (f and fi) was minimum for the rank 4 with LT (f/fi = 1.00).
Concerning the last graph (5/10th, Figure 3-E), the difference between LR and LT was significant for the first rank (f/fi = 0.94 with LR and f/fi = 1.00 with LT). This difference was minimum for the rank 2 (f/fi = 0.99 with LR and f/fi = 0.97 with LT). The difference between frequencies (f and fi) was minimum for rank 3 with LT (f/fi = 1.00).
Discussion
The samples were placed on elastic supports positioned at the nodes of the first vibration mode. The free vibrational state was thus skewed by the presence of the supports. This bias was minimized in the analysis
Wood sample dimensions and drilling methodology. Dimensões da amostra de madeira e metodologia de perfuração.
Beam carrying a drilled hole under flexural vibration in LR (top) and LT (bottom) directions.
Viga com um furo sob vibração de flexão nas direções LR (acima) e LT (abaixo).
FIGURE 2
FIGURA 2
RESULTS AND DISCUSSIONS
Results
FREQUENCIES IN WOODEN BEAMS
Frequency ratio (after / before drilling) according to the mode number for dynamic tests in LR and LT directions. Positions of the artifi cial defect at 1/10, 2/10, 3/10, 4/10 and 5/10 of the beam length. Bar graph: average of 7 specimens. Error bars: standard deviation.
Relação das frequências (depois/antes da perfuração) em função do número do modo para os ensaios dinâmicos nas
direções LR e LT. Posições do defeito artifi cial à 1/10, 2/10, 3/10, 4/10 e 5/10 do comprimento da viga. Barra do gráfi co: média de 7 amostras. Barras de erro: desvio padrão.
A - 1/10th B - 2/10th
C - 3/10th D - 4/10th
E - 5/10th FIGURE 3
FIGURA 3
by the fact to compare the frequency ratio (f/fi ) before and after drilling.
In most cases (Figure 3), the frequency ratio with LT was greater than the LR ratio. The effect of the drilling was therefore lower with LT: The lowering of the vibration frequency was less important than with LR. This phenomenon was explained by the orientation of the drilling on the neutral axis in bending with the LT confi guration (axis along which the longitudinal stresses are nil).
The ratio (f/fi) decreased when the drilling position increased to reach a minimum at the position 5/10th for the first mode with the configuration LR. This phenomenon was explained by the presence of an antinode for the first mode (point of maximum amplitude, Figure 4). The gap between LR and LT reached a maximum at this position. The same reasoning was applicable to the modes 2 (antinode at 3/10th), 3 (antinodes close to 2/10th and 5/10th) and 4 (antinode close to 2/10th and 4/10th). In the presence of an antinode of vibration, the ratio of frequency with
LT was close to the unity while the LR ratio reached
a minimum.
studied based on the position of the drilling and the orientation of the specimen (LR, LT). When the drilling axis lies in the bending plane (LR), the weakening of frequency was maximal at the location of the associated antinodes of vibration. At this point, there was no frequency offset when the drilling axis was orthogonal to the bending plane (LT). In this case, the orientation of the drilling axis lies on the neutral axis in bending. In addition when the drilling axis was orthogonal to the bending plane (LT), the weakening of frequency was maximal in the place of the associated vibration nodes. The behavior in free flexural vibration was thus different depending on the position and orientation of heterogeneity. This particular behavior might be used, for example, in lumber grading to better take into account the presence of defects in the estimation of the static modulus of elasticity and the modulus of rupture. It would be innovative to use the first four frequencies in the two flexural vibration planes (the inharmonicity factors could be computed in this particular case); then to build two statistical models based on these parameters to estimate the static modulus of elasticity and the modulus of rupture.
ACKNOWLEDGEMENTS
We respectfully appreciate the Islamic Azad University, Karaj Branch-Iran and Agricultural Research Centre for International Development, CIRAD, Montpellier-France for supporting this complementary research collaboration during the first author’s sabbatical stay.
REFERENCES
BODIG, J.; JAYNE, B. A. Mechanics of woods and woods
composites. Malabar: Krieger, 1993. 736 p.
BORDONNE, P. A. Module dynamique et frottement
intérieur dans le bois: mesures sur poutres flottantes
en vibrations naturelles. 1989. 154 p. Thesis (Ph.D. in Mechanics of wood) - Soutenue à Nancy, Lonaine, 1989.
BRANCHERIAU, L.; BAILLERES, H. Natural vibration analysis of clear wooden beams: a theoretical review.
Wood Science and Technology, zurich, v. 36, p.
347-365, 2002.
CAM, E.; LEI, M.; KOCAARSLAN, I.; TAPLAMACIOGLU, C. Defect detection in a cantilever beam from vibration
data. Journal of Engineering Sciences, Pamukkale, v. 10, n. 3, p. 327-331, 2004.
0 0.2 0.4 0.6 0.8 1
-1 -0.8 -0.6 -0.4 -0.2 0 0.2 0.4 0.6 0.8 1 Normalized length N or m al iz ed m ode a m p li tude
Mode shapes of a one dimensional beam in free flexural vibration (solid: rank 1, dash: rank 2, dot: rank 3, dash-dot: rank 4).
Modos de vibração de uma viga unidimensional em vibração de flexão livre (linha contínua: posição 1, linha tracejada: posição 2, linha pontilhada: posição 3, linha traço-pontilhada: posição 4).
FIGURE 4
FIGURA 4
There were places where the LT ratio was very
different from the unity: 5/10th for the rank 2; 1/10th, 3/10th and 4/10th for the rank 3; 1/10th, 3/10th and 5/10th for the rank 4. These places corresponded to the nodes of vibration (point of minimum amplitude, Figure 4). No physical explanation was drawn using the classical one-dimensional theory of flexural vibration of beams. This phenomenon was not observed with the LT ratio of the first mode perhaps because the supports were placed at
these points.
CONCLUSIONS
FREQUENCIES IN WOODEN BEAMS
DIVÓS, F.; DÁNIEL, I.; BEJÓ, L. Defect detection in timber by stress wave time and amplitude. NDT.net, Breisig,
v. 6, n. 3, 2001. Available from: <http://www.ndt.net/ article/v06n03/divos/divos.htm>. Access in: 20 Mar. 2015.
HARRIS, C. M.; PIERSOL, A. G. Harris’ shock and vibration
handbook. New York: McGraw-Hill, 2002. 1451 p.
HEARMON, R. F. S. Vibration testing of wood. Forest
Products Journal, Peachtree Corners, v. 16, n. 8, p.
29-40, 1966.
INTERNATIONAL ORGANIzATION FOR
STANDARDIzATION. ISO 3129: wood: sampling methods and general requirements for physical and mechanical tests. Geneva, 1975.
ROOHNIA, M.; ALAVI-TABAR, S. E.; HOSSEIN, M. A.; BRANCHERIAU, L.; TAJDINI, A. Dynamic modulus of elasticity of drilled wooden beams. Nondestructive Testing and Evaluation, Portland, v. 26, n. 2, p. 141-153, 2011.
ROOHNIA, M.; YAVARI, A.; TAJDINI, A. Elastic parameters of poplar wood with end-cracks. Annals of Forest Science,
Nancy, v. 67, n. 4, p. 409-414, 2010.
SOBUE, N.; FUJITA, M.; NAKANO, A.; SUzUKI, T. Identification of defect position in a wooden beam from the power spectrum of longitudinal vibration. Journal of
Wood Science, Tokyo, v. 56, p. 112-117, 2010.