Endurance training blocks uncoupling protein 1 up-regulation
in brown adipose tissue while increasing uncoupling protein 3
in the muscle tissue of rats fed with a high-sugar diet
Karina Barbosa de Queiroz
a, Gisele Vieira Rodovalho
b, Juliana Bohnen Guimarães
b,
Daniel Carvalho de Lima
b, Cândido Celso Coimbra
b, Elísio Alberto Evangelista
a,
Renata Guerra-Sá
a,⁎
aDepartmento de Ciências Biológicas
–NUPEB, Laboratório de Bioquímica e Biologia Molecular, ICEB–Universidade Federal de Ouro Preto,
Ouro Preto, MG, Brazil
bDepartmento de Fisiologia e Biofísica, Universidade Federal de Minas Gerais, Belo Horizonte, MG, Brazil
A R T I C L E I N F O A B S T R A C T
Article history:
Received 29 January 2012 Revised 16 June 2012 Accepted 29 June 2012
The mitochondrial uncoupling proteins (UCPs) of interscapular brown adipose tissue (iBAT) and of muscles play important roles in energy balance. For instance, the expression of UCP1 and UCP3 are modulated by free fatty acid gradients induced by high-sugar diets and acute exercise that is dependent on sympathetic stimulation. However, the effects of endurance training in animals fed with high-sugar diets are unknown. This study aims to evaluate the long-term effects of diet and exercise on UCP1 and UCP3 levels and energy balance efficiency. Rats fed with standard or high-sugar (HSD) diets were simultaneously subjected to running training over an 8-week period. After the training period, the rats were decapitated, and the iBAT and gastrocnemius muscle tissues were removed for evaluation of theβ3-receptor,Ucp1, andUcp3mRNA and protein expression, which were analyzed by
quantitative reverse transcriptase polymerase chain reaction and Western blot, respectively. Groups fed with an HSD displayed a higher adiposity index and iBAT weight (P< .05), whereas exhibited an up-regulation ofUcp1mRNA and protein levels (P< .05). Training increased β3-receptor mRNA in iBAT and reduced the Ucp3 mRNA in muscle
tissues. In association with an HSD, training restored the increasingβ3-receptor mRNA and
greatly up-regulated the levels ofUcp3mRNA. Therefore, training blocked the HSD-induced up-regulation of UCP1 expression in iBAT, whereas it up-regulated the expression ofUcp3
mRNA in muscle. These results suggest that training enhances the relationship between
Ucp1/Ucp3mRNA levels, which could result in higher energy efficiency, but not when HSD-induced elevated sympathetic activity is maintained.
© 2012 Published by Elsevier Inc.
Keywords:
UCP1 UCP3
High sugar diet Running exercise Energy efficiency Rat
Abbreviations:HSD, high-sugar diet; iBAT, interscapular brown adipose tissue; RGD, rat genome database; S-HSD, sedentary– high-sugar diet; S-STD, sedentary–standard diet; qRT-PCR, quantitative reverse transcription-polymerase chain reaction; T-HSD, trained– high-sugar diet; T-STD, trained–standard diet; UCP1, uncoupling protein 1; UCP3, uncoupling protein 3.
⁎Corresponding author.Present Address: Institute of Exact and Biological Sciences–UFOP, Department of Biological Science–ICEB2, Room 045, Morro do Cruzeiro Campus, 35400–000, Ouro Preto–MG, Brasil. Fax: +55 31 35591680.
E-mail address:[email protected](R. Guerra-Sá).
0271-5317/$–see front matter © 2012 Published by Elsevier Inc.
http://dx.doi.org/10.1016/j.nutres.2012.06.020
A v a i l a b l e o n l i n e a tw w w . s c i e n c e d i r e c t . c o m
1.
Introduction
The sympathetic nervous system stimulates brown adipose tissue (BAT) via noradrenergic nerve endings, inducing non-shivering thermogenesis[1]. Noradrenaline binds toβ3,α1, and
α2-adrenergic receptors, triggering downstream signaling
events that impinge on lipolysis, thermogenesis, apoptosis, and gene expression[2]. In this way, the activation of theβ3
receptor in BAT initiates a cascade of metabolic events that culminate in the activation of UCP1, an uncoupling protein (UCP) that is found in the mitochondria and that is responsible for the translocation of protons through the respiratory chain and consequently for heat production[1]. In addition, prolonged
β-adrenergic stimulation of BAT results in sustained thermo-genic activity by increasing UCP1 expression and mitochondrial number, as well as by causing hyperplasia of BAT[1,3,4].
The thermogenic activity of the interscapular brown adipose tissue (iBAT) modulates energy expenditure in mammals, thereby contributing to the maintenance of energy balance[5,6]. Obesity, cold exposure and metabolic hormones, such as leptin and thyroid hormones, can induce the expression of UCP1, resulting in the hyperplasia of BAT and non-shivering thermogenesis[3,5,6]. These observations sug-gest an important role for UCP1 in energy balance during situations of altered metabolism[6–8].
Ingestion of nutrients increases energy expenditure above basal metabolic rates[9]. Indeed, diet-induced thermogenesis stimulates the activation of BAT, which increases its tissue mass[10,11], in an apparent physiological effort to restrain weight gain and obesity [6]. Highly palatable diets, as well diets with high levels of sugar, are used as a method to increase BAT and consequent UCP1 expression[2], as high-sugar diets have previously been shown to increase the metabolic and hyperplastic rates of BAT, as well as plasma levels of triacylglycerol and free fatty acids[12].
At the end of the last decade, UCP3, a homolog of UCP1, was discovered and found to be related to the regulation of energy expenditure in skeletal muscle. As UCP3 expression appears to be regulated by the same mechanisms as other mitochondrial constituents, energy intake and fatty acids metabolism also appear to contribute to its increased expression[13]. Further-more, because energy expenditure, as well energy intake, has an important impact on the overall energy balance, it is conceivable that UCP3 plays a role in regulating metabolic rate and weight control. Studies that have reported reduced weight gain and resting metabolic rates have also found simulta-neous decreases in UCP3 mRNA expression and protein levels in muscle[14,15].
Ucp3 mRNA expression is transiently up-regulated after acute exercise, an effect that is largely attributable to increased free fatty acids levels after exercise[16]. The increased levels of free fatty acids are proposed to activate an AMP-dependent protein kinase that regulates UCP3 expression during acute exercise[17]. After acute exercise, free fatty acids are released from adipose tissue, which can account for the relatively transient increase in UCP3 expression.
However, during physical training, UCP3 is rapidly down-regulated. Studies have suggested that this down-regulation is related with energy efficiency. The reduction of UCP3
associ-ated with training might be responsible for enhanced energy efficiency, as concomitant negative effects on mechanical efficiency and oxygen consumption have been observed[18]. Taking these data into account, we hypothesize that a high-sugar diet will increase UCP1 and UCP3 mRNA levels due to elevated sympathetic activation and increased serum levels of free fatty acids, which might contribute to altered energy efficiency. In addition, physical training might restore the effects induced by a high-sugar diet upon induction of increased serum levels of free fatty acids. Our understanding of the combinatorial effects of diet and exercise in long-term energy balance remains limited and warrants further inves-tigation. Thus, we sought to analyze the influence of physical training associated with a high-sugar diet on the expression of UCP1 and UCP3.
2.0.
Methods and materials
2.1. Animals
All of the experimental procedures were approved by the Ethics Committee of the Federal University of Minas Gerais for the Care and Use of Laboratory Animals (protocol 192/08) and were conducted in accordance with the regulations described in the Committee's Guiding Principles Manual.
Four-week old weaned male Wistar rats were housed in individual cages under controlled light (0500–1900 hours) and temperature (24.0 ± 2.0°C) conditions with water and rat chow provided ad libitum. Before the beginning of any experimental procedures, the animals were randomly divided into the following four groups: (1) sedentary rats fed with a standard chow diet (S-STD, sedentary–standard diet; n = 6), (2) trained rats fed with a standard chow diet (T-STD, trained–standard diet; n = 6), (3) sedentary rats fed with a high-sugar diet (S-HSD, sedentary–high-sugar diet; n = 6), and (4) trained rats fed with a high-sugar diet (T-HSD, trained–high-sugar diet; n = 6).
2.2. Diet
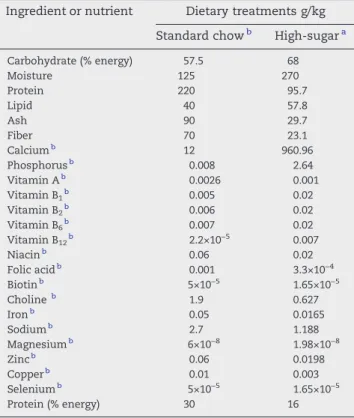
The animals were fed during an 8-week period with a high-sugar diet (S-HSD and T-HSD groups), consisting of 33% standard chow (Nuvilab CR1; Nuvital, Brazil), 33% condensed milk and 7% sucrose by weight (the remainder is water). The control groups were fed only STD. The ingredient and nutrient composition of the diets is shown inTable 1
The body weight and energy intake were measured once a week during the observation period. At the termination of the study, the energy intake was computed by multiplying the weekly food intake by the energy density of the STD (12.22 kJ) and the HSD (13.31 kJ) groups.
2.3. Exercise training
All of the animals were first conditioned to exercise on a motor-driven treadmill (Gaustec, Contagem, Brazil) by running at a speed of 10 m min−1at 5% inclination for 5 minutes per day for
the 5 consecutive days before exercise training.
inclination) at increments of 1 m min−1every 3 minutes until
fatigue[19]to determine the maximal performance prior to exercise training. Fatigue was defined as the point at which the animals were no longer able to maintain pace with the treadmill for at least 10 s [20]. During the first test, the performance evaluated by exercise time to fatigue did not differ among experimental groups. This test was repeated at the end of the eighth week of training to assess improvement in running performance. Exercise time to fatigue and work-load were considered indices of performance. Workwork-load (W) was calculated as W = [body weight (kg)] × [time to fatigue] × [treadmill speed (m min−1)] × [sinθ(treadmill inclination)][21].
After the first incremental workload, the rats were subjected to the exercise training protocol, which consisted of daily running sessions with gradual increases of intensity. The protocol started at 10 m min−1during a 30-minute period
and was increased until the rats were able to run at 25 m min−1
(5% inclination) for 60 m min−1. The protocol was adapted
from a previous study [22], and the achievement of this exercise intensity and duration ensured that significant endurance training adaptation had been produced. Exercise training was conducted over an 8-week period, a time frame in which stabilization of food intake and reduced UCP3 expres-sion in muscle has been previously reported[23,24]. To ensure that all of the animals were subjected to consistent handling procedures, the S-STD and S-HSD groups were subjected to running exercises for 2 minutes following the same physical training schedule. All running procedures were performed
between 8 and 11AMat an ambient temperature of 23°C ± 1°C to reduce environmental interference on the physical perfor-mance of the animals[25,26].
2.4. Euthanasia
Twenty-four hours after completion of the physical training protocol, the animals were decapitated, and iBAT and gastrocnemius muscles were dissected, weighed, frozen in liquid nitrogen, and stored at−80°C until further analysis. The
adiposity index was used to evaluate the development of obesity induced by HSD and was calculated as 100 × (sum of fat pad weights)/(body weight) [27]. To calculate the fat pad weights, epididymal, retroperitoneal, inguinal white adipose tissues were used.
2.5. Enzyme assay
The citrate synthase activity in soleus muscle tissues was measured as biomarker of oxidative metabolism using the Citrate Synthase Assay kit (Sigma-Aldrich). Tissue samples were homogenized in a solution of 50 mM Tris–HCl, 1 mM EDTA, and 0.01 mM phenylmethylsulfonyl fluoride (PMSF) (pH 7.4). Homogenization was performed using a Polytron homogenizer on the highest speed setting for 30 s. Homo-genates were then centrifuged at 725×gfor 10 minutes at 4°C. The supernatant was decanted, and citrate synthase activity was assayed according to the manufacturer's protocol.
2.6. Total RNA preparation and expression analysis of
Ucp1,Ucp3, andβ3-receptor by quantitative reverse
transcriptase polymerase chain reaction (qRT-PCR )
Total RNA from iBAT and gastrocnemius muscle tissues were obtained using a combination of the Trizol reagent (Invitro-gen, São Paulo, Brazil) and chloroform (Sigma-Aldrich) for extraction and then purified using the SV total RNA Isolation System (Promega, Belo Horizonte, Brazil) according to the manufacturer's protocol. The RNA was quantified using a NanoVue, followed by electrophoresis and analysis on a 1.2% agarose formamide- Tris-Borate-EDTA gel. The RNA prepara-tion was treated with RNase-free DNase I in 3 different rounds of decreasing enzyme concentrations (RQ1 DNase; Promega). The extracted RNA was measured at a wavelength of 260 nm, where the 260/280 wavelength ratio was indicative of purity and the 260/230 wavelength ratio was indicative of contam-ination. Ratios above 1.8 were considered acceptable for the quantification of gene expression[28].
One microgram of total RNA was reverse-transcribed using random primers from the high-capacity reverse transcriptase PCR system (Applied Biosystems) according to the manufac-turer's protocol. The complementary DNAs (cDNAs) encoding for Ucp1, Ucp3,β3-receptor, and rRNA 18Swere obtained by PCR amplification using specific primers. The efficiency of DNAse I treatment was evaluated by PCR amplification of the cDNA reaction mix without the addition of the reverse transcriptase (Multi Scribe Reverse Transcriptase). Primers were designed using theGene RunnerSoftware and sequences deposited inRat Genome Database(RGD) as follows (upstream and downstream, respectively): Ucp1 [RGD: NM 012682]
Table 1–Ingredient and nutrient composition of diets fed
to rats for an 8-week period
Ingredient or nutrient Dietary treatments g/kg
Standard chowb High-sugara
Carbohydrate (% energy) 57.5 68
Moisture 125 270
Protein 220 95.7
Lipid 40 57.8
Ash 90 29.7
Fiber 70 23.1
Calciumb 12 960.96
Phosphorusb 0.008 2.64
Vitamin Ab 0.0026 0.001
Vitamin B1b 0.005 0.02
Vitamin B2b 0.006 0.02
Vitamin B6b 0.007 0.02
Vitamin B12b 2.2×10⁻⁵ 0.007
Niacinb 0.06 0.02
Folic acidb 0.001 3.3×10⁻⁴
Biotinb 5×10⁻⁵ 1.65×10⁻⁵
Cholineb 1.9 0.627
Ironb 0.05 0.0165
Sodiumb 2.7 1.188
Magnesiumb 6×10⁻⁸ 1.98×10⁻⁸
Zincb 0.06 0.0198
Copperb 0.01 0.003
Seleniumb 5×10⁻⁵ 1.65×10⁻⁵
Protein (% energy) 30 16
HS diet (g/kg): rat chow NUVILAB-CR (33%); sweetened condensed milk (33%); granulated sugar (7%) and water.
a Adapted by[12].
(forward 5′-CAAAGTCCGCCTCAGATC-3′, reverse 5′ -TGGTGATGGTCCCTAAGAC-3′);Ucp3[RGD: NM_013167.2] (for-ward 5′-CCCAAAGGAACGGACCACTC-3′, reverse 5′ -GGGTTGAGCACAGGTCACTG-3′) ; β3-receptor (Adrb3) [RGD: NM 013108] (forward 5′-TGGTGATGGTCCCTAAGAC-3′, reverse 5′-CACGCCGAGACTACAGAC-3′), and rRNA 18S [RGD: X01117.1] (forward 5′-GTAAGTGCGGGTCATAAG-3′, reverse 5′
CCATCCAATCGGTAGTAGC 3′), used as endogenous control. Reverse-transcribed cDNA samples were used as templates for PCR amplification using the SYBR GreenPCR Master Mix (Applied Biosystems) and Applied Biosystems ABI 7300. The efficiency for each pair of primers was evaluated according to the protocol developed by the Applied Biosystems application (cDNA dilutions were 1:10, 1:100 and 1:1000). For the investi-gated transcripts, 3 biological replicates were performed, and their gene expression was normalized against therRNA 18S
transcript according to the 2−ΔCtmethod[29]using the Applied
Biosystems ABI 7300 software. The relative expression (2−ΔΔCt
method) was measured using the S-STD group as the calibrator sample, where its expression was considered as the 1× control index for comparison with other genes.
2.7. Western blot analysis for UCP1
Determination of UCP1 protein was performed by Western blotting using a rabbit polyclonal antibody against UCP1 (AB1426, Millipore Corporation, Billerica, MA, USA). One hundred milligrams of iBAT was homogenized with a Polytron homogenizer in lysis buffer (50 mM Tris–HCl pH 6.8, 1 mM EDTA, 1% NP40, 150 mM NaCl, 2 mM DTT and 1 mM of the following proteases inhibitors: PMSF, Tosyllysine chloro-methylketone (TLCK), and Tosyl phenylalanyl chloromethyl ketone (TPCK)). After centrifugation at 725×gfor 30 minutes, the concentration of soluble proteins was determined with a QuantiPro BCA Assay Kit (Sigma-Aldrich). Fifty micrograms of protein was separated by sodium dodecyl sulfate-polyacryl-amide gel electrophoresis (SDS-PAGE, 12% polyacrylsulfate-polyacryl-amide gel) and electrotransferred to polyvinylidene difluoride membranes at 25 V for 2 h at 4°C. After 16 h of incubation in blocking solution, the membranes were washed and incubated with primary antibodies (1:500). The results were visualized by BCIP/NBT (5-bromo-4-chloro-3-indolyl-phosphate/nitro blue tetrazolium) color development substrate (Promega) using HRP-conjugated anti-rabbit IgG antibodies (Sigma Aldrich). To normalize the blots, we used the total protein levels obtained on 12% SDS-PAGE replicate gels [30]. Relative expression levels were obtained by densitometric analysis of bands using Quantity One (Bio-Rad) software.
2.8. Statistical analyses
Statistical analyses were performed using Graph Pad Prism version 5.0 software package (Irvine, CA, USA). The sample size had considered the minimum difference between means and standard deviation of the errors, with a power of 0.9 and significance level (α) of .05. We chose the highest estimated size to assess our outcomes (n = 6). Normalization of the data was verified using the Shapiro-Wilk test. The data are reported as the mean ± SD. Differences between groups were evaluated using 2-way analysis of variance (ANOVA)
followed by the Bonferroni test. P < .05 was considered statistically significant.
3.
Results
3.1. Effects of diet and endurance training on energy intake and body weight
Energy intake increased over time and stabilized starting from the sixth week across all groups. The alimentary patterns did not differ among groups, even those fed with an HSD (Fig. 1, top).
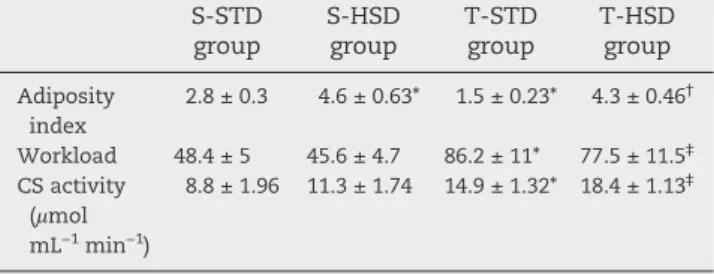
Consistently, body weight progressively increased during the 8 weeks for all 4 groups, without any differences among them (Fig. 1, bottom). However, the adiposity index was approximately 76% (Table 2; P < .05) higher in the S-HSD animals compared to S-STD animals. Endurance training reduced the adiposity index in animals fed with a standard
100
80
60
S-STD (n = 6) S-HSD (n = 6) T-STD (n = 6) T-HSD (n = 6)
40
20
0
400
350
300
250
200
150
100
50
1 2 3 4 5 6 7 8
Weeks
Ener
gy intake (Kcal/week)
Body weight (g)
diet but was insufficient to revert its increasing in T-HSD rats (Table 2).
3.2. Effects of diet and endurance training on performance and citrate synthase activity
The running workload was improved in trained rats (T-STD and T-HSD) compared to sedentary groups (S-STD and S-HSD). The running workload was measured during the incremental exercise tests until fatigue at the end of endurance training (Table 2;P< .05). Similarly, the exercise training increased the citrate synthase activity in the soleus muscle tissue of trained rats (P< .001), regardless of diet, compared to sedentary rats (Table 2).
3.3. Effects of diet and endurance training on iBAT:
β3-receptor and UCP1 expression
As shown inFig. 2A, an HSD directly influences iBAT weight (P< .001), inducing an increase of approximately 65% in the
Table 2–Adiposity index and exercise intensity in
sedentary and trained groups of rats
S-STD group
S-HSD group
T-STD group
T-HSD group
Adiposity index
2.8 ± 0.3 4.6 ± 0.63* 1.5 ± 0.23* 4.3 ± 0.46†
Workload 48.4 ± 5 45.6 ± 4.7 86.2 ± 11* 77.5 ± 11.5‡
CS activity (μmol mL−1min−1)
8.8 ± 1.96 11.3 ± 1.74 14.9 ± 1.32* 18.4 ± 1.13‡
The data are expressed as the means ± S.D. (n = 6). All comparisons were performed by 2-way ANOVA (Bonferroni test).P< .05 were considered statistically significant. *Statistical differences compared to S-STD group; †Statistical differences compared to
T-STD group;‡Statistical differences compared to S-HSD group.
CS, citrate synthase.
Fig. 2–Effect of a high-sugar diet and exercise training over an 8-week period on iBAT,β3-receptor mRNA levels, and UCP1 expression. (A) Relative iBAT weights. Data are expressed as means ± SD. (B)β3-receptor, (C) UCP1 mRNA levels, and (D) UCP1/ protein. The gene expression profiles were evaluated in the S-STD, S-HSD, T-STD, and T-HSD groups by the 2–ΔΔCqmethod. rRNA18S was used as reference gene and the S-STD group was used as a calibration sample, where its expression was considered at 1× control index for comparison (B) Western blot anti-UCP1. Fifty micrograms of crude extract was analyzed by 12% SDS-PAGE followed by immunoblotting analysis using an anti-UCBP1 antibody. Densitometry was performed using Quantity One Software (Bio-Rad). The effects of diet and/or training were performed by 2-way ANOVA (Bonferroni test) and
S-HSD group compared to the S-STD group. Although endurance training resulted in a decreased adiposity index (Table 2), it did not elicit any differences in iBAT of animals fed with a standard diet. However, exercise training did not reverse the increased iBAT weight when rats were fed with an HSD (Fig. 2A).
The relative expression ofUcp1mRNA in iBAT was directly affected by diet (P< .001), training (P< .01) and the interaction between both treatments (P< .001) (Fig. 2C). Compared to the S-STD group, the HSD and the exercise up regulated Ucp1
mRNA expression by approximately 12- and 5-fold in the S-HSD and T-STD groups, respectively. Conversely, compared to the S-HSD group, the transcription of Ucp1 was down-regulated by 7.2-fold in exercised rats of the T-HSD group.
We performed immunoblot analysis to verify whether the elevated levels of Ucp1mRNA were reflected at the protein level. As shown in Fig. 2D, the HSD increased UCP1 levels (~50%) and the combination of diet and exercise down regulated the protein levels, corroborating our observations ofUcp1transcription (Fig. 2C).
One mechanism involved in the regulation of UCP1 expression is the link between noradrenaline andβ3-receptors and the activation of their downstream pathways. Next, we analyzed theβ3-receptor mRNA levels in iBAT to assess their role in the processes induced by the experimental treat-ments, and we found that the transcription of the β 3-receptor in iBAT was directly affected by the combination of diet and exercise (P< .01). Theβ3-receptor mRNA levels were approximately 3.5-fold higher in the T-STD group compared to S-STD group, and the rats in the T-HSD group had transcript levels that were approximately 6-fold lower than those in the T-STD group (Fig. 2B).
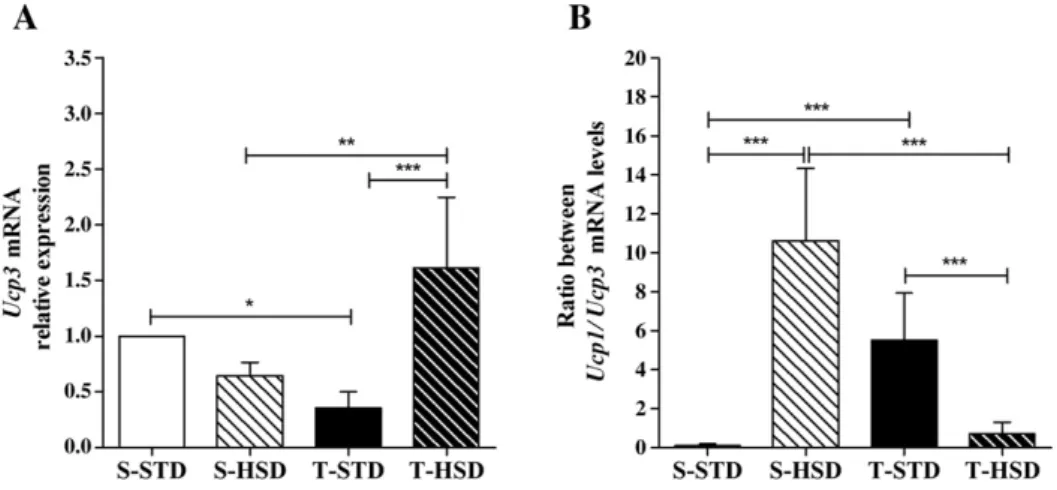
3.4. Effects of diet and endurance training on the Ucp3 mRNA levels in gastrocnemius muscle tissue
The tissue-specific expression pattern of each UCP is distinct, which might reflect separate thermoregulatory roles for the
UCPs. Therefore, we analyzed the Ucp3 mRNA expression levels in gastrocnemius muscle tissues in order to assess its contribution to thermogenesis in our model. Compared to the S-STD group, exercise training down-regulated the relative expression ofUcp3in gastrocnemius muscle tissues (Fig. 3A). Furthermore, the relative expression ofUcp3in the gastroc-nemius muscle tissues of the T-HSD group was up-regulated by approximately 4.5-fold compared to the T-STD group and 2.5-fold compared to the S-HSD group (Fig. 3A). The ratio betweenUcp1/Ucp3mRNAs is shown inFig. 3B and illustrates that exercise training contributed substantially to HSD-induced adaptations of energy expenditure.
4.
Discussion
The main finding of this study is that endurance training of rats fed with a standard diet improved energy efficiency, which was associated with increased ratios of Ucp1/Ucp3
mRNA. However, when the rats were fed with a high-sugar diet, the stimulus of training was insufficient to reduce the adiposity index and iBAT weight. In addition, the combination of training and HSD blocked the increase ofβ3-receptor and UCP1 expression in iBAT observed in the S-HSD rats and up-regulated the transcription ofUcp3in muscle.
Previous studies using the same HSD found a robust increase in energy intake [12]and, consequently, in weight gain[12,31–33], consistent with the obesity-inducing effects of the HSD. In all of these studies, the HSD was administered over long time frames and was observed to alter energy intake and body weight as early as 6 to 8 weeks. In addition, when an HSD was provide to weaning rats, the onset of alterations in weight gain were delayed, suggesting a perturbation in animal growth [12]. Although such responses of increased energy intake and body weight were not observed in our study, the administration of an HSD induced elevated adiposity indices and hyperplasia of iBAT, indicating that dietary stimulus was effective in inducing obesity and elevated sympathetic
activation. De Lima et al[12]had previously found enlarged white and brown adipose pads and an increased resting metabolic rate associated with serum triacylglycerol and free fatty acid levels. Notably, these factors influence the expres-sion of UCP1 and UCP3[30,34,35]. The iBAT levels of UCP1 have been previously shown to correlate positively with an increased noradrenaline response and negatively with meta-bolic efficiency[36], suggesting a response that attenuates the development of obesity.
In this study, we observed the up-regulation of UCP1 expression in response to an HSD, although the intensity of the effects differed at the mRNA and protein levels. The regulation of UCP1 levels has been proposed to involve the
β3-receptor/CREB (cAMP response element-binding protein), as well as further influence from UCP1 mRNA stability and from the delay caused by translation [36]. This temporal delay is a consequence of the relatively slow turnover of UCP1 protein in its native environment[37]and includes the synthesis of new mitochondria, and thus, a difference between mRNA and protein levels may occur without an observable physiological significance. This notion is consis-tent with our experimental system, as our rats were not fasted prior to euthanasia, which has been suggested to promote acute decreases inUcp1mRNA levels that are not reflected by changes at the protein level[36].
The HSD also induced the up-regulation of β3-receptor mRNA levels, and preliminary experiments have shown that an HSD increased total catecholamine levels in iBAT (unpub-lished observations). These findings suggest that an addition-al mechanism of adrenergic stimulation must be involved in UCP1 regulation[11,38]because elevatedβ3-receptor mRNA
levels might indicate reduced sympathetic activation[39]or might indicate receptor desensitization by increased levels of catecholamine. Therefore, another mechanism that might regulate UCP1 in response to an HSD in iBAT includes serum leptin[11,38].
Diet-induced enlarges in fat pads produce increasing levels of leptin, which signal to suppress food intake and to increase heat production by UCP1. Although energy intake remained constant in our study, previous studies have shown that plasma leptin concentrations increase proportionately with the expansion of adipose tissue[12]. Thus, we speculate that increased plasma leptin levels contribute to regulate energy efficiency as an inefficacious response to prevent weight gain. Consistent with this notion, rats fed with an HSD were previously found not to exhibit altered serum glucose concentrations but rather to exhibit hyperinsulinemia
[12,32], which also modulates UCP1 expression[40,41]. UCP3 expression has been reported to increase in obese rats[42,43]because of elevated circulating levels of fatty acids
[43]. Although an HSD augmented the adiposity index, free fatty acids were unchanged (unpublished observations). This result could explain the lack of variation inUcp3mRNA levels of muscle tissues. This result indicates that UCP3 levels in gastrocnemius muscle tissue play a physiological role in the mitochondrial processing of fatty acids, which is likely accompanied by regulation of energy efficiency. UCP3 levels have previously been shown to exhibit tissue-specific differ-ences in expression[42], suggesting that the response could be modified in other tissues, such as iBAT or heart.
Improving energy efficiency is one the adaptive responses already that has already been described during exercise training. The activity of mitochondrial enzymes is used to confirm oxidative adaptation induced by training in skeletal muscle[44]. The endurance training protocol used in this study increased citrate synthase activity and workload in trained rats. Thus, compared to untrained animals, the maximum energy consumption was elevated in trained animals, contributing to higher fatty acid metabolism with the same absolute power during physical activity. In addition, the analysis of the workload confirmed the effectiveness of the training protocol, owing to the increased maximal velocity and exercise time until fatigue exhibited during the incrementally increasing workload running test. These values indicate increased physical perfor-mance and endurance before fatigue[45–47].
Endurance training can reduce the adiposity index without altering body weight. Adipose pads might be replaced by lean muscle mass, accounting for the unchanged body weight. Furthermore, iBAT was not altered in the T-STD group. Notably, exercise can itself augment the metabolism and heat-generating process, which might result in a decreased requirement for iBAT recruitment and UCP1 levels [48]. Moreover, the effects of exercise are transient, and the exact time elapsed between the end of training period and the measurement of brown fat-related parameters might deter-mine whether an effect is observed[49]. Conversely, exercise training marginally increases serum fatty acid levels, which might restrain the atrophy of iBAT and reduction of UCP1. Consecutive sympathetic stimulations and the consequent elevation in serum fatty acid levels induced by the exercise sections of the training protocol might induce iBAT hypertro-phy and up-regulation of the UCP1 and UCP3 levels. The lack of an effect on iBAT weight coupled with the up-regulation of theβ3-receptor suggest that exercise does not lead to chronic sympathetic stimulation in this tissue or regulation of the iBAT lipolysis and thermogenesis[35,39,50]. In addition, UCP1 was up-regulated, contributing to triglyceride turnover in-duced by endurance training. However, the increase in UCP1 activity is also associated with sympathetic tonus, and this uncoupling activity affects the efficiency of energy use. A decrease in metabolic efficiency, which increases the meta-bolic rate, might result in a decreased propensity to gain weight. Therefore, alterations in the UCP activities might have important effects on energy balance[51].
Previous studies have found that aside from UCP1, UCP3 levels are associated with changes in the adiposity index[52]
and significantly contribute to thermogenesis and adapta-tions of energy expenditure. In this regard, endurance training resulted in significantly reduced UCP3 expression levels, which were negatively correlated with aerobic capacity[53]. This finding was corroborated by the denervation of the gastrocnemius muscles, which was associated with increased
pads and lean mass, we speculate that after exercise training, energy efficiency is increased and is better correlated with the ratio ofUcp1/Ucp3mRNA, as a functional representation of the replacement of the type of body tissues and changes in metabolism.
When the rats were administered an HSD, endurance training was insufficient to reverse the increase in the adiposity index or iBAT weight. However, the increased expression ofβ3-receptor and UCP1 was blunted in the T-HSD group. These data suggest that there is a subsequent modulation of iBAT weight because the tissue mass was still higher. Intriguingly, the UCP1 levels were not maintained or increased in parallel with the increased iBAT weight and presumably increased sympathetic activity, suggesting that the increased metabolic efficiency in trained rats is associated predominantly with decreases in UCP1 expression rather than with morphological alterations.
Considering the coregulatory effects between UCP homo-logues, such as the up-regulation of UCP3 in skeletal muscle and the concomitant down-regulation of UCP1 in iBAT[43,57], our results suggest that combined with exercise, an HSD increases the levels of Ucp3 in muscle by facilitating the uptake and metabolism of lipids as fuel substrates from circulating free fatty acids [43,58], resulting in a down-regulation of UCP1 in iBAT, possibly by mechanisms that suppress iBAT thermogenesis and that accelerate fat deposi-tion. Nonetheless, further experiments are warranted to evaluate the molecular mechanism underlying this process.
Whether sympathetic stimulation by an HSD is attributed to the endurance training, and the resulting impaired modu-lation of energy efficiency, remains unclear. Nonetheless, this possibility could be illustrated by the block of the increase in the ratio ofUcp1/Ucp3mRNA observed in the T-HSD rats.
Taken together, our findings suggest that training in-creases the ratio betweenUcp1/Ucp3 expression, which can mediate the induction of higher energy efficiency, but not when the HSD-induced elevated sympathetic activity is maintained. The relationship between Ucp1 and Ucp3
mRNAs might be responsible for the maintenance of body balance, allowing for changes in body composition, without change in body weight.
Acknowledgment
This work was supported by the Conselho Nacional de Desenvolvimento Científico e Tecnológico, the Coordenadoria de Aperfeiçoamento de Pessoal de Nível Superior, and the Fundação de Amparo à Pesquisa do Estado de Minas Gerais. We also would like to acknowledge the technical assistance of Janine Costa Ivo. The authors declare that they have no conflicts of interest.
R E F E R E N C E S
[1] Festuccia WT, Blanchard PG, Richard D, Deshaies Y. Basal adrenergic tone is required for maximal stimulation of rat brown adipose tissue UCP1 expression by chronic
PPAR-gamma activation. Am J Physiol Regul Integr Comp Physiol 2010;299:R159–67.
[2] Cannon B, Nedergaard J. Brown adipose tissue: function and physiological significance. Physiol Rev 2004;84:277–359. [3] Sell H, Deshaies Y, Richard D. The brown adipocyte: update
on its metabolic role. Int J Biochem Cell Biol 2004;36:2098–104. [4] Chernogubova E, Hutchinson DS, Nedergaard J, Bengtsson T. Alpha1- and beta1-adrenoceptor signaling fully compensates for beta3-adrenoceptor deficiency in brown adipocyte nor-epinephrine-stimulated glucose uptake. Endocrinology 2005;146:2271–84.
[5] Seydoux J, Girardier L. Control of brown fat thermogenesis by the sympathetic nervous system. Experientia Suppl 1978;32:153–67. [6] Rothwell NJ, Stock MJ. A role for brown adipose tissue in
diet-induced thermogenesis. Nature 1979;281:31–5.
[7] Hutchinson DS, Chernogubova E, Dallner OS, Cannon B, Bengtsson T. Beta-adrenoceptors, but not alpha-adrenocep-tors, stimulate AMP-activated protein kinase in brown adipocytes independently of uncoupling protein-1. Diabeto-logia 2005;48:2386–95.
[8] Seale P, Kajimura S, Spiegelman BM. Transcriptional control of brown adipocyte development and physiological function–
of mice and men. Genes Dev 2009;23:788–97.
[9] Tappy L, Jequier E. Fructose and dietary thermogenesis. Am J Clin Nutr 1993;58:766S–70S.
[10] Moriya M. Nutritional adaptation in brown adipose tissue thermogenesis–with special reference to overfeeding and iron deficiency. Hokkaido Igaku Zasshi 1994;69:1115–31. [11] Margareto J, Marti A, Martinez JA. Changes in UCP mRNA
expression levels in brown adipose tissue and skeletal muscle after feeding a high-energy diet and relationships with leptin, glucose and PPARgamma. J Nutr Biochem 2001;12:130–7. [12] de Lima DC, Silveira SA, Haibara AS, Coimbra CC. The
enhanced hyperglycemic response to hemorrhage hypoten-sion in obese rats is related to an impaired baroreflex. Metab Brain Dis 2008;23:361–73.
[13] Khalfallah Y, Fages S, Laville M, Langin D, Vidal H. Regulation of uncoupling protein-2 and uncoupling protein-3 mRNA expression during lipid infusion in human skeletal muscle and subcutaneous adipose tissue. Diabetes 2000;49:25–31. [14] Schrauwen P, Hesselink M. UCP2 and UCP3 in muscle
controlling body metabolism. J Exp Biol 2002;205:2275–85. [15] Vidal-Puig A, Rosenbaum M, Considine RC, Leibel RL, Dohm GL,
Lowell BB. Effects of obesity and stable weight reduction on UCP2 and UCP3 gene expression in humans. Obes Res 1999;7:133–40. [16] Schrauwen P, van Aggel-Leijssen DP, Hul G, Wagenmakers AJ, Vidal H, Saris WH, van Baak MA. The effect of a 3-month low-intensity endurance training program on fat oxidation and acetyl-CoA carboxylase-2 expression. Diabetes 2002;51:2220–6. [17] Ruderman NB, Saha AK, Vavvas D, Witters LA. Malonyl-CoA,
fuel sensing, and insulin resistance. Am J Physiol 1999;276:E1–18. [18] Schrauwen P, Troost FJ, Xia J, Ravussin E, Saris WH. Skeletal
muscle UCP2 and UCP3 expression in trained and untrained male subjects. Int J Obes Relat Metab Disord 1999;23:966–72. [19] Leite LH, Lacerda AC, Balthazar CH, Marubayashi U, Coimbra
CC. Central angiotensin AT1 receptors are involved in metabolic adjustments in response to graded exercise in rats. Peptides 2009;30:1931–5.
[20] Wanner SP, Guimaraes JB, Pires W, Marubayashi U, Lima NR, Coimbra CC. Muscarinic receptors within the ventromedial hypothalamic nuclei modulate metabolic rate during physi-cal exercise. Neurosci Lett 2011;488:210–4.
[21] Brooks GA, White TP. Determination of metabolic and heart rate responses of rats to treadmill exercise. J Appl Physiol 1978;45:1009–15.
[23] Lima NR, Coimbra CC, Marubayashi U. Effect of
intracerebroventricular injection of atropine on metabolic responses during exercise in untrained rats. Physiol Behav 1998;64:69–74.
[24] Boss O, Samec S, Kuhne F, Bijlenga P, Assimacopoulos-Jeannet F, Seydoux J, Giacobino JP, Muzzin P. Uncoupling protein-3 expression in rodent skeletal muscle is modulated by food intake but not by changes in environmental temperature. J Biol Chem 1998;273:5–8.
[25] Rodrigues LOC, Oliveira A, Lima NRV, Machado-Moreira CA. Heat storage rate and acute fatigue in rats. Braz J Med Biol Res 2003;36:131–5.
[26] Guimaraes JB, Wanner SP, Machado SC, Lima MR, Cordeiro LM, Pires W, La Guardia RB, Silami-Garcia E, Rodrigues LO, Lima NR. Fatigue is mediated by cholinoceptors within the ventromedial hypothalamus independent of changes in core temperature. Scand J Med Sci Sports 2011.
[27] Taylor BA, Phillips SJ. Detection of obesity QTLs on mouse chromosomes 1 and 7 by selective DNA pooling. Genomics 1996;34:389–98.
[28] Becker C, Hammerle-Fickinger A, Riedmaier I, Pfaffl MW. mRNA and microRNA quality control for RT-qPCR analysis. Methods 2010;50:237–43.
[29] Livak KJ, Schmittgen TD. Analysis of relative gene expression data using real-time quantitative PCR and the 2(−Delta Delta
C(T)) Method. Methods 2001;25:402–8.
[30] Aldridge GM, Podrebarac DM, Greenough WT, Weiler IJ. The use of total protein stains as loading controls: an alternative to high-abundance single-protein controls in semi-quantitative immunoblotting. J Neurosci Methods 2008;172:250–4.
[31] Wilding JP, Gilbey SG, Mannan M, Aslam N, Ghatei MA, Bloom SR. Increased neuropeptide Y content in individual
hypothalamic nuclei, but not neuropeptide Y mRNA, in diet-induced obesity in rats. J Endocrinol 1992;132:299–304. [32] Widdowson PS, Upton R, Buckingham R, Arch J, Williams G.
Inhibition of food response to intracerebroventricular injection of leptin is attenuated in rats with diet-induced obesity. Diabetes 1997;46:1782–5.
[33] Park S, Harrold JA, Widdowson PS, Williams G. Increased binding at 5-HT(1A), 5-HT(1B), and 5-HT(2A) receptors and 5-HT transporters in diet-induced obese rats. Brain Res 1999;847:90–7.
[34] Schrauwen P, Hoeks J, Hesselink MK. Putative function and physiological relevance of the mitochondrial uncoupling protein-3: involvement in fatty acid metabolism? Prog Lipid Res 2006;45:17–41.
[35] Boss O, Samec S, Desplanches D, Mayet MH, Seydoux J, Muzzin P, Giacobino JP. Effect of endurance training on mRNA expression of uncoupling proteins 1, 2, and 3 in the rat. FASEB J 1998;12:335–9.
[36] Nedergaard JGV, Matthias A, Asadi A, Jacobsson A, Cannon B. UCP1: the only protein able to mediate adaptive
non-shivering thermogenesis and metabolic inefficiency. Biochim Biophys Acta 2001;1504:82–106.
[37] Jacobsson AMM, Cannon B, Nedergaard J. The uncoupling protein thermogenin during acclimation: indications for pretranslational control. Am J Physiol Regul Integr Comp Physiol 1994;267:125.
[38] Scarpace PJ, Matheny M, Moore RL, Kumar MV. Modulation of uncoupling protein 2 and uncoupling protein 3: regulation by denervation, leptin and retinoic acid treatment. J Endocrinol 2000;164:331–7.
[39] Collins S, Daniel KW, Rohlfs EM. Depressed expression of adipocyte beta-adrenergic receptors is a common feature of congenital and diet-induced obesity in rodents. Int J Obes Relat Metab Disord 1999;23:669–77.
[40] Muraoka M, Fukushima A, Viengchareun S, Lombes M, Kishi F, Miyauchi A, Kanematsu M, Doi J, Kajimura J, Nakai R, Uebi T, Okamoto M, Takemori H. Involvement of SIK2/TORC2
signaling cascade in the regulation of insulin-induced PGC-1alpha and UCP-1 gene expression in brown adipocytes. Am J Physiol Endocrinol Metab 2009;296:E1430–9.
[41] Hernandez A, de Mena RM, Martin E, Obregon MJ. Differences in the response of UCP1 mRNA to hormonal stimulation between rat and mouse primary cultures of brown adipocytes. Cell Physiol Biochem 2011;28:969–80. [42] Peterson JM, Bryner RW, Frisbee JC, Alway SE. Effects of
exercise and obesity on UCP3 content in rat hindlimb muscles. Med Sci Sports Exerc 2008;40:1616–22.
[43] Samec S, Seydoux J, Dulloo AG. Role of UCP homologues in skeletal muscles and brown adipose tissue: mediators of thermogenesis or regulators of lipids as fuel substrate? FASEB J 1998;12:715–24.
[44] Siu PM, Donley DA, Bryner RW, Alway SE. Citrate synthase expression and enzyme activity after endurance training in cardiac and skeletal muscles. J Appl Physiol 2003;94:555–60. [45] Booth FW, Thomason DB. Molecular and cellular adaptation
of muscle in response to exercise: perspectives of various models. Physiol Rev 1991;71:541–85.
[46] Sen CK. Oxidants and antioxidants in exercise. J Appl Physiol 1995;79:675–86.
[47] Smolka MB, Zoppi CC, Alves AA, Silveira LR, Marangoni S, Pereira-Da-Silva L, Novello JC, Macedo DV. HSP72 as a complementary protection against oxidative stress induced by exercise in the soleus muscle of rats. Am J Physiol Regul Integr Comp Physiol 2000;279:R1539–45.
[48] Segawa MO-IS, Kizaki T, Ookawara T, Sakurai T, Izawa T, Nagasawa J, Kawada T, Fushiki T, Ohno H. Effect of running training on brown adipose tissue activity in rats: a reevaluation. Res Commun Mol Pathol Pharmacol 1998;100:77–82.
[49] Scarpace PJYS, Tumer N. Influence of exercise training and age on uncoupling protein mRNA expression in brown adipose tissue. Pharmacol Biochem Behav 1994;49:1057–9. [50] Yoshitomi H, Yamazaki K, Abe S, Tanaka I. Differential
regulation of mouse uncoupling proteins among brown adipose tissue, white adipose tissue, and skeletal muscle in chronic beta 3 adrenergic receptor agonist treatment. Biochem Biophys Res Commun 1998;253:85–91.
[51] Ravussin E. Metabolic differences and the development of obesity. Metabolism 1995;44:12–4.
[52] Lanouette CM, Giacobino JP, Perusse L, Lacaille M, Yvon C, Chagnon M, Kuhne F, Bouchard C, Muzzin P, Chagnon YC. Association between uncoupling protein 3 gene and obesity-related phenotypes in the Quebec Family Study. Mol Med 2001;7:433–41.
[53] Russell A, Wadley G, Snow R, Giacobino JP, Muzzin P, Garnham A, Cameron-Smith D. Slow component of [V]O(2) kinetics: the effect of training status, fibre type, UCP3 mRNA and citrate synthase activity. Int J Obes Relat Metab Disord 2002;26:157–64.
[54] Cortright RN, Zheng D, Jones JP, Fluckey JD, DiCarlo SE, Grujic D, Lowell BB, Dohm GL. Regulation of skeletal muscle UCP-2 and UCP-3 gene expression by exercise and denervation. Am J Physiol 1999;276:E217–21.
[55] Hjeltnes N, Fernstrom M, Zierath JR, Krook A. Regulation of UCP2 and UCP3 by muscle disuse and physical activity in tetraplegic subjects. Diabetologia 1999;42:826–30. [56] Schrauwen P, Russell AP, Moonen-Kornips E, Boon N,
Hesselink MK. Effect of 2 weeks of endurance training on uncoupling protein 3 content in untrained human subjects. Acta Physiol Scand 2005;183:273–80.
[57] Sonia Samec JS, Dulloo AG. Interorgan signaling between adipose tissue metabolism and skeletal muscle uncoupling protein homologs is there a role for circulating free fatty acids? Diabetes 1998;47:1693–8.