Vocal acoustic and auditory-perceptual measures, vocal
complaints and professional characteristics of teachers
from the city of Santa Maria (Rio Grande do Sul), Brazil
Medidas vocais perceptivo-auditivas e acústicas, queixas vocais
e características profissionais de professoras de Santa Maria (RS)
Vanessa Veis Ribeiro1, Carla Aparecida Cielo1
ABSTRACT
Purpose: Describe and correlate acoustic and auditory-perceptual vocal measures, vocal complaints and professional characteristics of a group of teachers. Methods: Ninety-nine female primary school teachers, aged 20 to 66 years, underwent auditory-perceptual (CAPE-V) and acoustic (Multi-Dimensional Voice Program Advanced) vocal assessments, and answered a questionnaire with questions about personal identification, overall health, occupational activities and vocal complaints. The ANOVA and Pearson’s correlation statistical tests have been applied. Results: The teachers worked 6.98 hours a day, on average, and had been working as teachers for 12.91 years, approximately. Most of them reported vocal complaints and were employed in private schools. Auditory perceptual parameters were normal. All measures of jitter, shimmer, voiceless or unvoiced and subharmonic segments were above the normal range, as well as the standard deviation for fundamental frequency and soft phonation index. Perturbation frequency and age, roughness, breathiness and overall degree of voice were positively correlated with age and length of profes-sional practice. There was also a negative correlation between amplitude perturbation and daily use of voice. Conclusion: The teachers’ voices were considered as normal by the auditory-perceptual assessment, but noise and instability were detected in the acoustic analysis; there were, particularly, vocal complaints, and alteration of vocal acoustic and auditory-perceptual measures with increasing age and length of professional practice.
Keywords: Voice disorders; Faculty; Voice quality; Occupational health;
Voice
RESUMO
Objetivo: Descrever e correlacionar medidas vocais perceptivo-auditivas
e acústicas, queixas vocais e características profissionais de um grupo de professoras. Métodos: Noventa e nove mulheres, entre 20 e 66 anos, professoras do ensino fundamental, realizaram análise vocal perceptivo--auditiva (CAPE-V) e acústica (Multi-Dimensional Voice Program Ad-vanced)e responderam a questionário, contendo dados de identificação, saúde geral, ocupacionais e queixas vocais. Foram aplicados os testes estatísticos Correlação de Pearson e ANOVA. Resultados: As professo-ras trabalhavam, em média, 6,98hoprofesso-ras por dia e atuavam como docentes há 12,91 anos, aproximadamente. A maioria apresentou queixas vocais e pertencia à rede de ensino particular. Os parâmetros perceptivo-auditivos estiveram normais. Todas as medidas de jitter, shimmer, segmentos surdos ou não sonorizados e sub-harmônicos mostraram-se acima da nor-malidade, bem como desvio-padrão da frequência fundamental e índice de fonação suave. Observou-se correlação positiva entre perturbação de frequência e idade, rugosidade, soprosidade e grau geral da voz com idade e tempo de atuação profissional. Observou-se correlação negativa entre perturbação da amplitude e uso diário da voz. Conclusão: A voz das professoras foi considerada normal pela avaliação perceptivo-auditi-va, mas houve detecção de ruído e instabilidade na análise acústica, com predomínio de queixas vocais, bem como alteração de medidas acústicas e perceptivo-auditivas, com o aumento de idade e tempo de profissão.
Descritores: Distúrbios da voz; Docentes; Qualidade da voz; Saúde do
trabalhador; Voz
Study conducted at the Graduate Program in Human Communication Disorders, Universidade Federal de Santa Maria – UFSM – Santa Maria (RS), Brazil, with a scholarship granted by Coordenação de Aperfeiçoamento de Pessoal de Nível Superior (CAPES).
(1) Graduate Program in Human Communication Disorders, Universidade Federal de Santa Maria – UFSM – Santa Maria (RS), Brazil.
Conflict of interest: No
Authors’ contribution: VVR: conception and design of the study, collection, analysis and interpretation of data; drafting the article; CAC conception and design of the study, interpretation of data; drafting the article, revising the article, final approval of the version to be published.
Correspondence address: Vanessa Veis Ribeiro. Universidade Federal de Santa Maria, Departamento de Fonoaudiologia. Av. Roraima, 1000, Prédio 26, 4º andar, Cidade Universitária, Camobi, Santa Maria (RS), Brazil, CEP: 97105-900. E-mail: [email protected]
INTRODUCTION
Work complements and gives meaning to life. It is one of the most important ways whereby individuals occupy a position in society, and a good occupational status is a deter-mining health factor. For this reason, a growing number of studies have sought to investigate the relationship between health and professional performance(1,2).
People use several resources at work; one group of pro-fessionals particularly use their voice to perform their work activities. They are the so-called voice professionals(1,2); teachers stand out in this group, as they have the highest prevalence of voice disorders related to working conditions and organization(2-7).
The literature reports that teachers are becoming ill as a result of factors that may influence or predispose the onset of early or late voice change. Such factors include not only individual characteristics and general health conditions, but also environmental factors and work organization procedures, i.e. excessive voice demand, long working hours, accumulat-ed activities, unsuitable acoustic environmental scenarios, ventilation and air quality, dissatisfaction with their job or remuneration, etc(1-3,5,6,8). However, it should be emphasized that the coexistence of antecedent, concurrent and subsequent causes of a given voice disorder does not preclude the asso-ciation between vocal disorders and teaching(1), i.e., teachers are not to be “blamed” for their voice disorder.
Furthermore, studies in the field of speech therapy show that the rates of vocal complaints and voice disorders ob-served in teachers are higher(9) in big cities compared with small cities(3), possibly because the latter have better living and working conditions, e.g., fewer students per class, fewer competing sound sources, etc.
About eighty percent of teachers reported voice com-plaints, and visible lesions were found by laryngoscopy in 20% of cases(10). The most common voice symptoms in Brazilian teachers are: loss of voice or aphonia, vocal fa-tigue, sore throat, hoarseness, throat clearing, dry throat, voice failures, vocal instability or tremor, sore throat/pain when speaking, deepened voice, loss of vocal efficiency, low resistance when speaking(1,3,6,7). Pain or hypertension in neck muscles, poor posture, speaking for hours, inadequate breathing pattern, change of tone/pitch, suddenly sharpening at the time of shouting, muffled voice and without projection, are characteristics often found among teachers, as well as anxiety and stress(1,5,6,11). Voice symptoms usually begin slowly and sporadically and develop over time until they become permanent; laryngeal lesions appear as a result(1,10,12).
In Brazil, 20% of teachers have had to miss work due to laryngeal problems(12,13); 97% of changes in work activities and job positions at schools were caused by voice disorders. Moreover, it is estimated that 2% of teachers will have to take a sick leave at some point in their career because of
voice-related problems(12,13).
A study showed the prevalence of women in the teaching profession(3) and the highest rates of dysphonia among teach-ers occur in females by a ratio of 2.7:1, which indicates a predisposition of women to acquire a voice disorder, because of both the anatomical configuration of their larynx and other biological aspects(7). Furthermore, the fact that the female fundamental frequency (f0) is similar to children’s f0 also generates the need for increased loudness in the classroom(14), which increases vocal fatigue. In addition, the teachers not only actively participate in the labor market, but also do domestic chores, i.e. they work “double shift” and perform an excessive number of activities, hence they feel physical and psychological stress, which, in turn, can lead to voice disorders(1,3,14).
There is no consensus in the literature on professional characteristics. One study has not found a relationship be-tween the presence of complaints or voice change(3) while others showed a relationship between increased vocal changes and an increase of teachers’ weekly workload(6,9).
In auditory-perceptual voice analyses of Brazilian teach-ers, the literature has shown that the biggest change occurred in the parameters hoarseness, breathiness and strain(4,12,15), and instability(12,15) and hyponasality(4) as well. Studies have shown vocal auditory-perceptual changes in 43.3% to 79.8% of teachers(6,12,15-17). The degree of vocal change ranged from mild(4,15), to slight(6,17) to moderate(15,18).
In the Brazilian literature, a recent study has shown chang-es to f0 and harmonics-to-noise measurchang-es, bchang-esidchang-es a high proportion of change in jitter (32%) and shimmer (43%)(16) measures, for most teachers investigated. Another study on vocal acoustic changes after vocal warm-up with 19 teachers of a college preparation course in a city in the state of São Paulo, Brazil, has shown a significant increase of f0 and har-monics-to-noise ratio after vocal warm-up, which remained after the voice was used in the classroom(19).
The close and complex relationship between the use of voice and teachers’ working conditions needs to be clarified and better understood(5), and the role of predisposing, con-tributing or precipitating factors of teaching-related vocal disorders needs to be defined, because such disorders are caused by several factors that may interact directly or indi-rectly, jeopardizing teachers’ careers and survival(1).
Given the above, this study sought to describe and correlate auditory-perceptual and acoustic measures, vocal complaints and professional characteristics of a group of teachers from Santa Maria (RS), Brazil.
METHODS
Maria (UFSM), under protocol no. 23081.016945/2010-76. Clarifications about the research were provided to the prin-cipals of schools, who signed the Institutional Authorization Agreement (IAA), and the volunteers, who signed an Informed Consent (IC) form.
The target population of the study was comprised of teachers from the whole network of elementary schools in the urban area of the city of Santa Maria, state of Rio Grande do Sul, Brazil. An inventory was made of all primary schools in the city; there is a total of 36 private schools, 44 municipal schools and 24 state schools.
The schools in each geographic region of the city were listed alphabetically by type of school (private, municipal and state). One out of every two schools was excluded from each list. The schools that remained after the random selection by raffling, in each region, were combined into an alphabetical list, regardless of education system and region, resulting in 19 state schools, 31 municipal schools and 27 private schools. All 77 schools were invited to participate in the research, but only 15 signed the IAA.
The selection of the sample was based on the following inclusion criteria: female teachers of state, private and mu-nicipal elementary schools (years 1 to 9) of the urban area of the city of Santa Maria (Rio Grande do Sul), Brazil.
The exclusion criteria were: reports of allergic, respira-tory or gastric crises, or hormonal dysfunction arising from pregnancy or premenstrual or menstrual period on the day of assessments, which otherwise could produce deviations in vocal parameters; reported neurological, metabolic, endocrine, syndromic and/or psychiatric illness; reported structural laryngeal pathology or dysfunction; smokers and/ or drinkers, because these agents are aggressive to the larynx and can lead to the formation of laryngeal pathologies; his-tory of laryngeal surgery and/or any surgical procedure for head and neck; speech therapy and/or ENT treatment for the voice, prior to data collection; auditory dysfunctions detected in hearing screening.
For sample selection (inclusion and exclusion criteria), a questionnaire (identification data, professional characteristics, general and vocal health) was applied, and hearing screening was also performed through pure tone air conduction audiom-etry at frequencies of 0.5 1, 2 and 4 kHz at 25 dB (Amplivox® A260 audiometer). The procedure was performed in a silent room provided by the school, with noise level below 50 dB, as checked by an Instrutherm® Dec-480 sound pressure level meter. The subjects who did not respond to pure tone at 25 dB were retested and the cases that failed the retest were excluded from the sample and referred for a complete hearing evalu-ation. Hearing screening sought to dismiss the interference of auditory feedback problems which compromised voice quality, which was part of the sample but whose results were not part of data collection for this study.
Sixteen out of the 197 volunteer teachers were excluded
because they had reported endocrinological disorders; 14 were excluded because they failed to meet the expected standards in the hearing screening; seven were excluded because they underwent speech or ENT treatment for the voice; four of them were smokers, and three of them reported neurological pathologies. 54 teachers were also discarded because they had not fully answered the questionnaire. Thus, the sample consisted of 99 female teachers, aged between 20 and 66 years (mean age 38.22 years) (Figure 1).
It should be noted that the mandatory requirement of signing the IC prevents researchers from including, in their studies, subjects who did not volunteer to participate in the procedures, and interestingly, subjects who have a problem may often show greater interest in participating in health studies.
The data about professional characteristics and presence of vocal complaints were collected from the questionnaire used in the sample selection. Vocal characterization was performed by means of perceptual-auditory and acoustic vocal assessment.
For the analyses, the sustained emission of vowel /a:/ was collected from the sample of spontaneous speech, by means of the question “Tell me about the importance of voice for your profession” and phrases from the Consensus audito-ry-perceptual evaluation of voice (CAPE-V)(20). Subjects were instructed to perform the vocal emission in their usual pitch and loudness after a deep breath, emitting the sound at maximum phonation time, without making use of expiratory reserve. Each sample was timed three times; the longest one was selected. For producing the emissions of the CAPE-V sentences and spontaneous speech, subjects were instructed to keep their usual speech rate pitch and loudness. The recording time of each speech situation was not controlled. Emissions were captured by a Zoom® H4n professional digital recorder, with quantization rate of 96 kHz and 16 bits, and recorded at 50% of the input level. The recorder was fixed on a pedestal and positioned at a 90° angle from the mouth of the subject, and coupled to a professional Behringer®ECM 8000 omnidi-rectional microphone, with flat frequency capture range of 15 to 20 kHz. Subjects maintained a distance of 4 cm between the microphone and the mouth for vowels, and 10 cm for emission of the sentences and spontaneous speech. For all emissions, the teachers were instructed to remain in a standing position.
Voice samples were recorded in a quiet location in the school, with environmental noise below 50 dB SPL (sound pressure level), measured by a digital sound pressure level meter.
Note: IC = Informed Consent
Figure 1. Flowchart of the study
Total of schools in the city: 107 schools
44 municipal schools
36 private schools
27 state schools
Randomization: 77 schools
31 municipal schools
27 private schools
19 state schools
Adherence to IC: 15 schools
7 private schools
5 state schools
3 municipal schools
Screening: 143 teachers
16 reports of endocrine disorders
14 havenot passed the hearing screening
7 underwent speech therapyor otorhinolaryngologi treatment for voice
4 smoker
3 reported neurological diseases
Sample: 99 teachers
50 private schools
37 state schools
12 municipal schools
The Multi-Dimensional Voice Program Advanced software from Kay Pentax® (MDVPA) was used. It has a sampling rate of 44 KHz and 16 bits. Since there is no exact correspondence in the literature between each acoustic measurement and its underlying phenomenon, it is believed that analyzing the measures as a group offers greater reliability. Thus, groups and measures taken were: (1) frequency measures: f0; maximum f0 (fhi); minimum f0 (flo); standard deviation of f0 (STD); (2) frequency perturbation measures:relative average pertur-bation (RAP); Jitter percentage (Jitt); absolute Jitter (Jita); smoothed pitch perturbation quotient (sPPQ); pitch perturba-tion quotient (PPQ); coefficient of variaperturba-tion of f0 (vf0); (3)
amplitude perturbation measures: Shimmer in dB (ShdB);
of normality by gender, proposed by the MDVPA software. The auditory-perceptual evaluation was performed with the CAPE-V protocol, consisting of a linear visual analog scale, ranging from 0 to 100 mm, which enables quantitative analyses(20,21). In Brazilian voices, scores between 0 and 35.5% are considered as normal; scores between 35.6% and 50.5% suggest that voice quality has mild to moderate deviation; 50.6% to 90.5% indicates that the change was moderate to intense, and above 90.6%, is indicative that the change is intense(21).
The voice samples were recorded on a Digital Versatile Disc (DVD) 52 x, 7 GB, with PCM audio formats; 96 kHz, 16 bits, mono, converted to waveform files. Folders with the three samples were placed on the DVD (vowel, sentences and spontaneous speech) without identification of the subject, in random order, with approximately 20% repetition (for testing the reliability of judges). Subsequently, five subjects were re-ferred to speech therapists other than the authors of this study, with experience of at least five years in the area of voice. The judges were blinded to the study objectives, the replication of emissions and evaluations of the other judges. They were informed only about the average age of the subjects.
The judges were instructed to listen to the voices as many times as necessary, in a quiet environment and with the following computer settings: 16 bits, 96 KHz. Analyses were performed according to the parameters of the CAPE-V protocol (overall level of dysphonia, breathiness, roughness, strain, pitch and loudness)(20). After the judges evaluated the voices, statistical analysis was performed in order to verify the intra and inter-rater reliability by means of the Kappa coefficient. The three judges with greater intra-rater reliability were part of the inter-rater statistical evaluation. Inter-rater reliability of the three judges was moderate (0.42), consider-ing the followconsider-ing classifications: between 0.8 and 1, almost perfect reliability; 0.6 and 0.79, good; 0.4 and 0.59, moderate; 0.2 and 0.39, regular; between zero and 0.19, poor; between zero and -1, no reliability. The mean of the values assigned by these three judges was calculated for each parameter of the CAPE-V scale.
Schools did not have access to the results of individual evaluations, thus preserving the privacy of the teachers. The teachers received individual feedback on the results of eval-uations and those who showed vocal changes were advised and referred to voice therapy.
Data were analyzed descriptively and by means of non-parametric ANOVA and Pearson’s correlation tests, with a significance level of 5%.
RESULTS
The study sample consisted of teachers (n=99) who worked an average of 6.98 hours per day and had been teaching for 12.91 years approximately. They all had normal hearing, as
assessed by hearing screening. Most of them worked in pri-vate schools (n=50; 50.5%), followed by state (n=37; 37.4%) and municipal (n=12; 12.1%) schools. Seventy-four teachers had voice complaints (74.7%), with significant differences compared with those who did not (p≤0.001).
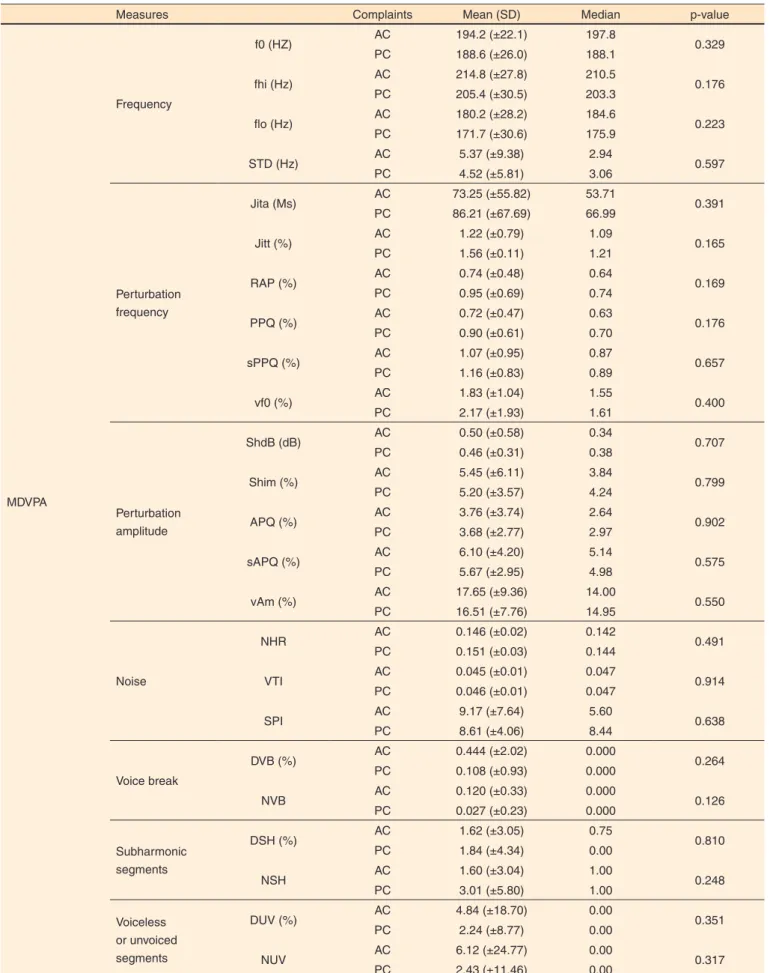
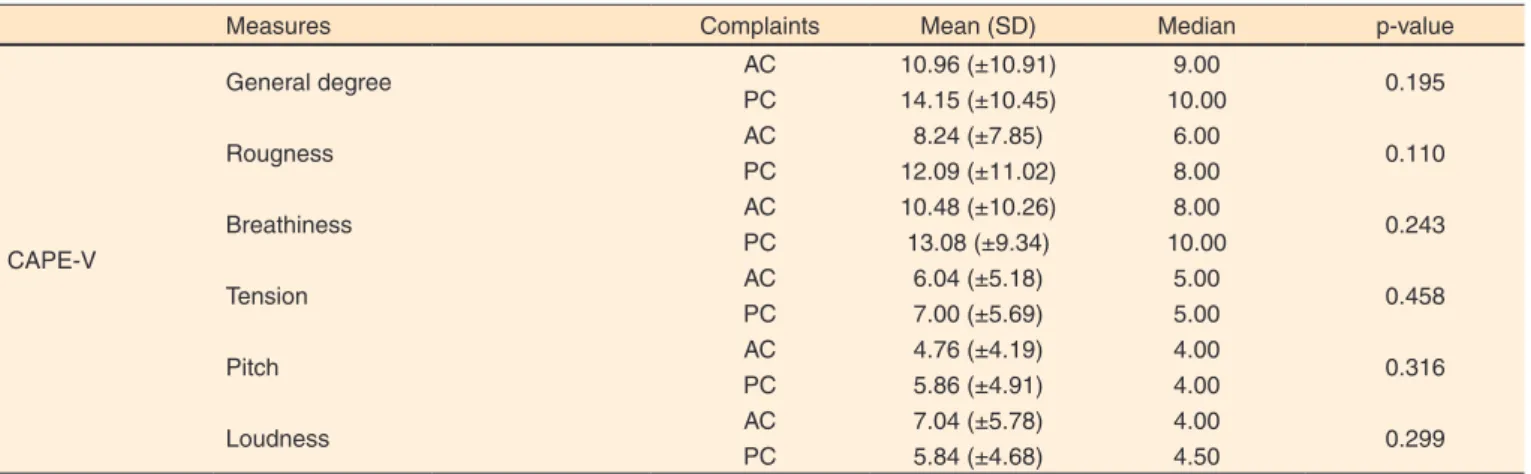
Table 1 shows the descriptive results of the auditory-per-ceptual (CAPE-V) and acoustic (MDVPA) vocal assessments. There was no correlation between the presence or absence of vocal complaints and auditory-perceptual and acoustic vo-cal measures (Table 2).
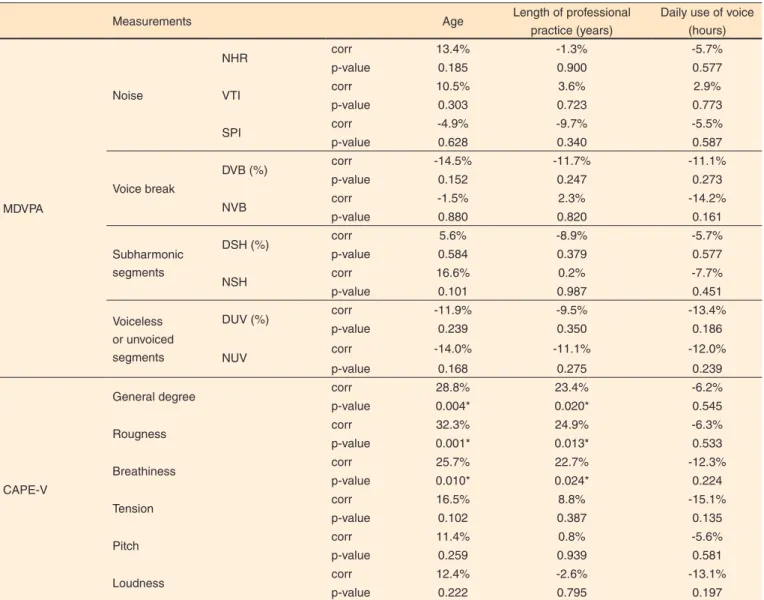
Table 3 shows the correlations between auditory-perceptu-al and acoustic vocauditory-perceptu-al measures and age, length of professionauditory-perceptu-al
practice and daily professional use of voice.
DISCUSSION
Most teachers evaluated in this study showed vocal complaint, which is consistent with the literature(3,9,11,16). The results of this study were similar to those of another study(3), also conducted with teachers in a countryside town in Rio Grande do Sul, as regards length of professional practice
(years), daily activities (hours) and mean age of participants. In the auditory-perceptual vocal analysis of the teachers, all parameters analyzed were within the variability considered as normal, ranging from zero to 35.5(21) (Table 1). This result is consistent with research on auditory-perceptual speech data of teachers, which found that the majority had mild deviations, or within the normal variability of voice(4,17). However, the rates in this study were lower than most rates found in the Brazilian literature which showed voice disorders in teachers(5,6,15,18). This fact may have arisen from better working conditions and a different health profile of the teachers, as this research took place in several schools in a countryside town.
In the acoustic analysis, all measures of frequency per-turbation (jitter), amplitude perper-turbation (shimmer)(22-26), voiceless or unvoiced segments and harmonic sub-segments were above normal rates, and so were STD and SPI (Table 1). These results, when analyzed together, suggest the presence of noise and instability in the glottal signal.
Measures of voiceless or unvoiced segments are associated with irregular voice and characterize disrupted periodicity of the sound wave, reflected as noise or irregular emission(24,26). The presence of low-intensity subharmonic components be-tween the harmonics may indicate the presence of noise(23,26), such as hoarseness.
The SPI, which assesses the lack of high-frequency har-monic components, can also suggest changes of glottal clo-sure, with the presence of noise at emission(23), while the lack or reduction of high frequency harmonics is related to breath-iness and/or hoarseness. STD measures the standard deviation
of the fundamental frequency and its change suggests long-term phonation instability, which could result in alteration of mucosal vibration or lack of neuromuscular control(23,25). Overall, the results showed the presence of vocal aperiodicity with noise to sound, as well as instability at emission, thus characterizing changes in the glottal signal, which may be due to individual characteristics and/or working conditions, causing teachers to have complaints and lose voice quality.
Intensive and inappropriate use of voice, such as excessive speaking, competitive sound sources, increased stress, lack of rest and hydration, inadequate body postures and breathing
Table 1. Descriptive results of auditory-perceptual and acoustic vocal assessments of glottal source for teachers in Santa Maria
Measurements Mean (SD) Median
MDVPA
Frequency
f0 (HZ) 190.0 (±25.1) 190.1
fhi (Hz) 207.7 (±30.0) 204.5
flo (Hz) 173.9 (±30.1) 178.1
STD (Hz) 4.74 (±6.48) ɫ 3.03
Perturbation frequency
Jita (Ms) 82.94 (±64.87) ɫ 65.91
Jitt (%) 1.47 (±1.05) ɫ 1.15
RAP (%) 0.89 (±0.65) ɫ 0.71
PPQ (%) 0.86 (±0.58) ɫ 0.69
sPPQ (%) 1.14 (±0.85) ɫ 0.88
vf0 (%) 2.08 (±1.75) ɫ 1.61
Perturbation amplitude
ShdB (dB) 0.47 (±0.40) ɫ 0.37
Shim (%) 5.26 (±4.32) ɫ 4.20
APQ (%) 3.70 (±3.03) ɫ 2.94
sAPQ (%) 5.78 (±3.29) ɫ 4.99
vAm (%) 16.80 (±8.16) ɫ 14.79
Noise
NHR 0.150 (±0.03) 0.142
VTI 0.046 (±0.01) 0.047
SPI 8.75 (±5.16) ɫ 7.84
Voice break DVB (%) 0.193 (±1.29) 0.000
NVB 0.051 (±0.26) 0.000
Sub-harmonic segments DSH (%) 1.78 (±4.04) ɫ 0.00
NSH 2.66 (±5.26) ɫ 1.00
Voiceless or unvoiced segments DUV (%) 2.90 (±12.01) ɫ 0.00
NUV 3.36 (±15.83) ɫ 0.00
CAPE-V
General degree 12.88 (±10.52) 9.00
Roughness 10.80 (±10.31) 7.00
Breathiness 11.91 (±9.65) 9.00
Tension 6.43 (±5.58) 5.00
Pitch 5.41 (±4.76) 4.00
Loudness 5.84 (±4.98) 4.00
Table 2. Results of the association between the presence or absence of vocal complaints and auditory-perceptual and acoustic vocal measures in teachers from Santa Maria
Measures Complaints Mean (SD) Median p-value
MDVPA
Frequency
f0 (HZ) AC 194.2 (±22.1) 197.8 0.329
PC 188.6 (±26.0) 188.1
fhi (Hz) AC 214.8 (±27.8) 210.5 0.176
PC 205.4 (±30.5) 203.3
flo (Hz) AC 180.2 (±28.2) 184.6 0.223
PC 171.7 (±30.6) 175.9
STD (Hz) AC 5.37 (±9.38) 2.94 0.597
PC 4.52 (±5.81) 3.06
Perturbation frequency
Jita (Ms) AC 73.25 (±55.82) 53.71 0.391
PC 86.21 (±67.69) 66.99
Jitt (%) AC 1.22 (±0.79) 1.09 0.165
PC 1.56 (±0.11) 1.21
RAP (%) AC 0.74 (±0.48) 0.64 0.169
PC 0.95 (±0.69) 0.74
PPQ (%) AC 0.72 (±0.47) 0.63 0.176
PC 0.90 (±0.61) 0.70
sPPQ (%) AC 1.07 (±0.95) 0.87 0.657
PC 1.16 (±0.83) 0.89
vf0 (%) AC 1.83 (±1.04) 1.55 0.400
PC 2.17 (±1.93) 1.61
Perturbation amplitude
ShdB (dB) AC 0.50 (±0.58) 0.34 0.707
PC 0.46 (±0.31) 0.38
Shim (%) AC 5.45 (±6.11) 3.84 0.799
PC 5.20 (±3.57) 4.24
APQ (%) AC 3.76 (±3.74) 2.64 0.902
PC 3.68 (±2.77) 2.97
sAPQ (%) AC 6.10 (±4.20) 5.14 0.575
PC 5.67 (±2.95) 4.98
vAm (%) AC 17.65 (±9.36) 14.00 0.550
PC 16.51 (±7.76) 14.95
Noise
NHR AC 0.146 (±0.02) 0.142 0.491
PC 0.151 (±0.03) 0.144
VTI AC 0.045 (±0.01) 0.047 0.914
PC 0.046 (±0.01) 0.047
SPI AC 9.17 (±7.64) 5.60 0.638
PC 8.61 (±4.06) 8.44
Voice break
DVB (%) AC 0.444 (±2.02) 0.000 0.264
PC 0.108 (±0.93) 0.000
NVB AC 0.120 (±0.33) 0.000 0.126
PC 0.027 (±0.23) 0.000
Subharmonic segments
DSH (%) AC 1.62 (±3.05) 0.75 0.810
PC 1.84 (±4.34) 0.00
NSH AC 1.60 (±3.04) 1.00 0.248
PC 3.01 (±5.80) 1.00
Voiceless or unvoiced segments
DUV (%) AC 4.84 (±18.70) 0.00 0.351
PC 2.24 (±8.77) 0.00
NUV AC 6.12 (±24.77) 0.00 0.317
Measures Complaints Mean (SD) Median p-value
CAPE-V
General degree AC 10.96 (±10.91) 9.00 0.195
PC 14.15 (±10.45) 10.00
Rougness AC 8.24 (±7.85) 6.00 0.110
PC 12.09 (±11.02) 8.00
Breathiness AC 10.48 (±10.26) 8.00 0.243
PC 13.08 (±9.34) 10.00
Tension AC 6.04 (±5.18) 5.00 0.458
PC 7.00 (±5.69) 5.00
Pitch AC 4.76 (±4.19) 4.00 0.316
PC 5.86 (±4.91) 4.00
Loudness AC 7.04 (±5.78) 4.00 0.299
PC 5.84 (±4.68) 4.50
ANOVA test (p≤0.05)
Note: AC = absence of complaint; PC = presence of complaint; CAPE-V = Consensus Auditory-Perceptual Evaluation of Voice; MDVPA = Multi-Dimensional Voice Program Advanced®; SD = standard deviation; f0 = fundamental frequency; fhi = maximum f0; flo = minimum f0; STD = f0 standard deviation; RAP = average on the perturbation; jitt = percent jitter; jita = absolute jitter; sPPQ = smoothed pitch perturbation quotient; PPQ = pitch period perturbation quotient; vf0 = coefficient of variation of f0; ShdB = shimmer in dB; Shim = percentage shimmer; vAm = coefficient of variation of amplitude; APQ = amplitude perturbations quotient; sAPQ = smoothed amplitude per-turbation quotient; NHR = noise-harmonic ratio; SPI = soft phonation index; VTI = voice turbulence index; NVB = number of vocal breaks; DVB = degree of voice breaks; DUV = degree of unvoiced segments; NUV = number of unvoiced segments; NSH = numbers of sub-harmonic segments; DSH = degree of sub-harmonic components
Table 2. Results of the association between the presence or absence of vocal complaints and auditory-perceptual and acoustic vocal measures in teachers from Santa Maria (cont.)
Table 3. Results of the correlation between perceptual and acoustic voice measures and age, length of professional practice and daily use of voice from teachers in Santa Maria
Measurements Age Length of professional
practice (years)
Daily use of voice (hours)
MDVPA
Frequency
f0 (HZ) corr -18.4% -7.8% 0.7%
p-value 0.068 0.444 0.946
fhi (Hz) corr -15.3% -11.1% -1.2%
p-value 0.130 0.273 0.907
flo (Hz) corr -11.0% -0.1% 6.8%
p-value 0.279 0.993 0.504
STD (Hz) corr -10.9% -9.0% -10.9%
p-value 0.285 0.377 0.281
Perturbation frequency
Jita (Ms) corr 21.2% 11.4% -5.2%
p-value 0.035* 0.261 0.609
Jitt (%) corr 13.7% 5.8% -9.5%
p-value 0.176 0.570 0.349
RAP (%) corr 14.5% 5.4% -9.0%
p-value 0.153 0.597 0.376
PPQ (%) corr 9.3% 5.1% -11.1%
p-value 0.360 0.616 0.276
sPPQ (%) corr 0.9% 0.2% -14.0%
p-value 0.932 0.982 0.167
vf0 (%) corr 5.7% -0.9% -5.0%
p-value 0.576 0.930 0.625
Perturbation amplitude
ShdB (dB) corr -9.9% -14.1% -12.7%
p-value 0.334 0.168 0.213
Shim (%) corr -7.8% -13.8% -12.3%
p-value 0.445 0.173 0.226
APQ (%) corr -8.2% -12.4% -14.3%
p-value 0.420 0.223 0.159
sAPQ (%) corr -5.6% -9.5% -19.9%
p-value 0.584 0.348 0.049*
vAm (%) corr -8.8% -10.7% -12.6%
Table 3. Results of the correlation between perceptual and acoustic voice measures and age, length of professional practice and daily use of voice from teachers in Santa Maria (cont.)
Measurements Age Length of professional
practice (years)
Daily use of voice (hours)
MDVPA
Noise
NHR corr 13.4% -1.3% -5.7%
p-value 0.185 0.900 0.577
VTI corr 10.5% 3.6% 2.9%
p-value 0.303 0.723 0.773
SPI corr -4.9% -9.7% -5.5%
p-value 0.628 0.340 0.587
Voice break
DVB (%) corr -14.5% -11.7% -11.1%
p-value 0.152 0.247 0.273
NVB corr -1.5% 2.3% -14.2%
p-value 0.880 0.820 0.161
Subharmonic segments
DSH (%) corr 5.6% -8.9% -5.7%
p-value 0.584 0.379 0.577
NSH corr 16.6% 0.2% -7.7%
p-value 0.101 0.987 0.451
Voiceless or unvoiced segments
DUV (%) corr -11.9% -9.5% -13.4%
p-value 0.239 0.350 0.186
NUV corr -14.0% -11.1% -12.0%
p-value 0.168 0.275 0.239
CAPE-V
General degree corr 28.8% 23.4% -6.2%
p-value 0.004* 0.020* 0.545
Rougness corr 32.3% 24.9% -6.3%
p-value 0.001* 0.013* 0.533
Breathiness corr 25.7% 22.7% -12.3%
p-value 0.010* 0.024* 0.224
Tension corr 16.5% 8.8% -15.1%
p-value 0.102 0.387 0.135
Pitch corr 11.4% 0.8% -5.6%
p-value 0.259 0.939 0.581
Loudness corr 12.4% -2.6% -13.1%
p-value 0.222 0.795 0.197
*Significant values (p≤0.05) – Pearson’s correlation test
Note: corr = correlation; CAPE-V = Consensus Auditory-Perceptual Evaluation of Voice; MDVPA = Multi-Dimensional Voice Program Advanced®; f0 = fundamental fre-quency; fhi = maximum f0; flo = minimum f0; STD = f0 standard deviation; RAP = average on the perturbation; jitt = percent jitter; jita = absolute jitter; sPPQ = smoothed pitch perturbation quotient; PPQ = pitch period perturbation quotient; vf0 = coefficient of variation of f0; ShdB = shimmer in dB; Shim = percentage shimmer; vAm = coefficient of variation of amplitude; APQ = amplitude perturbations quotient; sAPQ = smoothed amplitude perturbation quotient; NHR = noise-harmonic ratio; SPI = soft phonation index; VTI = voice turbulence index; NVB = number of vocal breaks; DVB = degree of voice breaks; DUV = degree of unvoiced segments; NUV = number of unvoiced segments; NSH = numbers of sub-harmonic segments; DSH = degree of sub-harmonic components
for professional speaking voices, and other factors, common-ly present among teachers, are vocal behaviors that distort effective and efficient production of voice(3,7,22,24). Excessive speaking can result in vocal fatigue, especially in the long run, causing the voice quality to show noise, instability and weakness, and require greater effort(9,24), thus creating a vi-cious cycle.
In addition to increased tension and stress, many teach-ers have signs like sudden vocal attack, high larynx and anterior-posterior laryngeal constriction(24). Cases of vocal hypertension also may be responsible for mild edema in the vocal folds, causing changes in the vibratory cycle of the vocal folds, noise/random aperiodic energy in the voice, as well as decreased vocal stability(3,16,24).
This way, teachers cannot be “blamed” for their voice disorders when, even in the presence of aggravating and triggering or intrinsic factors, they work in an environment that favors illness(1,11). This has been verified in the literature, considering the characteristics of working conditions imposed on teachers(1-3,5,6,8,14).
and material resources, discomfort and thermal shock, poor air quality, improper ventilation, low humidity, and exposure to irritant chemicals by breathing (solvents, metal fumes, asphyxiating gases) and dust or smoke in the workplace(1).
In this investigation, the presence of vocal complaints in the analyzed group has provided acoustic samples of voice disorder but there was no difference, although the audito-ry-perceptual evaluation has not detect them; there was no difference, either, between the presence of vocal complaints in both evaluations (Tables 1 and 2). Even though the perceptual analysis is considered as the gold standard for the evaluation of voice quality(21), the acoustic findings should be valued as complementary because they can point to changed parameters, while the auditory-perceptual analysis still shows slight or normal deviations(4,17), due to its greater accuracy compared with the human ear.
In a similar study(11), held in municipal schools in the city of São Paulo / Brazil with a sample of 165 teachers, 36 adult teachers reported having voice alteration, but these data were not confirmed by auditory-perceptual voice evaluation, as occurred in present study, although the judges had access to only one voice sample from each subject and these were predominantly proprioceptive symptoms, which may have contributed to the failure to identify the presence of dysphonia by auditory-perceptual analysis.
Still, converging to this research, there was high occur-rence of vocal symptoms that were secondary to intensive vocal use and stress, ranked by most as moderate. The symptoms most often reported by teachers were hoarseness, vocal fatigue, throat-clearing, and dry throat, and they were aggravated by the presence of dust, noise, overwork, lack of time to develop activities in school and constant performance monitoring. Thus, those workplaces can be considered as harmful to health and voice(11).
As regards the correlation between voice and professional characteristics, there was increased frequency perturbation (jita), with increasing age; decreased amplitude perturbations (sAPQ) as daily use of the voice increased; increasing rough-ness, breathiness and overall degree of voice with teachers’ increasing age and length of professional practice (Table 3).
Age and length of professional practice are two directly proportional variables. Intensive and inappropriate uses of voice, lack of respiratory control and individual susceptibility, reinforced by physical, social and psychological factors that also cause work-related(1,2,6,8) voice disorders, may contribute to the presence roughness, breathiness, hoarseness, and/or vocal instability(3,24,28). Rest periods and less vocal demand can improve the voice quality of subjects, and as the incorrect uses of voice by teachers are repeated, disorders appear over time(24), as in the cases of this study.
The measure of shimmer (sAPQ) relates to the glottic resistance and the presence of noise and instability in the signal. In this research, the measure decreased with increased
daily use of voice, suggesting greater glottal closure, stability and less transglottic air leak(29,30). Such data can be related to excessive speaking and vocal fatigue, which occur with increasing daily use of voice, generating compensatory ac-tion of neuromuscular disorders and providing greater glottal adduction force(24), in a case of compensatory hyperfunction. Based on the results of this research and other studies, there should be further research on determining environmental and organizational factors in schools which influence teach-ers’ voices. Thus, there can be scientific evidence for these factors, and the need for improving them can be highlighted. Some studies suggest the deployment of vocal training and orientation programs for teachers, because voice disorders in this population may jeopardize their job performance and continuity in their career(1,3,9), causing damage to society and the economy(1).
In this research, in addition to the presence of all the factors mentioned above, there was some difficulty in in-troducing speech therapy in schools. Although the method was performed rigorously and feedback was provided on case by case basis, some schools refused to participate in the study, or hindered data collection: teachers did not return the questionnaires, which resulted in loss of subjects in the sampling process.
CONCLUSION
The voice of teachers was considered normal by the auditory-perceptual assessment, but noise and instability were detected in the acoustic analysis, with the predomi-nance of vocal complaints, as well as change in acoustic and auditory-perceptual measures, with increasing age and length of professional practice. It was also observed that noise and instability decreased with increased daily use of voice, which suggests some kind of hyperfunctional compensation. They may develop into a vocal disorder, given the increase in complaints from teachers, age, time of professional practice and hyperfunctional compensation throughout the working day.
Considering teachers’ working conditions, the challenges for health promotion and prevention of work-related vocal disorders lie in actually decreasing the incidence of voice-re-lated health problems, given the several causes of work-revoice-re-lated voice disorders. However, based on the results of scientific research, prevention measures and multidisciplinary interven-tion protocols can be developed and implemented in order to promote changes in environments and work processes and, thus, improve the quality of life of workers on issues related directly and indirectly to voice.
REFERENCES
Departamento de saúde Ambiental e Saúde do Trabalhador. Distúrbio de voz relacionado ao trabalho. Brasília: Ministério da Saúde; 2011 [acesso em: 6 ago 2014]. Série A. Normas e manuais técnicos. Disponível em: http://aborlccf.org.br/imagebank/Protocolo_DVRT.pdf
2. Rocha LMR, Souza LDM. Voice Handicap Index associated with common mental disorders in elementary school teachers. J Voice. 2013;27(5):595-02. http://dx.doi.org/10.1016/j.jvoice.2012.10.001 3. Schwarz K, Cielo CA. A voz e as condições de trabalho de professores de cidades pequenas do Rio Grande do Sul. Rev Soc Bras Fonoaudiol. 2005;10(2):83-90.
4. Vieira AC, Behlau M. Análise de voz e comunicação de professores de curso pré-vestibular. Rev Soc Bras Fonoaudiol. 2009;14(3):346-51. http://dx.doi.org/10.1590/S1516-80342009000300010
5. F a b r í c i o M Z , K a s a m a S T, M a r t i n e z E Z . Q u a l i d a d e de vida relacionada à voz de professores universitários. Rev CEFAC. 2010;12(2):280-7. http://dx.doi.org/10.1590/S1516-18462009005000062
6. Ceballos AGC, Carvalho FM, Araujo TM, Reis EJFB. Avaliação perceptivo-auditiva e fatores associados à alteração vocal em professores. Rev Bras Epidemiol. 2011;14(2):285-95. http://dx.doi. org/10.1590/S1415-790X2011000200010
7. Musial PL, Dassie-Leite AP, Zaboroski AP, Casagrande RC. Interferência dos sintomas vocais na atuação profissional de professores. Distúrb Comum. 2011;23(3):335-41.
8. Machado IM, Bianchini EMG, Andrada e Silva MA, Ferreira LP. Voz e disfunção temporomandibular em professores. Rev CEFAC. 2009;11(4):630-43. http://dx.doi.org/10.1590/S1516-18462009000800012
9. Alves LP, Araujo LTR, Xavier Neto JA. Prevalência de queixas vocais e estudo de fatores associados em uma amostra de professores de ensino fundamental em Maceió, Alagoas, Brasil. Rev Bras Saúde Ocup. 2010;35(121):168-75. http://dx.doi.org/10.1590/S0303-76572010000100018
10. Fortes FSG, Imamura R, Tsuji DH, Sennes LU. Perfil dos profissionais da voz com queixas vocais atendidos em um centro terciário de saúde. Rev Bras Otorrinolaringol. 2007;73(1):27-31. http:// dx.doi.org/10.1590/S0034-72992007000100005
11. Servilha EAM, Pena J. Tipificação de sintomas relacionados à voz e sua produção em professores identificados com ausência de alteração vocal na avaliação fonoaudiológica. Rev CEFAC. 2010;12(3):454-61. http://dx.doi.org/10.1590/S1516-18462010005000035
12. Lima-Silva MFB, Ferreira LP, Oliveira IB, Silva MAA, Ghirardi ACAM. Distúrbio de voz em professores: autorreferência, avaliação perceptiva da voz e das pregas vocais. Rev Soc Bras Fonoaudiol. 2012; 17(4):391-97. http://dx.doi.org/10.1590/S1516-80342012000400005 13. Palheta Neto FX, Rebelo Neto OB, Ferreira Filho JSS, Palheta ACP, Rodrigues LG, Silva FA. Relação entre as condições de trabalho e a autoavaliação em professores do ensino fundamental. Arq Intern Otorrinolaring. 2008;12(2):230-8.
14. Souza CL, Carvalho FM, Araújo TM, Reis EJFB, Lima VMC, Porto LA. Fatores associados a patologias de pregas vocais em professores. Rev Saúde Pública. 2011;45(5):914-21. http://dx.doi.org/10.1590/ S0034-89102011005000055
15. Guidini RF, Bertoncello F, Zanchetta F, Dragone MLS. Correlações entre ruído ambiental em sala de aula e voz do professor. Rev Soc Bras Fonoaudiol. 2012;17(4):398-404. http://dx.doi.org/10.1590/S1516-80342012000400006
16. Simões-Zenari M, Bitar ML, Nemr K. Efeito do ruído na voz de educadoras de instituições de educação infantil. Rev Saúde Pública. 2012;46(4):657-64. http://dx.doi.org/10.1590/S0034-89102012005000038
17. Bassi IB, Assunção AA, Medeiros AM, Menezes LN, Teixeira LC, Gama ACC. Quality of life, self-perceived dysphonia, and diagnosed dysphonia through clinical tests in teachers. J Voice. 2011;25(2):192-201. http://dx.doi.org/10.1016/j.jvoice.2009.10.013
18. Morais EPG, Azevedo RR, Chiari BM. Correlação entre voz, autoavaliação vocal e qualidade de vida em voz de professoras. Rev CEFAC. 2012;14(5):892-900. http://dx.doi.org/10.1590/S1516-18462012005000032
19. Jacarandá MB. Aquecimento vocal: os efeitos perceptivo-auditivos, acústicos, e as sensações proprioceptivas de uma proposta de intervenção fonoaudiológica junto ao professor [dissertation]. São Paulo: Pontifícia Universidade Católica de São Paulo; 2005.
20. American Speech-Language-Hearing Association. (2002). Consensus auditory-perceptual evaluation of voice (CAPE-V), United States of America. 2002 [acesso em: 5 maio 2013]. Disponível em: http://www.asha.org/uploadedFiles/ASHA/SIG/03/affiliate/CAPE-V-Purpose-Applications.pdf
21. Yamasaki R, Leão SHS, Madazio G, Padovani M, Azevedo R, Behlau MS. Correspondência entre escala analógico-visual e escala numérica na avaliação perceptivoauditiva de vozes. In: Anais do 16º Congresso Brasileiro de Fonoaudiologia; 24 a 27 set 2009; Campos do Jordão, Brasil. Brasília: Sociedade Brasileira de Fonoaudiologia; 2008 [acesso em: 5 maio 2013]. Disponível em: http://www.sbfa.org. br/portal/anais2008/resumos/R1080-2.pdf.
22. Behlau M, organizador. Voz: o livro do especialista. Rio de Janeiro: Revinter; 2001.
23. Barros APB, Carrara-de-Angelis E. Análise acústica da voz. In: Dedivitis RA, Barros APB, organizadores. Métodos de avaliação e diagnóstico da laringe e voz. São Paulo: Lovise; 2002. P. 185-200. 24. Colton RH, Casper JK, Leonard R, organizadores. Compreendendo os problemas de voz: uma perspectiva fisiológica ao diagnóstico e ao tratamento. Rio de Janeiro: Revinter; 2010.
25. Ferreira FV, Cielo CA, Trevisan ME. Medidas vocais acústicas na doença de Parkinson: estudo de casos. Rev CEFAC. 2010;12(5):889-98. http://dx.doi.org/10.1590/S1516-18462010005000020
26. Beber BC, Cielo CA. Medidas acústicas de fonte glótica de vozes masculinas normais. Pró-Fono. 2011;22(3):299-304. http://dx.doi. org/10.1590/S0104-56872010000300024
27. Finger LS, Cielo CA, Schwarz K. Acoustic vocal measures in women without voice complaints and with normal larynxes. Braz J Otorrinolaryngol. 2009;75(3):432-40. http://dx.doi.org/10.1590/S1808-86942009000300020
29. Roman-Niehues G, Cielo CA. Modificações vocais acústicas produzidas pelo som hiperagudo. Rev CEFAC. 2010;12(3):462-70. http://dx.doi.org/10.1590/S1516-18462009005000059