*e-mail: [email protected]
Received: 23 July 2014 / Accepted: 05 November 2014
Automatic segmentation and classifi cation of blood components in
microscopic images using a fuzzy approach
Alessandra Mendes Pacheco Guerra Vale*, Ana Maria Guimarães Guerreiro, Adrião Duarte Dória Neto, Geraldo Barroso Cavalvanti Junior, Victor Cezar Lucena Tavares de Sá Leitão, Allan Medeiros Martins
Abstract Introduction: Automatic detection of blood components is an important topic in the i eld of hematology.
Segmentation is an important step because it allows components to be grouped into common areas and
processed separately. This paper proposes a method for the automatic segmentation and classii cation of
blood components in microscopic images using a general and automatic fuzzy approach. Methods: During pre-processing, the supports of the fuzzy sets are automatically calculated based on the histogram peaks in the green channel of the RGB image and the Euclidean distance between the leukocyte nuclei centroids and
the remaining pixels. During processing, fuzzii cation associates the degree of pertinence of the gray level of each pixel in the regions dei ned in the histogram with the proximity of the leukocyte nucleus centroid closest to the pixel. The fuzzy rules are then applied, and the image is defuzzii ed, resulting in the classii cation of
four regions: leukocyte nuclei, leukocyte cytoplasm, erythrocytes and blood plasma. In post-processing, false positives are reduced and the leukocytes (including the nucleus and cytoplasm), erythrocytes and blood plasma are segmented. Results: A total of 530 microscopic images of blood smears were processed, and the results were compared with the results of manual segmentation by experts and the accuracy rates of other approaches. Conclusion: The method demonstrated average accuracy rates of 97.31% for leukocytes, 95.39% for erythrocytes and 95.06% for blood plasma, avoiding the limitations found in the literature and contributing to the practice of the segmentation of blood components.
Keywords Digital image processing, Fuzzy logic, Image segmentation, Blood analysis.
Introduction
Hematology is the study of blood, including its organs of origin, functions, diseases and disorders. In hematology, the analysis of various blood components, especially leukocytes and erythrocytes, which are the focus of this work, is based on the microscopic observation of stained blood smears i xed to a glass slide. The components of blood can be differentiated based on their color. When stained, the blood components usually show the following pattern: the blood plasma is the lightest, erythrocytes and leukocyte cytoplasm are intermediate in brightness, and leukocyte nuclei are the darkest. However, because there is color variation in each component, the classii cation process is inaccurate and subjective.
Manual analysis, conducted by experts using an optical microscope to identify, characterize and count the blood components, is a tedious process that is unreliable, subjective and difi cult to reproduce. As described in Guo et al. (2006), automated analysis for the identii cation of different classes of cells is useful in the diagnosis of diseases such as cancer and anemia. Digital image processing techniques, which improve the quality of blood analysis and can handle inaccurate data well, have achieved good results.
Fuzzy logic is a powerful tool for handling the ambiguous and vague information that is inherent in blood analysis. According to Zadeh (1973), fuzzy logic is a mathematical expression of the formulations of human thought in natural language, without decreasing their expressive power. According to Cox (1994), combining the inaccuracy associated with natural events and the computing power of machines allows the production of robust and l exible intelligent response systems.
In traditional sets, the concept of an element as a member of a set is well dei ned. In fuzzy sets, an element has a degree of membership in a set. The membership of an element in a specii c set is the intensity with which the element is related to the set. As reported by Klir and Folger (1988), an element can be a full member of a fuzzy set, have an intermediate membership value or not be a member. It is this feature of vagueness that allows fuzzy logic to perform well on problems involving imprecise concepts, such as segmentation and classii cation for detecting and distinguishing different regions of an image.
fuzzy logic in combination with other techniques. Jiji and Ganesan (2010) proposed two approaches based on fuzzy logic for the identiication of textures in color images. Tan and Isa (2011) presented a histogram-based thresholding technique that used a fuzzy C-means algorithm to improve the clustering and uniformity of regions. Nawgaje and Kanphade (2011) proposed a fuzzy inference system for the detection of the edges of microscopic images. Wang et al. (2012) proposed an image segmentation method that used a fuzzy C-means algorithm and a support vector machine. Sansone et al. (2012) proposed an algorithm for comet assay analysis consisting of two stages: comet identiication via Gaussian pre-iltering and morphological operators and comet segmentation via fuzzy clustering.
Other studies have been conducted on blood component segmentation using digital image processing and fuzzy logic. Ramoser et al. (2005) proposed a leukocyte segmentation method that analyzed the saturation to identify the leukocyte nucleus and used an adaptive thresholding approach for leukocyte cytoplasm segmentation. Hamghalam and Aytollahi (2009) proposed a method for leukocyte nucleus segmentation based on image binarization in which the peak of the histogram of erythrocyte intensity was selected as the threshold. The leukocyte cytoplasm was extracted based on the distance between the center of the leukocyte nucleus and the nearest erythrocytes. Ko et al. (2011) presented a leukocyte segmentation technique that used stepwise merging rules based on mean-shift clustering and boundary removal rules based on a GVF (Gradient Vector Flow) snake. Rezatoighi and Soltanian-Zadeh (2011) proposed a method based on Gram–Schmidt orthogonalization and a snake algorithm for the segmentation of the nucleus and cytoplasm of leukocytes. Ramesh et al. (2012) proposed a method for the segmentation of leukocytes using the S channel of the HSV color model. A ixed threshold was used to identify the leukocyte nucleus, and the leukocyte cytoplasm was identiied based on a previously deined ixed distance from the leukocyte nucleus. Fatichah et al. (2012) proposed an interest-based sorting scheme using fuzzy morphology for the segmentation of the leukocyte nucleus from the cytoplasm. Putzu and Ruberto (2013) presented a leukocyte segmentation method using a threshold automatically calculated using the Zack algorithm and watershed segmentation applied to the transformed image distance. Jati et al. (2014) proposed an approach for automatic segmentation that used an intuitive fuzzy divergence-based thresholding technique. Zheng et al. (2014) demonstrated a fast hierarchical framework for leukocyte localization and segmentation in rapidly stained leukocyte images.
However, despite the positive results obtained in the cited studies, the studies have many limitations: i) the blood samples use the same staining method; ii) speciic blood components are segmented, but others are neglected; iii) pre-set thresholds are used for segmentation; iv) the methods produce relatively high false-positive rates due to the proximity of the leukocyte cytoplasm and erythrocytes; v) false negatives are eliminated based on areas of predeined size; and vi) they use semi-automatic approaches to segmentation.
This paper proposes an automatic scheme for the segmentation and classiication of leukocytes (including their nuclei and cytoplasm), erythrocytes and blood plasma in microscopic images. Using only the green (G) channel of the RGB image, the three most signiicant peaks in the histogram of the G image are identiied based on their tonality. However, given that microscopic slide images have four regions of interest (leukocyte nuclei, leukocyte cytoplasm, erythrocytes and blood plasma) and the histogram contains only three well-deined regions, traditional segmentation methods using quantization and separation of regions based on gray levels are not suficient to correctly segment the leukocyte cytoplasm and erythrocytes. In addition to tonality, the proximitybetween each pixel and the centroid of the closest leukocyte nucleus is used to reine the classiication. To properly express these uncertain concepts and the relationship between them, we propose an approach based on fuzzy inference systems. Combining fuzzy logic with digital image processing techniques enables better reinement of the segmentation and classiication process.
Methods
In this study, 530 microscopic images of blood smears made with various hematologic stains were analyzed, classiied and segmented to identify and segment the leukocyte nuclei, leukocyte cytoplasm, erythrocytes and blood plasma.
On blood smear slides prepared for microscopic analysis, the blood plasma has a light color, the erythrocytes and leukocyte cytoplasm have intermediate colors, and the leukocyte nuclei have a dark color. Considering that leukocytes (with a density of 6000-9000/mm3 of blood) appear less frequently than
erythrocytes (with a density of 4.5-6.2 million/mm3
of blood) and that the area occupied by blood plasma is as large as or larger than the area occupied by erythrocytes, the histogram of a blood smear image often displays a peak in the dark region, representing the almost imperceptible leukocyte nucleus, and two other peaks representing blood plasma, erythrocytes and leukocyte cytoplasm, which are more visible. Despite the different densities of the blood components, the images in the present study all contain at least one leukocyte, several erythrocytes and signiicant areas of blood plasma.
For each image, the method comprises pre-processing, processing and post-processing stages.
In the irst stage, based on the histogram of the G channel, the image is pre-classiied to calculate the values that will be used to deine the support of the fuzzy sets for the tonality and proximity variables. The algorithm for this stage can be briely described as follows:
• Step 1: Extract the green channel of the RGB image (G).
• Step 2: Extract the G image histogram. • Step 3: Calculate the three most relevant
histogram peaks (DarkPeak, MediumPeak
and LightPeak), which will be used in the deinition of the linguistic variable tonality. • Step 4: Pre-classify the G image into three
regions according to the dark and light peaks (leukocyte nucleus ≤ DarkPeak, DarkPeak < foreground < LightPeak, and blood plasma ≥ LightPeak).
• Step 5: Calculate the centroids of the pre-classiied areas, such as the leukocyte nuclei, after performing closure and region-illing operations.
• Step 6: Calculate the Euclidean distance between the image pixels and the centroid of the nearest leukocyte nucleus (matrix D). • Step 7: Calculate the HighProx and LowProx
values, which will be used in the deinitions for the support of the fuzzy set for the proximity
variable.
In the next stage (processing), a fuzzy inference system classiies the pixels in each image region based on the linguistic input variables tonality and proximity, their respective membership functions and the fuzzy rule base. The stages of the algorithm are as follows:
• Step 1: Construction of the fuzzy linguistic variables tonality and proximity using the
DarkPeak, MediumPeak, LightPeak, HighProx
and LowProx values calculated in the pre-processing stage.
• Step 2: Fuzziication of matrix G based on the linguistic terms for tonality (dark, medium, and light) and their respective pertinence functions.
• Step 3: Fuzziication of matrix D based on the linguistic terms for proximity (high and low) and their respective pertinence functions. • Step 4: Application of the fuzzy rule base. • Step 5: Aggregation of outputs and
defuzziication of the fuzzy output variable
class (leukocyte cytoplasm, leukocyte nucleus, erythrocyte and blood plasma) using the mean-of-maximum method.
In the inal stage, post-processing, the classiied image is reined by removing erythrocytes erroneously classiied as leukocyte cytoplasm (i.e., false positives). Finally, the image is segmented. The stages of the algorithm are as follows:
• Step 1: Removal of false positives for leukocyte cytoplasm with RGB values corresponding to erythrocytes.
• Step 2: Elimination of small areas of leukocyte cytoplasm.
• Step 3: Filling of regions in the classiied areas.
• Step 4: Segmentation of leukocyte (nucleus and cytoplasm), erythrocyte and blood plasma regions in the original image according to their classiications.
MathWorks Matlab R2014a software (The MathWorks, Inc., 3 Apple Hill Drive, Natick, Massachusetts 01760 USA) was used to implement the stages of the model.
Pre-processing
to purple, whereas the R and B channels represent darker tones. Because the leukocyte nuclei and the blood plasma are always dark and light, respectively, regardless of the hematologic staining used in the sample, the three RGB color channels of the original
image
( )
3 ij n m
OI oi
× ×
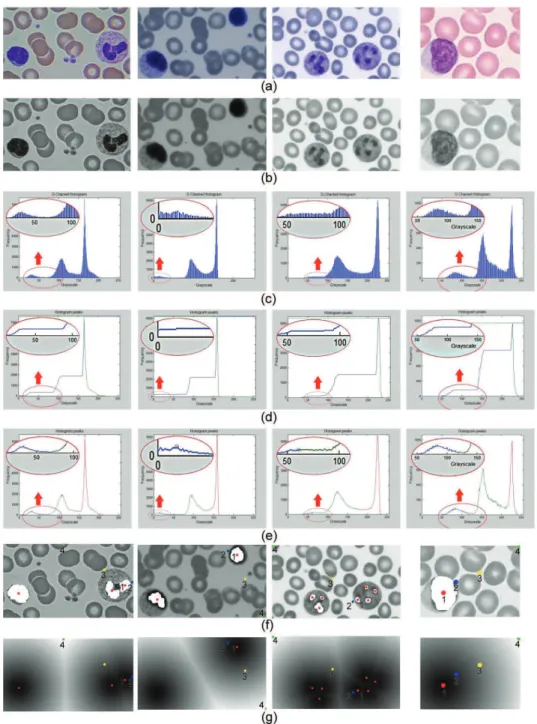
= (Figure 1a) are separated in the pre-processing stage, and only channel G
( )
gij n m× =
is considered (Figure 1b). The histogram of the G channel,
( )
2 256 ij
HG hg
×
= , is constructed (Figure 1c), and the three most signiicant peaks, DarkPeak,
MediumPeak and LightPeak, are calculated. To determine the three most signiicant peaks in the G channel histogram of the image, the histogram is initially considered as a 256-position vector, with
each position representing a gray level and containing the frequency of occurrence for that level among the pixels in the image. Each position in the vector is examined beginning from the irst position. If the frequency of the current position is higher than the frequency of the following position, the latter position is assigned the value of the former. Consequently, the highest frequency is repeated whenever there is a decrease in frequency in the histogram curve, indicating the occurrence of a valley (Figure 1d). The same procedure is repeated throughout the vector in the other direction (from the end) in case the third peak is smaller than the second. As a result, the most signiicant peaks will represent the three gray levels whose frequencies are most repeated (Figure 1e), with DarkPeak deined as the maximum frequency
between a gray level of 0 and the occurrence of the irst valley, MediumPeak as the maximum frequency between the irst and second valley and LightPeak as the maximum frequency between the second valley and a gray level of 255. These values are used to deine the support of the fuzzy set for the tonality
variable in the processing stage.
Considering the DarkPeak and LightPeak values as thresholds, the G channel is pre-classiied according to expression 1 to generate the matrix GC
( )
gcij n m× = , which contains regions identifying the areas of the image representing leukocyte nuclei, the foreground (i.e., neither nucleus nor plasma) and blood plasma, deined with values of 0, 126 and 255, respectively.
0, 126,
255,
ij
ij ij ij
ij
ifg DarkPeak gc ifg DarkPeak g LightPeak
ifg LightPeak
≤
= > ∧ <
≥
(1)
In the areas pre-classiied as representing a leukocyte nucleus, closing operations (dilation followed by erosion) are applied using a circular structuring element, and these regions are illed to join nearby objects that are disconnected. The centroid of the leukocyte nucleus (i.e., the center of mass), cpq, is then calculated (Figure 1f), and matrix D=
( )
dij n m×is constructed from the Euclidean distance between each pixel of the image and the centroid (Figure 1g) according to expression 2.
( ) (2 )2 ij
d = i−p + j−q (2)
The matrix DP
( )
dpij n m×
= containing the Euclidean distance between the pre-classiied pixels, such as those representing blood plasma, and the centroid of the leukocyte nucleus is then calculated according to expression 3.
0, 255 , 255 ij ij ij ij ifgc dp d ifgc < = ≥
(3)
If there is more than one leukocyte nucleus, more than one center will be calculated, and the Euclidean distance of any point will always be calculated relative to the leukocyte nucleus closest to it.
Finally, the HighProx and LowProx values are calculated. HighProx is deined as the minimum value
of matrix DP, indicating the blood plasma closest to a leukocyte nucleus. LowProx is deined as 1/3 of
the Euclidean distance between HighProx and the maximum value of matrix D. These values are used to deine the support of the fuzzy set for the proximity
variable in the processing stage (Figures 1f and 1g).
Processing: Fuzzy inference system
The processing stage consists of a fuzzy inference system using membership functions for the fuzziication of crisp data. From a set of well-deined fuzzy rules, the image is classiied into four distinct regions: leukocyte nuclei, leukocyte cytoplasm, erythrocytes and blood plasma. Each leukocyte in the image will result in regions classiied as leukocyte nucleus and leukocyte cytoplasm.
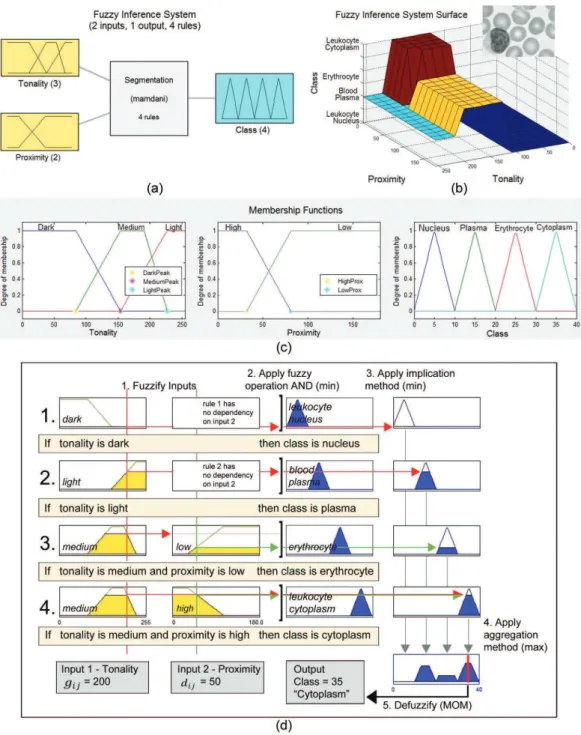
The blood components can be distinguished from each other in the sample images because of the different colors they exhibit after staining. Because this work focuses on the G channel of each sample, different shades of gray are used to identify the components. However, erythrocyte and leukocyte cytoplasm components have very similar shades of gray, and their appearance varies: erythrocytes will sometimes be darker than the leukocyte cytoplasm, and sometimes the reverse will occur, resulting in histograms with three well-deined regions (representing leukocyte nuclei, blood plasma and other elements) and a poorly deined and poorly positioned fourth region (representing erythrocytes and leukocyte cytoplasm). Consequently, in addition to gray levels, the proximity of the leukocyte cytoplasm to the leukocyte nucleus is also considered. This is a powerful method of identiication because erythrocytes are anucleate. A fuzzy approach is used that combines the imprecise grayscale information with proximity information to handle the uncertainty in the segmentation of the areas of interest. The inference system used is based on the three-stage method presented by Mamdani (1974), which includes fuzziication, inference procedures and defuzziication (Figure 2a), and classiies each image into four regions after the individual processing of each pixel (Figure 2b).
thereby inferring the corresponding fuzzy output value. Defuzziication is used to associate a crisp numerical value with the output fuzzy value obtained from the fuzzy inference procedure.
In the input to the inference system, each pixel has an associated gray level (gij) and Euclidean distance between the pixel and the centroid of the closest leukocyte nucleus (dij). These values are
fuzziied using pertinence functions (Figure 2c), the fuzzy rules are applied, the results are aggregated, and the inal value is defuzziied, thereby classifying the pixel according to the appropriate class (Figure 2d).
The proposed fuzzy inference system uses three linguistic variables, two input variables (tonality and
proximity) and one output variable (class).
Figure 2. a) Proposed fuzzy inference system; b) fuzzy inference system surface for an image; c) membership function for the image, with DarkPeak = 84, MediumPeak = 154 and LightPeak = 227 for tonality and HighProx = 31.82 and LowProx = 81.25 for proximity; and d) use
The input fuzzy linguistic variable tonality refers to the gray values in the G histogram of the image. Three linguistic terms are deined for tonality: dark, medium
and light. The supports of their respective fuzzy sets are represented by the values of the three most signiicant peaks found in the histogram in the pre-processing stage (DarkPeak, MediumPeak and LightPeak). Trapezoidal membership functions are deined for
dark, medium and light tonality in which more than one value assumes full membership. Any value below
DarkPeak has maximum membership in the dark tonality fuzzy set, and any value above LightPeak
has maximum membership in the light tonality
fuzzy set. Finally, any value between MediumPeak
and((LightPeak+ MediumPeak)/2)+ LightPeak) has maximum membership in the medium tonality fuzzy set. The universe of discourse is characterized by the values of the G channel.
The linguistic fuzzy input variable proximity
refers to the Euclidean distance of each pixel from the centroid of the nearest leukocyte nucleus. Two linguistic terms are deined for proximity: high and
low. The supports of their respective fuzzy sets are represented by the HighProx and LowProx values determined from the Euclidean distances in matrix D
in the pre-processing stage. Trapezoidal membership functions are deined for high proximity and low proximity. Any value below HighProx has maximum membership in the high proximity fuzzy set, and any value above LowProx has maximum membership in the low proximity fuzzy set. The universe of discourse is characterized by the values of matrix D.
The concepts used to deine the supports of the fuzzy sets for the tonality and proximity variables are well delimited, and the same deinitions apply irrespective of the image. However, the values resulting from the application of these concepts (DarkPeak,
MediumPeak, LightPeak, HighProx and LowProx), which represent the values used in the pertinence functions, are adaptive because they relect the application of the concepts to a speciic image, resulting in speciic values for each image.
The output variable class refers to the inal
classiication of the image after the fuzzy inference system is applied. Four fuzzy sets are deined: leukocyte nucleus, leukocytecytoplasm, erythrocyte and blood plasma.
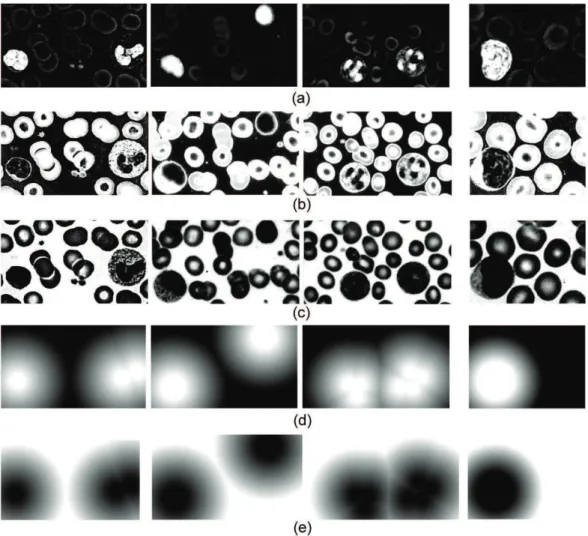
In the system input, matrices G and D are fuzziied
for each pixel, resulting in matrices containing the degree of membership of each element in the dark tonality (Figure 3a), mediumtonality (Figure 3b),
light tonality (Figure 3c), high proximity (Figure 3d) and low proximity (Figure 3e) fuzzy sets.
After the fuzziication process, the following fuzzy rules are applied to the fuzziied matrices:
• Rule 1: If tonality is dark then the class is
leukocytenucleus;
• Rule 2: If tonality is light then the class is
blood plasma;
• Rule 3: If tonality is medium and proximity
is low then the class is erythrocyte;
• Rule 4: If tonality is medium and proximity
is high then the class is leukocytecytoplasm.
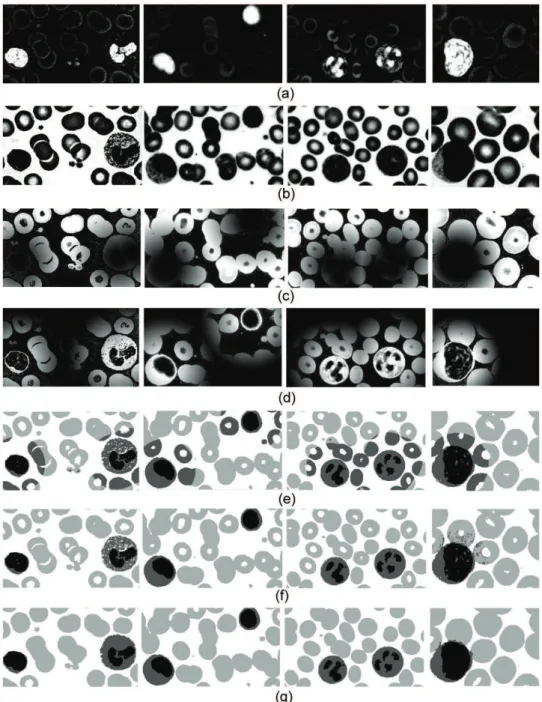
Aggregation of the class outputs is then performed (Figures 4a, 4b, 4c and 4d), and inally the result is defuzziied using the mean-of-maximum (MoM) method (Figure 4e). In this defuzziication method, a deterministic (i.e., not fuzzy) output is obtained by taking the mean of the two extreme elements in the universe corresponding to the highest values of the membership functions (i.e., the mean-maximum membership values). After defuzziication, the image is classiied into the four regions of interest: leukocyte nucleus, leukocyte cytoplasm, blood plasma and erythrocytes.
Post-processing
In the post-processing stage, reinements are made in the fuzzy classiication. First, regions classiied as
leukocytecytoplasm are veriied to determine whether
there are pixels whose RGB values are also present in a region classiied as erythrocyte. If so, this is a false positive for leukocytecytoplasm, and the pixel is classiied as erythrocyte (Figure 4f). Next, leukocyte cytoplasm regions with areas considered to be small (i.e., with areas of less than ¼ of the other regions) are eliminated, followed by a illing operation. Finally, in the original image OI, the leukocyte nucleus, leukocyte cytoplasm, erythrocyte and blood plasma classes are segmented according to their respective classiications (Figure 4g). The leukocyte class results from a join (AND) operation between the leukocyte nucleus and leukocytecytoplasm classes. This class is relevant because of the importance of the differential analysis of leukocytes and so that the segmentation results from the proposed method can be compared with results reported in the literature, which are usually presented for leukocyte segmentation as a whole and not individually for the leukocyte nucleus and leukocyte cytoplasm.
Results
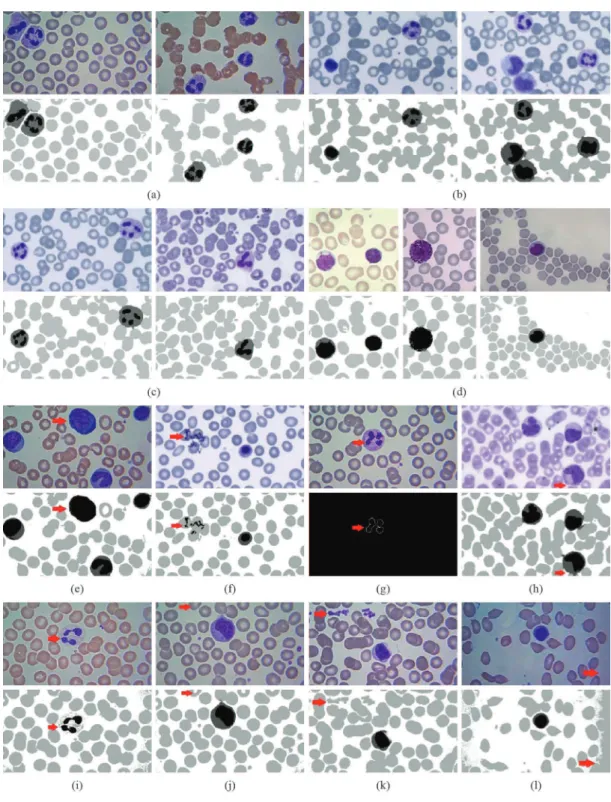
all types of leukocytes, and regions of adjacent leukocyte cytoplasm and erythrocytes. These regions exhibited different colors from sample to sample, making this set of heterogeneous images dificult to classify (Figure 5). The images were drawn from four groups: samples made using a well-deined staining process (G1, G2, G3) and samples made using an unspeciied staining process (G4).
The irst three groups (G1, G2 and G3), contained 415 images from the Hemocentro do Rio Grande do Norte Dalton Cunha (Hemonorte). The blood samples were prepared using standard blood smears that were ixed and analyzed using Fast Panoptic (G1; 150 images), Leishman (G2; 140 images) and Rosenfeld (G3; 125 images) stains. The images were captured using a Labomed LX 400 microscope (100X magniication) and an iVu 5100 camera coupled to the
microscope with a resolution of 96 pixels/inch and an image size of 1280 x 720 in the JPEG picture format.
The fourth group (G4) contained images from the BloodLine Image Atlas, available free of charge at http://image.bloodline.net/. Although this website offers more than 800 hematological slides depicting various blood disorders and malignancies, it was decided to use the 115 images containing normal blood to enable a more accurate comparison between this group and the others. Therefore, the images classiied as normal blood or from a dense or thin area were chosen. All images were captured at 100x magniication. Stains used in slide preparation that were visibly different from the others were considered unspeciied.
All images were segmented and compared with the results of manual segmentation performed and veriied by experts. The metrics used for comparison were the true positive (TP), false positive (FP), true
Figure 3. Fuzziication process (left to right, samples stained with Fast Panoptic, Leishman, Rosenfeld and unspeciied staining): a) fuzziication
negative (TN) and false negative (FN) rates. The accuracy (AC), as deined in Aghajari and Damayanti (2011), was also calculated as in expression 4.
( ) ( )
(
/ *100)
AC= TP TN+ TP+FN+TN+FP (4)
The results obtained in the comparative analyses using the fuzzy method presented here are shown in Table 1 and discussed below.
Discussion
The different groups of images processed in the study were used to demonstrate the automatic segmentation and classiication of blood components independent of the staining technique used on the samples (Figures 5a, 5b, 5c and 5d). High rates of TP and TN were obtained, indicating a high percentage of success in identifying the presence or absence,
Figure 4. Membership rules and post-processing (left to right, samples stained with Fast Panoptic, Leishman, Rosenfeld and unspeciied
staining): a) membership rule 1 – leukocytenucleus class; b) membership rule 2 – bloodplasma class; c) membership rule 3 – leukocyte cytoplasm class; d) membership rule 4 – erythrocyte class; e) output variable class; f) elimination of false positives for leukocyte cytoplasm;
respectively, of each component in the samples. The FP and FN rates represent the percentage of errors in identifying the presence or absence of a component when compared to the manual segmentation results.
A high level of accuracy was achieved in the classiication of blood components in the 530 images, especially the leukocytes, leukocyte nuclei and leukocyte cytoplasm, with a high percentage of correct results compared to errors in identifying these components. In the identiication of leukocyte nuclei, it was observed that the FP rate resulted from the similarity in the staining of the leukocyte nucleus and leukocyte cytoplasm in some samples (Figure 5e), which also increased the FN rate for leukocyte cytoplasm, and from the presence of artifacts derived during the preparation process (Figure 5f). The FN rate was due primarily to the failure to identify the edges of leukocyte nuclei visible in manual segmentation (Figure 5g). For leukocyte cytoplasm, FP errors were observed when erythrocytes adjacent to the leukocyte cytoplasm were incorrectly identiied (Figure 5h). FN errors occurred primarily as a result of the leukocyte cytoplasm staining process, in which, depending on the sample preparation and the time of exposure to
the reagent dye, the cytoplasm was sometimes not adequately stained (Figure 5i).
For erythrocyte classiication, the FN rate was a result of the region-illing operation, which did not perform properly for erythrocytes located at the edges of the images (Figure 5j). In such cases, the centers of the erythrocytes were incorrectly classiied as blood plasma, increasing the FP rate. The FP errors were due to the presence of platelets, which were not considered in the analysis (Figure 5k), artifacts and loss of focus of the microscope at the edges of the image (Figure 5l). In the latter case, blood plasma, which exhibited a darker tone, was incorrectly classiied as erythrocytes, increasing the FN rate.
Similar results were obtained for groups G1, G2 and G3 for leukocytes, erythrocytes and blood plasma, and there were minor variations in the leukocyte components (nucleus and cytoplasm) depending on the stain applied. Groups G1, G2, G3 produced similar results to G4, demonstrating a high degree of independence from the hematological staining technique used on the samples.
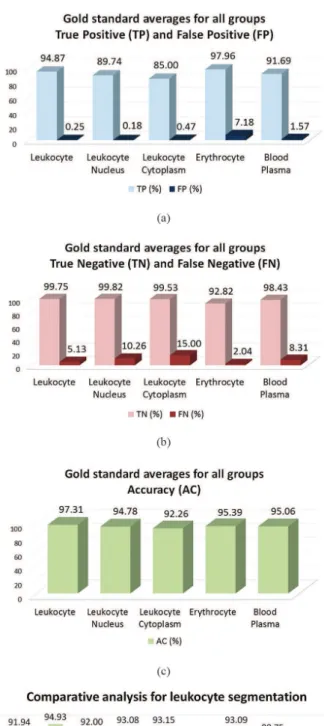
The TP, TN, FP, FN and AC rates obtained demonstrate the ability of the method to achieve the proposed goals (Figures 6a, 6b and 6c).
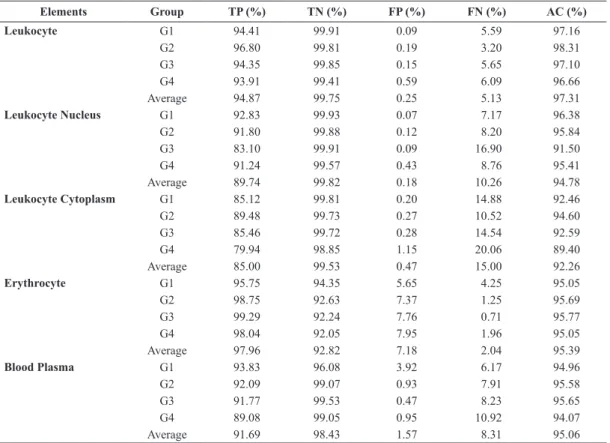
Table 1. Results obtained for the automatic detection of blood components in groups G1, G2, G3, G4 and the average of all groups as a percentage of the manual segmentation results: true positive (TP), true negative (TN), false positive (FP), false negative (FN) and accuracy (AC) rates.
Elements Group TP (%) TN (%) FP (%) FN (%) AC (%)
Leukocyte G1 94.41 99.91 0.09 5.59 97.16
G2 96.80 99.81 0.19 3.20 98.31
G3 94.35 99.85 0.15 5.65 97.10
G4 93.91 99.41 0.59 6.09 96.66
Average 94.87 99.75 0.25 5.13 97.31
Leukocyte Nucleus G1 92.83 99.93 0.07 7.17 96.38
G2 91.80 99.88 0.12 8.20 95.84
G3 83.10 99.91 0.09 16.90 91.50
G4 91.24 99.57 0.43 8.76 95.41
Average 89.74 99.82 0.18 10.26 94.78
Leukocyte Cytoplasm G1 85.12 99.81 0.20 14.88 92.46
G2 89.48 99.73 0.27 10.52 94.60
G3 85.46 99.72 0.28 14.54 92.59
G4 79.94 98.85 1.15 20.06 89.40
Average 85.00 99.53 0.47 15.00 92.26
Erythrocyte G1 95.75 94.35 5.65 4.25 95.05
G2 98.75 92.63 7.37 1.25 95.69
G3 99.29 92.24 7.76 0.71 95.77
G4 98.04 92.05 7.95 1.96 95.05
Average 97.96 92.82 7.18 2.04 95.39
Blood Plasma G1 93.83 96.08 3.92 6.17 94.96
G2 92.09 99.07 0.93 7.91 95.58
G3 91.77 99.53 0.47 8.23 95.65
G4 89.08 99.05 0.95 10.92 94.07
Figure 5. Examples of images before and after processing using the proposed method with a high level of independence from the hematological
staining technique used on the sample: a) Fast Panoptic (G1), b) Leishman (G2), c) Rosenfeld (G3) and d) unspeciied staining (G4). Examples
of images with negative results: e) FP for leukocyte nucleus and FN for leukocyte cytoplasm due to similarity in color; f) FP for leukocyte nucleus due to the presence of artifacts; g) FN for leukocyte nucleus due to an edge visible in manual segmentation; h) FP for leukocyte
cytoplasm due to adjacent erythrocytes; i) FN for leukocyte cytoplasm due to inadequate staining; j) FN for an erythrocyte due to location at
Figure 6. Mean percentages obtained for the performance metrics and accuracy of the proposed method in comparison to manual segmentation by experts: a) true positive (TP) and false positive (FP) rates; b) true negative (TN) and false negative (FN) rates; and c) accuracy (AC). Comparative analysis for leukocyte segmentation: d) comparative analysis of AC percentages obtained using the proposed method and methods reported in the literature for leukocyte segmentation ([1] proposed fuzzy system, [2] Zheng et al. (2014), [3] Jati et al. (2014) with noise, [4] Putzu and Ruberto (2013), [5] Ramesh et al. (2012), [6] Fatichah et al. (2012) for leukocyte nuclei, [7] Fatichah et al. (2012) for
leukocyte cytoplasm, [8] Rezatoighi and Soltanian-Zadeh (2011), [9] Ko et al. (2011) for leukocyte nuclei, [10] Ko et al. (2011) for leukocyte
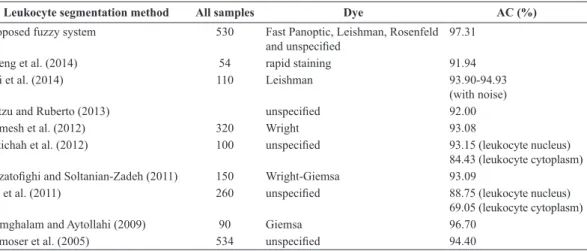
The mean accuracy results obtained for all components demonstrate the effectiveness of the approach, and when compared to other approaches for leukocyte segmentation using the same metrics (Figure 6d), it is also shown to be viable. When the results obtained with the proposed method are compared to those reported for other approaches in the literature, it can be observed that the former is equal or superior in terms of the number of samples processed and the diversity of the staining processes used for sample preparation (Table 2).
In general, the results achieved for all metrics in the comparative analyses were good, validating the use of the proposed method. The main contributions of the method described in this paper are as follows: (i) the ability to classify blood components with a high level of independence from the hematological staining technique used on the sample; (ii) automatic identiication of the supports of the fuzzy sets from the analyzed sample (which is not common in fuzzy logic; supports are often obtained heuristically); (iii) the deinition of a fuzzy descriptor based on proximity for the differentiation of leukocyte cytoplasm and erythrocytes, whose gray levels are similar; iv) the construction of adaptive fuzzy membership functions whose values change for each image; and v) image segmentation into four distinct regions based on histograms that show only three well-deined regions.
Future studies will involve enlarging the blood cell database and developing a fuzzy leukocyte identiication system to recognize different leukocyte types (i.e., neutrophils, eosinophils, basophils, lymphocytes, and monocytes) in microscopic images.
Acknowledgements
The authors wish to acknowledge the Electrical and Computer Engineering Graduate Program of
Table 2. Comparison of accuracy (AC) rates for leukocyte segmentation using the proposed fuzzy system and methods described in the literature.
Leukocyte segmentation method All samples Dye AC (%)
Proposed fuzzy system 530 Fast Panoptic, Leishman, Rosenfeld
and unspeciied 97.31
Zheng et al. (2014) 54 rapid staining 91.94
Jati et al. (2014) 110 Leishman 93.90-94.93
(with noise)
Putzu and Ruberto (2013) unspeciied 92.00
Ramesh et al. (2012) 320 Wright 93.08
Fatichah et al. (2012) 100 unspeciied 93.15 (leukocyte nucleus)
84.43 (leukocyte cytoplasm)
Rezatoighi and Soltanian-Zadeh (2011) 150 Wright-Giemsa 93.09
Ko et al. (2011) 260 unspeciied 88.75 (leukocyte nucleus)
69.05 (leukocyte cytoplasm)
Hamghalam and Aytollahi (2009) 90 Giemsa 96.70
Ramoser et al. (2005) 534 unspeciied 94.40
the Federal University of Rio Grande do Norte and Hemocentro do Rio Grande do Norte Dalton Cunha (Hemonorte).
References
Aghajari E, Damayanti G. Incorporating FCM and back
propagation neural network for image segmentation. International Journal of Computer and Communication Technology. 2011; 2(8):121-6.
Cox E. The fuzzy systems handbook: a practitioner’s guide to building, using, and maintaining fuzzy systems. 1st ed. New York: AP Professional; 1994.
Fatichah C, Tangel ML, Widyanto MR, Dong F, Hirota K. Interest-based ordering for fuzzy morphology on white blood cell image segmentation. Journal of Advanced Computational Intelligence and Intelligent Informatics. 2012; 16(1):76-86.
Guo N, Zeng L, Wu Q. A method based on multispectral imaging technique for white blood cell segmentation. Computers in Biology and Medicine. 2006;
37:70-6. PMid:163251637:70-6. http://dx.doi.org/10.1016/j.
compbiomed.2005.10.003
Hamghalam M, Ayatollahi A. Automatic counting of leukocytes in Giemsa-stained images of peripheral blood smear. ICDIP 2009: Proceedings of the International Conference on Digital Image Processing; 2009 Mar 7-9; Bangkok, TH. 2009. p. 13-6.
Jati A, Singh G, Mukherjee R, Ghosh M, Konar A,
Chakraborty C, Nagar AK. Automatic leukocyte nucleus segmentation by intuitionistic fuzzy divergence based thresholding. Micron. 2014; 58:55-65. PMid:24361233.
http://dx.doi.org/10.1016/j.micron.2013.12.001
Jiji GW, Ganesan L. A new approach for unsupervised
segmentation. Applied Soft Computing. 2010; 10(3):689-93.
http://dx.doi.org/10.1016/j.asoc.2008.06.002
Klir GJ, Folger TA. Fuzzy sets, uncertainty, and information. 1st ed. New Jersey: Prentice Hall; 1988.
low snake. Micron. 2011; 42:695-705. PMid:21530280. http://dx.doi.org/10.1016/j.micron.2011.03.009
Mamdani EH. Application of fuzzy algorithms for control of simple dynamic plant. Proceedings of the IEEE. 1974; 121(12):1585-8.
Nawgaje DD, Kanphade RD. Implementation of fuzzy
inference system for white blood cell cancer detection using DSP TMS320C6711. International Journal of Engineering Science and Technology. 2011; 3:123-7.
Putzu L, Ruberto C. White blood cells identiication and classiication from leukemic blood image. IWBBIO 2013:
Proceedings of the International Work-Conference on Bioinformatics and Biomedical Engineering; 2013 March 18-20; Granada, ES. 2013. p. 99-106.
Ramesh N, Dangott B, Salama ME, Tasdizen T. Isolation
and two-step classiication of normal white blood cells in
peripheral blood smears. Journal of Pathology Informatics. 2012; 3:13. PMid:22530181 PMCid:PMC3327044. http:// dx.doi.org/10.4103/2153-3539.93895
Ramoser H, Laurain V, Bischof H, Ecker R. Leukocyte
segmentation and classiication in blood-smear images.
Proceedings of the IEEE Engineering in Medicine and Biology Conference; 2005 Sept 1-4; Shanghai, CN. 2005. p. 3371-4. PMid:17280945
Rezatoighi SH, Soltanian-Zadeh H. Automatic recognition of ive types of white blood cells in peripheral blood.
Computerized Medical Imaging and Graphics. 2011;
35:333-43. PMid:21300521. http://dx.doi.org/10.1016/j.
compmedimag.2011.01.003
Sansone M, Zeni O, Esposito G. Automated segmentation
of comet assay images using gaussian iltering and fuzzy
clustering. Medical & Biological Engineering & Computing. 2012; 50(5):523-32. PMid:22402889. http://dx.doi. org/10.1007/s11517-012-0882-z
Tan KS, Isa NAM. Color image segmentation using histogram thresholding - fuzzy c-means hybrid approach. Pattern
Recognition. 2011; 44(1):1-15. http://dx.doi.org/10.1016/j.
patcog.2010.07.013
Wang X, Zhang X, Yang H, Bu J. A pixel-based color image segmentation using support vector machine and fuzzy c-means. Journal Neural Networks. 2012;
33:148-59. PMid:22647833. http://dx.doi.org/10.1016/j.
neunet.2012.04.012
Zadeh LA. Outline of a new approach to the analysis of complex systems and decision processes. IEEE Trans. on Systems Man and Cybernetics; 1973; 3:28-44. http://dx.doi. org/10.1109/TSMC.1973.5408575
Zheng X, Wang Y, Wang G, Chen Z. A novel algorithm based on visual saliency attention for localization and segmentation in rapidly-stained leukocyte images. Micron.
2014; 56:17-28. PMid:24148877. http://dx.doi.org/10.1016/j.
micron.2013.09.006
Authors
Alessandra Mendes Pacheco Guerra Vale*, Ana Maria Guimarães Guerreiro, Adrião Duarte Dória Neto, Geraldo Barroso Cavalvanti Junior, Victor Cezar Lucena Tavares de Sá Leitão, Allan Medeiros Martins