Mathematical models that do not take into account local measurements were developed to make the calculation of the concrete saturation degree easier, which is assumed to be an important factor in the diffusion coeficient of chloride ions inside concrete. Many studies have already proven the inluence of the saturation degree in the diffusion coeficient, and a proposed model enables the calculation of the ion diffusion coeficient, considering the variations of the saturation degree for each type of concrete. The models were developed based on a statistical analysis of the environmental variables affecting the variation of the saturation degree. As a conclusion of this study, ifteen models were developed based on the multiple linear regression, which estimate the seasonal average saturation degree of each type of concrete, leading to a maximum percentage error lower than 5%.
Keywords: diffusion coeficient, linear regression, models, maximum temperature.
Com o objetivo de facilitar o cálculo do grau de saturação do concreto, visto que é um fator inluente no coeiciente de difusão de íons cloreto no interior do concreto, foram elaborados modelos matemáticos que dispensam medições locais. Pesquisas concluídas comprovam a inluência do grau de saturação no coeiciente de difusão, e um modelo proposto viabiliza o cálculo do coeiciente de difusão de íons, considerando as varia-ções do grau de saturação para cada tipo de concreto. Os modelos foram elaborados através de análises estatísticas de variáveis ambientais que inluenciam na variação do grau de saturação. Como conclusão da pesquisa elaborou-se quinze modelos obtidos pela regressão linear múltipla, que estimam o grau de saturação médio sazonal de cada tipo de concreto, gerando um erro percentual máximo, inferior a 5%.
Palavras-chave: coeiciente de difusão, regressão linear, modelos, temperatura máxima.
Environmental variables in the concrete saturation
degree modelling
Variáveis ambientais na modelagem do grau
de saturação do concreto
M. G. T. PERAÇA a [email protected]
A. T. C. GUIMARÃES b [email protected]
H. C. PICCOLI c [email protected]
a Sul-rio-grandense Federal Institute, Mathematics Coordinaton Ofice, [email protected], Rua Maestro Bandeira 377, Bairro jardim – 96.055-650,
Pelotas-RS, Brazil;
b Federal University of Rio Grande, Department of Materials and Construction, Oceanic Engineering Post-Graduate Programme, [email protected],
Rua João Manoel 38, apto 701 - Bairro Cidade - 96.211-060, Rio Grande-RS, Brazil.
c Federal University of Rio Grande, Department of Materials and Construction, Oceanic Engineering Post-Graduate Programme, [email protected],
Rua Paulo Sérgio Pegas, 362, Cassino – 96.208-470, Rio Grande-RS, Brazil.
Received: 09 Sep 2009 • Accepted: 06 Mar 2011 • Available Online: 19 Aug 2011
Abstract
1.Introduction
Many studies have been undertaken to improve the techniques and materials used in concrete buildings. Few centuries ago, it was believed that concrete would have an ininite service life, and that a concrete building would never fail or suffer from environmental in-luences. However, this idea ended when the irst corrosion-related problems started to appear, which led to cracks and deterioration problems in need for repairs or even led to partial or total failure of large structures. Since then, engineers are engaged in under-standing this concrete deterioration process.
Based on past researches, it is possible to calculate, based on a model derived from the Fick’s second Law, Crank [2], the time at which the reinforcement of a concrete structure will start to be at-tacked by chloride ions and, hence, to be able to use prevention measures to make this attack more dificult.
This study dealt with concretes located in a mist region and, for this reason, they were considerably attacked by chloride ions present in the water droplets.
To obtain better results from the model described above, there is a need to measure the seasonal variations of the saturation degree (SD) to correlate them with the diffusion coeficient used in the model (Guimarães [3], Climent et al. [1], Nielsen e Geiker [10]). Two previous works allowed these measurements and provided data that allowed the studies on the factors inluencing the SD variation.
Guimarães [3] developed a method to measure the degree of satu-ration in concrete structures and Souza [11] determined, statisti -cally, the minimum periodicity of the measurements.
SD is one of the most decisive factors in the intensity of the ingress of chloride ions in concrete structures.
Recent studies proved the importance of taking into account the
SD inluence on the chloride diffusion in concrete structures lo-cated in maritime environments.
According to Guimarães and Helene [6] and Guimarães [9], there is a large difference between the chloride ingress depth assumed by deterministic models and the real value found in structures lo-cated in the south of Brazil, when the SD was not accounted for. Aiming to ind models that allow obtaining approximations for the values of SD, without the need for periodical measurements, the inluence of the environmental variables in the estimative of SD was studied and a group of mathematical models that allowed these approximations was obtained.
Hence, after Souza [11] conclusions, weekly measurements of SD had been carried out in the specimens used in his research for four more years, which led to the development of models capable of duplicating the SD values, with no need to measure them. SD is a measurement related with the humidity degree of the con-crete. This humidity starts in its outer layer, continuing towards its interior. As climate changes occur, the wet and dry process of the concrete starts. The aggressive agents that attack concrete (e.g. chlorides) penetrate through the outer layer of the concrete. Once inside the concrete, chlorides tend to dissipate until they reach and depassivate the steel bars. This triggers the deterioration process of the concrete.
By deinition, SD is the percentage of the pore solution volume by the total volume of pores. SD is deined by the percentage of the humidity degree of the specimen’s mass in relation to the water absorption after immersion and boiling. (Guimarães [7])
Previous studies proved the direct inluence of the concrete SD in the diffusion of chloride ions in the interior of the concrete. Some researchers that developed their studies on topics that contributed for the maintenance and durability of concrete, examining factors that stimulate the penetration of chloride ions into concrete and
Table 1 – Grading of fine aggregate
Sieves
Mass
(g)
retained
%
accumulated
%
NBR 7211
Number
(mm)
Size
Ideal
Acceptable
3/8"
9.5
--
-
--
-0.00
0.00
4
4.8
1.90
0.19
0.19
3 - 5.
0 - 3
8
2.4
34.50
3.45
3.64
29 - 43
13 - 29
16
1.2
166.70
16.67
20.31
49 - 64
23 - 49
30
0.6
360.20
36.02
56.33
68 - 83
42 - 68
50
0.3
353.00
35.30
91.63
83 - 94
73 - 83
100
0.15
73.30
7.33
98.96
93 - 98
88 - 93
200
0.075
8.90
0.89
99.85
< 3%
< 5%
Residue
1,50
0.15
100.00
-
-
Sum
1000
100
271.06
models to estimate the service life of reinforced concrete struc-tures, taking into account the inluence of SD in the chloride dif-fusion are: Climent et al. [1], Nielssen and Geiker [10], Vicente [13], Guimarães [3], Guimarães and Helene [5 and 6], Guimarães [7], Guimarães and Helene [8], Souza et al. [12], Souza [11], Gui -marães [9].
A calculation methodology for the SD was developed by Gui -marães [7], based on daily measurements of SD, undertaken throughout 2004. Souza et al. [12] concluded that only one weekly measurement of SD is enough to obtain the SD behaviour during a speciic season and, thus, to be able to estimate the seasonal average. With the seasonal average of SD, the model proposed by Guimarães [3] can be used to obtain the mean values of the dif -fusion coeficient per season and, thus, the mean annual dif-fusion coeficient of SD, that is, the diffusion coeficient considering the seasonal variation of SD.
The methodology used to measure SD requires a large availabil -ity of personnel as well as costs for materials. The methodology depends on the casting and measurements of mass of concrete specimens and calculations to obtain SD. Aiming to make the SD calculations easier and faster, this study aimed to elaborate math -ematical models to calculate SD of each type of concrete, through environmental variables inluencing the SD.
Since SD calculations are dificult, the models that estimate the service life of concrete (Crank [2]) and that do not take into account the SD inluence on the ion diffusion coeficient calculations, tend to lose their accuracy. This is another factor that this study aimed for: to be able to calculate with a better accuracy the service life of concrete structures or the cover depth necessary for a certain service life to be achieved for a speciic structure.
2. Materials
The materials used in this study are presented as follows. The characterisation of the materials is shown in tables 1, 2, 3 and 4. These parameters were obtained from a previous study under-taken by Souza [11], where they were compared with the values of SD.
Table 2 – Grading of coarse aggregate
Sieve
size
(mm)
Mass
r
etained
(g)
Percentage by mass
Retained
accumulated
Retained
76.00
0
0.00
0.00
50.00
0
0.00
0.00
38.00
0
0.00
0.00
25.00
0
0.00
0.00
19.00
1064.4
10.64
10.64
9.50
7695.2
76.95
87.60
4.80
1045.1
10.45
98.05
2.40
0
0.00
98.05
1.20
0
0.00
98.05
0.60
0
0.00
98.05
0.30
0
0.00
98.05
0.15
0
0.00
98.05
residue
195.3
1.95
-Total
10000
100.00
686.52
Apparent specific weight (kg/l)
1.25
Absolute specific weight (kg/l)
2.62
Maximum diameter (mm)
19
Fineness modulus
6.87
Table 3 – Mix proportions, slump test results and specific mass of fresh concrete
Concrete
Mix proportion
(c : fa : ca : w/c)*
Slump
(cm)
Specific mass of
fressh concrete
3
(kg/m )
Cement content
3
(kg/m )
Mix 1 (1:5:0.54)
1 : 2.12 : 2.88 :0.54
11
2350
359
Mix 2 (1:4:0.45)
1 : 1.60 : 2.40 : 0.45
11
2285
419
Mix 3 (1:6:0.63)
1 : 2.64 : 3.36 : 0.63
11
2325
304
Mix 4 (1:4:0.54)
1 : 1.60 : 2.40 : 0.54
22
2275
411
Mix 5 (1:6:0.54)
1 : 2.64 : 3.36 : 0.54
1,2
2325
308
Cement – Type CP IV 32 from Votorantin
Fine aggregate – quartz origin sand with grading according to table 1
Coarse aggregate – granite origin crushed aggregate with grad-ing accordgrad-ing to table 2
Potable water
3. Methodology
With the material, ive mix proportions were used: three mixes with same consistency and different w/c ratio; three mixes with the same w/c ratio and different consistencies, being one of the mixes common to both families of mixes. All mixes have the same mortar ratio of 52%. Table 3 shows the mix proportions, the slump test re -sults and the speciic mass of the fresh concrete. Table 4 presents the compressive strength at 28 and 60 days of the mixes.
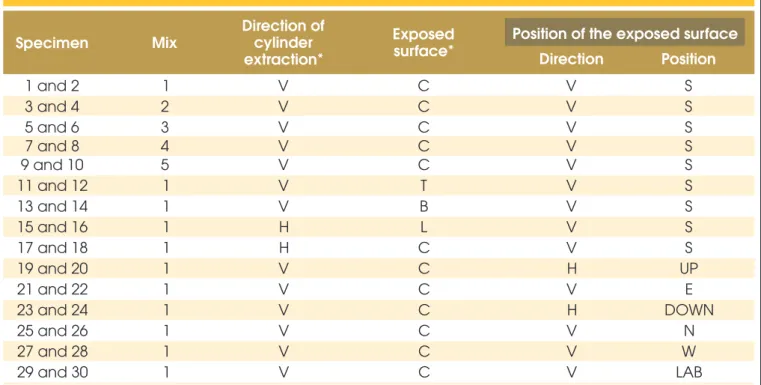
Thirty concrete specimens were cast, leading to ifteen families of concrete with two specimens each. These specimens were cut (see igure 1) from 2 different cylinders of 10 cm in diameter. A disc saw was used to cut the specimens, which is usually found in concrete laboratories. The specimens were extracted from two directions (vertical and horizontal), of concrete blocks, as shown in igure 1. These slices originated thirty cylinders measuring 10 cm in diameter and 4 cm in height, which is approximately the same as the cover of steel bars. The specimens were covered with two layers of silicon, except in one of surfaces, according to the casting surface of the specimen. The dry mass of the specimens was mea-sured prior and after to the application of the silicon layers. Once the exposure environment for the specimens was chosen, a frame made of timber and polystyrene was constructed aiming to hold the specimens, and allowing the non-covered surfaces to be par-tially exposed to the natural environment. The exposure surfaces were chosen by the researchers at the beginning of the study, and are shown in igure 2.
Each pair of specimens was installed together in the frame (made with timber to expose specimens), being one specimen with a hu -midity degree considerably low and the other considerably high. The SD measurements were only taken into account when both speci -mens had a similar SD value, in equilibrium with the environment. From the thirty specimens, they were extracted in pairs from the same direction, to calculate their average variations of SD. In total, 15 families of specimens were examined, varying the extraction position, the mix proportion and the exposure in natural
environ-Table 4 – Compressive strength (MPa)
Mix
Strength
Mean strength
at 28 days
at 28 days
Mean strength
at 60 days
1
29.37
29.63
35.88
29.90
2
32.30
32.85
38.48
33.40
3
27.80
27.80
30.33
27.80
4
28.60
30.05
36.56
31.50
5
33.70
33.70
39.16
36.00*
* Not accounted due to the 60 days results
Figure 1 – Preparation of specimens: extraction
and cutting of cylinders (Souza, [10])
ment. The measurements were carried out in pre-set dates and times, even in rainy days.
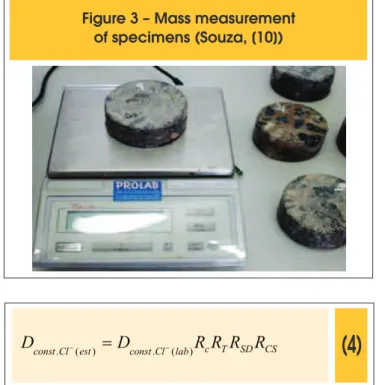
Table 5 summarizes the identiication of specimens per family. Once a week, the daily mass of each specimen was measured by a digital scale, as shown in igure 3. The dry initial mass of each speci-men was also measured. Guimarães [7] established a methodology to measure SD of concrete, as shown in equations 1 and 2.
(1)
100
max
´
=
A
A
GS
d(2)
100
´
-=
dry dry d
d
M
M
M
A
Ad = daily absorption Amax = maximum absorption
Md = daily mass Mdry = dry mass
It is important to calculate SD due to the fact that it influences on the variation of the diffusion coefficient of chloride ions in the interior of the concrete. The diffusion coefficient of ions, however, is a variable in the equation that estimates the
ser-vice life of concrete structures.
Crank [2] presents the following solution for the Fick’s second Law, which estimates the service of concrete, for a constant diffusion coeficient.
(3)
t
D
z
C
cl=
2
(
)
const.Cl-´
Ccl = depth in mm
Dconst.Cl- = effective coeficient of diffusion or diffusivity of concrete,
in cm2/year
t = service life, in years
z = Gaussian error function
The fact that the Crank [2] model does not take into account some factors inluencing the diffusion coeficient, leads to an error in its result and to a lack of accuracy in the estimative. The SD factor is not commonly used in service life models. Since it is already known the importance of SD, this work aims to make easier its calculation for further consideration in the Crank’s [2] model. For that, the dif-fusion coeficient proposed by Guimarães [3] is used, which con-siders the inluence of the type of cement (Rc), mean temperature per season (RT), saturation degree (RSD) and the position of the at -tack surface in relation to the casting surface (RCS) on the diffusion coeficient of the concrete.
Table 5 – Identification of specimens
Specimen
Mix
Direction of
cylinder
extraction*
Exposed
surface*
Position of the exposed surface
Direction
Position
1 and 2
1
V
C
V
S
3 and 4
2
V
C
V
S
5 and 6
3
V
C
V
S
7 and 8
4
V
C
V
S
9 and 10
5
V
C
V
S
11 and 12
1
V
T
V
S
13 and 14
1
V
B
V
S
15 and 16
1
H
L
V
S
17 and 18
1
H
C
V
S
19 and 20
1
V
C
H
UP
21 and 22
1
V
C
V
E
23 and 24
1
V
C
H
DOWN
25 and 26
1
V
C
V
N
27 and 28
1
V
C
V
W
29 and 30
1
V
C
V
LAB
(4)
CSSD T c lab Cl const est
Cl
const
D
R
R
R
R
D
. -( )=
. -( )Dconst.Cl-(est) = diffusion coeficient considering the exposure condi
-tions in the micro environment
Dconst.Cl-(lab) = diffusion coeficient obtained in laboratory in saturated
concrete condition (SD = 100%)
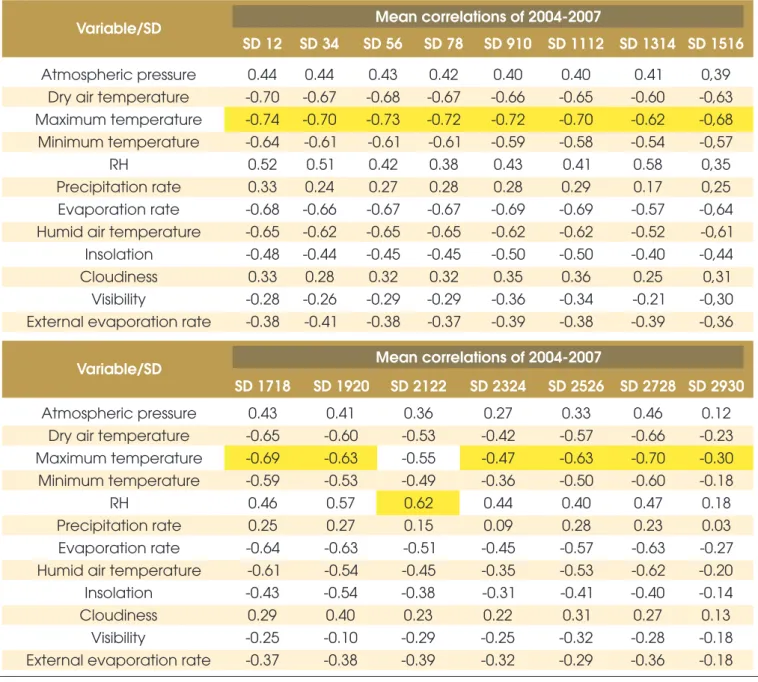
The objective of this study is to investigate SD through envi-ronmental variables. For that, it was considered as a hypoth-esis that each environmental variable influences in a more or less significant way the SD of concrete. Aiming to not take into account the less significant variables, a statistical study was undertaken by measuring the linear correlation coefficients between the analysed variables and the SD. The analysed variables were: atmospheric pressure, dry air temperature, maximum temperature, minimum temperature, relative humid-ity, precipitation rate, internal evaporation rate (Pichê), humid air temperature, insolation hours, cloudiness, visibility and ex-ternal evaporation rate.
In the first statistical analysis, it could be verified that the vari-able showing the highest correlation was the maximum tem -perature (MT), except for the family 2122 (family of specimens 21 and 22), even though MT was the second highest correla -tion. Table 6 shows the results for this analysis for all families of concrete.
A seasonal average of SD for each family of concrete is con-sidered in the model proposed by Guimarães [3] to calculate the diffusion coefficient of chloride ions. Therefore, since the linear correlation is high for the MT variable, simple linear re-gression models were developed for all these families, as a function of the average MT for each season. The model returns the average seasonal SD for each family of concrete.
Table 7 presents the models developed by simple linear re -gressions and their correlation coefficients (R).
To investigate the behaviour of the model regarding the SD response, it was examined the measurements of a new sample
of SD (seasonal average of measurements) with the values obtained in the models.
For the research to continue, it was investigated the signifi -cance of other environmental variables for the development of models obtained through multiple linear regression. It is impor -tant to note that a variable is taken as significant in the model if the p value (significance test) is lower than 5% (0.05).
The modelling was elaborated by mathematical computational programmes that calculate the coefficients of the independent variables, the intercept coefficient and the significances of the used variables in relation to SD. The results are matrix models including sum and multiplication of matrixes.
4. Results and discussions
The highest absolute error found in the simple linear regres-sion model was 2.73 units, which corresponds to a percentage error of 4.24% in relation to the local measurement, for the family 1920 (family of specimens 19 and 20).
The results of a second analysis with the multiple linear re-gression model indicate that a second variable, in the majority of the cases the relative humidity – RH, increases the correla-tion coefficient of the models, helping to explain the SD values obtained in the models.
Table 8 shows the models obtained by the multiple linear re -gression, the values of the correlation coefficient (R) and the results of the significance test (p) for each variable used in the model.
It is important to note that, for the family 1516 (family of speci -mens 15 and 16), the independent variables used were MT and internal evaporation rate (IER), for the family 2930 (family of specimens 29 and 30) were MT and the humid air tempera-ture (HAT) and for the other families were MT and RH. The same analysis of the model behaviour undertaken for the simple linear regression was carried out for the models of mul-tiple linear regression analysis. The highest calculated absolute error was of 2.47 units, which corresponds to a percentage error of 3.83% for the family 1920 (family of specimens 19 and 20). The fact that a second variable have increased the correlation coefficient of the model, what can be observed by comparing tables 7 and 8, indicates that the multiple linear regression is better adjusted to the proposed objective, leading to a maxi-mum percentage error lower than 5%.
The lowest correlation coefficients calculated are referent to the specimens with the surface turned up, lateral or down or to the specimens exposed to laboratory conditions. Not-withstanding, the multiple linear regression model generated better results.
To develop the models, it was investigated a possible time shift of SD in response to the environmental variables. Once veri-fied that there was not a shift higher than 24 hours, it was not necessary to adjust time in the models.
Since the multiple linear regression model adjusted better to the proposed objective, this model was utilised as a standard for a guide that can be consulted in the design of SD for each type of concrete structure. Table 9 shows this guide.
It was not possible to compare the results obtained with other studies, since it was not found references of models for the calculation of SD through environmental variables. New
els are being studied for high initial strength concretes, thus allowing a future comparison of results.
5. Conclusions
The main conclusion of this research was the possibility to adjust two models, one originated from a simple linear regression and another from a multiple linear regression, to obtain with good ac-curacy the values of mean SD in the seasonal periods, for concrete with pozzolanic cement for structures located in maritime zone, in the south of Brazil.
There is an indication that the use of the models may reduce
per-sonnel and material costs spent for the local measurements of SD. Once deined the type of concrete used in a structure as well as its position in relation to the exposure surface, the most appropriate model to calculate the mean SD for the four seasons can be cho-sen. After this calculation is performed, the result obtained from the model proposed by Guimarães [3] is used to determine the corre -sponding diffusion coeficient. This coeficient as well as the values of other variables are input data for Crank’s [2] model based on the second Fick’s Law to estimate the service life of concrete structures. Moreover, it can be concluded that there is no time shift higher than 24 hours in the response of SD to the maximum temperature, rela-tive humidity, internal evaporation rate and humid air temperature.
Table 6 – Correlations of concrete families with environmental variables
Mean correlations of 2004-2007
Variable/SD
SD 12
SD 34
SD 56
SD 78
SD 910
SD 1112
SD 1314
SD 1516
Atmospheric pressure
0.44
0.44
0.43
0.42
0.40
0.40
0.41
0,39
Dry air temperature
-0.70
-0.67
-0.68
-0.67
-0.66
-0.65
-0.60
-0,63
Maximum temperature
-0.74
-0.70
-0.73
-0.72
-0.72
-0.70
-0.62
-0,68
Minimum temperature
-0.64
-0.61
-0.61
-0.61
-0.59
-0.58
-0.54
-0,57
RH
0.52
0.51
0.42
0.38
0.43
0.41
0.58
0,35
Precipitation rate
0.33
0.24
0.27
0.28
0.28
0.29
0.17
0,25
Evaporation rate
-0.68
-0.66
-0.67
-0.67
-0.69
-0.69
-0.57
-0,64
Humid air temperature
-0.65
-0.62
-0.65
-0.65
-0.62
-0.62
-0.52
-0,61
Insolation
-0.48
-0.44
-0.45
-0.45
-0.50
-0.50
-0.40
-0,44
Cloudiness
0.33
0.28
0.32
0.32
0.35
0.36
0.25
0,31
Visibility
-0.28
-0.26
-0.29
-0.29
-0.36
-0.34
-0.21
-0,30
External evaporation rate
-0.38
-0.41
-0.38
-0.37
-0.39
-0.38
-0.39
-0,36
Mean correlations of 2004-2007
Variable/SD
SD 1718
SD 1920
SD 2122
SD 2324
SD 2526
SD 2728
SD 2930
Atmospheric pressure
0.43
0.41
0.36
0.27
0.33
0.46
0.12
Table 7 – Models obtained by simple linear regression
R = 0.7351
SD = -0.7122MT + 76.138
12R = 0.6867
S
D
1718= -0.6432MT + 78.270
R = 0.7039
S
D
34= -0.6124MT + 74.50
R = 0.6337
S
D
1920= -0.6104MT + 73.579
R = 0.7262
S
D
56= -0.7861MT + 78.906
R = 0.5531
S
D
2021= -0.6190MT + 73.655
R = 0.7178
S
D
78= -0.7461MT + 81.244
R = 0.4747
S
D
2324= -0.2236MT + 52.195
R = 0.7171
S
D
910= -0.6623MT + 70.901
R = 0.6331
S
D
2526= -0.5519MT + 73.595
R = 0.7048
S
D
1112= -0.6736MT + 71.899
R = 0.7039
S
D
2728= -0.7793MT + 74.031
R = 0.6220
S
D
1314= -0.3999MT + 61.701
R = 0.2970
S
D
2930= -0.1126MT + 46.664
R = 06761
S
D
1516= -0.7536MT + 78.466
Finally, table 9 can be used as a guide of models that can be con -sulted for the calculation of SD in each type of concrete structure, in the analysed region.
This study has its limits in the South of Brazil, in a mist zone, en-suring local results only, and a new study is necessary to use the models in other regions.
6 Acknowledgements
To the Federal University of Rio Grande, for providing the structure and qualiied professionals for the development of projects and works in the various research areas.
To the Oceanic Engineering Post-Graduate Programme, for the professionalism and commitment with the proposed and under-taken work.
To CAPES, for the inancial support and encouragement to the research.
To Prof. Natália Pereira, for allowing access to the meteorological database used in this study.
7 References
[01] CLIMENT, M. A. et al. Transport of chlorides through non saturated concrete after an initial limited chloride supply. In: Workshop of RILEM Testing and Modelling Chloride Ingress into Concrete, Paris, 2002.
[02] CRANK, J. The Mathematics of Diffusion, New York: Oxford University Press, 1975.
[03] GUIMARÃES, A. T. C. Vida útil de estruturas de concreto armado em ambiente marítimo. Tese (Doutorado em Engenharia Civil). USP - Escola Politécnica da Universidade de São Paulo, São Paulo,
2000, p. 7-75, 181-224. In Portuguese.
[04] GUIMARÃES, A. T. C. and HELENE, P. R. L. Difusão de cloretos e a inluência do grau de saturação do concreto: ensaio em laboratório e medição de obra de uso. In: Boletim Técnico da Escola Politécnica da USP, São Paulo, 2000. In Portuguese.
[05] GUIMARÃES, A. T. C. and HELENE, P. R. L. Chloride diffusion and the inluence of the saturation degree on the concrete. In: Workshop TC 178 TMC Chlorides 56th RILEM Annual Week 2002, Madrid, 2002, v.1. p. 47-56.
[06] GUIMARÃES, A. T. C. and HELENE, P. R. L. Inluence of the saturation degree of concrete on chloride diffusion: laboratory and ield tests in marine structure 22-year-old. In: High-Performance Concrete, Performance and Quality of Concrete Structure, Third International Conference, editors: V.M. Malhotra, Paulo Helene, Enio Figueiredo, Armando Carneiro, Recife, 2002-b, p. 169-192.
[07] GUIMARÃES, A. T. C. Grau de saturação: sua variação com o tipo de concreto e sua infuência na difusão de íons cloreto. Monograia
(Pós-Doutorado em Engenharia Civil). USP - Escola Politécnica da Universidade de São Paulo, São Paulo, 2005. In Portuguese.
[08] GUIMARÃES, A. T. C. and HELENE, P. R. L. Models of variation of chloride ion diffusion as a function of changes in the saturation degree (SD) of concrete mixes prepared with Pozzolanic cement. In:
Table 8 – Models obtained by multiple linear regression
[
] [
]
úû
ù
êë
é
-´ + = 0.17501 0.60695 RH MT 59.648 12 MR=0.7797;
p
MT=
2.75E-26
;
p
RH=
6.9E-08
[
] [
]
úû
ù
êë
é
-´ + = 0.13775 0.56039 RH MT 65.29077 1718 MR=0.7188;
p
MT=
3.47E-21
;
p
RH=
5.643-05
[
] [
]
úû
ù
êë
é
-´ + = 0.15607 0.51848 RH MT 59.794 34 MR=0.7499;
p
MT=
1.21E-22
;
p
RH=
3.52E-07
[
] [
]
úû
ù
êë
é
-´ + = 0.23264 0.47042 RH MT 51.659 1920 MR=0.7231;
p
MT=
8.47E-16
;
p
RH=
1.3E-10
[
] [
]
úû
ù
êë
é
-´ + = 0.11355 0.71778 RH MT 68.207 56 MR=0.7417;
p
MT=
7.49E-26
;
p
RH=
0.0026
[
] [
]
úû
ù
êë
é
-´ + = 0.34638 0.41065 RH MT 41.01789 2122 MR=0.7104;
p
MT=
7.1E-10
;
p
RH=
4.18E-15
[
] [
]
úû
ù
êë
é
-´ + = 0.08247 0.69650 RH MT 73.47328 78 MR=0.7269;
p
MT=
2.23E-25
;
p
RH=
0.025
[
] [
]
úû
ù
êë
é
-´ + = 0.092734 0.16777 RH MT 43.45735 2324 MR=0.5529;
p
MT=
2.78E-07
;
p
RH=
7.67E-06
[
] [
]
úû
ù
êë
é
-´ + = 0.10689 0.59804 RH MT 60.82999 910 MR=0.7363;
p
MT=
1.09E-24
;
p
RH=
0.001
[
] [
]
úû
ù
êë
é
-´ + = 0.10411 0.48927 RH MT 63.78509 2526 MR=0.6560;
p
MT=
4.76E-17
;
p
RH=
0.002
[
] [
]
úû
ù
êë
é
-´ + = 0.09742 0.61501 RH MT 62.71975 1112 MR=0.7198;
p
MT=
1.36E-23
;
p
RH=
0.0047
[
] [
]
úû
ù
êë
é
-´ + = 0.16561 0.67968 RH MT 58.42597 2728 MR=0.7362;
p
MT=
7.18E-2
;
p
RH=
2.67E-05
[
] [
]
úû
ù
êë
é
-´ + = 0.16548 0.30037 RH MT 46.10837 1314 MR=0.7242;
p
MT=
8.46E-15
;
p
RH=
9.72E-12
[
] [
]
úû
ù
êë
é
-´ + = 0.42559 0.46501 HAT MT 47.74959 2930 MR=0.4086;
p
MT=
4.13E-07
;
p
HAT=
4.91E-05
[
] [
]
úû
ù
êë
é
-´ + = 0.99674 0.49714 IER MT 76.05208 1516 MR=0.7098;
p
MT=
2.07E-08
;
p
IER=
5.09E-05
[09] GUIMARÃES, A. T. C. Transporte de íons cloreto no concreto: inluência do grau de saturação. In: PATORREB: 3º Encontro sobre Patologia e
Reabilitação de Edifícios/3º Congresso de Patologia
y Rehabilitación de Edifícios, Porto, 2009, p. 27-32. In Portuguese.
Table 9 – Guide of appropriate models for each type of concrete
[
] [
]
úû
ù
êë
é
-´ + = 0.34638 0.41065 RH MT 41.01789 2122 M[
] [
]
úû
ù
êë
é
-´ + = 0.10411 0.48927 RH MT 63.78509 2526 M[
] [
]
úû
ù
êë
é
-´ + = 0.16561 0.67968 RH MT 58.42597 2728 M[
] [
]
úû
ù
êë
é
-´ + = 0.092734 0.16777 RH MT 43.45735 2324 M[
] [
]
úû
ù
êë
é
-´ + = 0.42559 0.46501 HAT MT 47.74959 2930 MStructures
Type of concrete
(Pozzolanic)
Model
Subjected to
weather
Mix 1, with surface
exposed to south and
w/c 0.54
[
] [
]
úû
ù
êë
é
-´ + = 0.17501 0.60695 RH MT 59.648 12 MMix 2, with surface
exposed to south and
w/c 0.45
[
] [
]
úû
ù
êë
é
-´ + = 0.15607 0.51848 RH MT 59.794 34 MMix 3, with surface
exposed to south and
w/c 0.63
[
] [
]
úû
ù
êë
é
-´ + = 0.11355 0.71778 RH MT 68.207 56 MMix 4, with surface
exposed to south and
w/c 0.54
[
] [
]
úû
ù
êë
é
-´ + = 0.08247 0.69650 RH MT 73.47328 78 MMix 5, with surface
exposed to south and
w/c 0.54
[
] [
]
úû
ù
êë
é
-´ + = 0.10689 0.59804 RH MT 60.82999 910 MMix 1, with up surface
exposed and w/c 0.54
=[
] [
+]
´êë
é
-0.23264úû
ù
0.47042 RH MT 51.659 1920 M
Mix 1, with surface
exposed to east and
w/c 0.54
Mix 1, with surface
exposed to north and
w/c 0.54
Mix 1, with surface
exposed to west and
w/c 0.54
Covered and open
Mix 1, with down surface
exposed and w/c 0.54
Dry interiors
Mix 1 and w/c 0.54
Cement and Concrete Research, 2003; p. 133-138. [11] SOUZA, K. N. Estudo experimental e probabilístico
da vida útil de estruturas de concreto armado situadas em ambiente marítimo: inluência do grau de saturação do concreto sobre a difusividade de cloretos. Dissertação (Mestrado em Engenharia Oceânica). FURG - Universidade Federal do
Rio Grande, Rio Grande, 2005. In Portuguese. [12] SOUZA, K. N., GUIMARÃES A. T. C., ALMEIDA,
T. L. and HELENE, P. R. L. Um método de medição do grau de saturação em estruturas de concreto. In: Teoria e Prática na Engenharia Civil, 2005,


![Figure 2 – Variation in the position of specimens exposed to natural environment (Souza, [10])](https://thumb-eu.123doks.com/thumbv2/123dok_br/18859747.417710/4.892.62.436.723.1126/figure-variation-position-specimens-exposed-natural-environment-souza.webp)

![Table 8 – Models obtained by multiple linear regression [ ] [+ ] ´ êëé - úûù=0.175010.60695RH MT59.648M12 R=0.7797; p MT =2.75E-26; p RH =6.9E-08 [ ] [+ ] ´ êëé - úûù=0.137750.56039RH MT65.29077M1718R=0.7188; pMT=3.47E-21; pRH =5.643-05 [ ] [+ ] ´ êëé](https://thumb-eu.123doks.com/thumbv2/123dok_br/18859747.417710/9.892.68.826.251.1157/table-models-obtained-multiple-linear-regression-êëé-úûù.webp)
![Table 9 – Guide of appropriate models for each type of concrete [ ] [+ ] ´ êëé - úûù=0.346380.41065RH MT41.01789M2122 [ ] [+ ] ´ êëé - úûù=0.104110.48927RH MT63.78509M2526 [ ] [+ ] ´ êëé - úûù=0.165610.67968RH MT58.42597M2728 [ ] [+ ] ´ êëé - úûù=0.0](https://thumb-eu.123doks.com/thumbv2/123dok_br/18859747.417710/10.892.69.827.334.1033/table-guide-appropriate-models-concrete-êëé-úûù-êëé.webp)
