The main goal of this work is to investigate the nonlinear behavior of concrete block masonry prisms under compression, with an emphasis in the prism deformability and the failure modes. A total of 18 stack-bonded prisms have been tested, using hollow blocks of a single geometry and two different mortar types. To investigate the effect of vertical joints, the bond pattern – stack and running bond – in the prism was varied, by using half units. Finite element analysis of hollow masonry prisms was done utilizing a commercial non-linear inite element code DIANA. The numerical simulation were car -ried out using non-linear two dimensional 8-node elements and the biaxial stress state material was modeled by a combination of the yield conditions of Rankine and Drucker-Prager. The numerical and experimental results were compared to validate the ability to predict deformation and peak load. The results show that an analytical model cannot be formulated without understanding the interaction between block and mortar. It was observed that: the non-linearities of the masonry correspond to an increase in the lateral strain due to extensive cracking of the material and a progressive increase in the ratio between lateral and axial strains.; the cracks in the three block stacked prisms constructed with a stronger mortar were vertical on both sides; the prisms constructed with a weaker mortar had, as a consequence of localized crushing, also vertical cracks due to stress concentration at some points; the presence of a vertical joint in the prism led to the appearance of separation cracks between the middle block and the vertical mortar joint.
Keywords: concrete blocks, structural masonry, failure mode, compression behavior.
O principal objetivo deste trabalho é investigar o comportamento não linear de prismas de blocos de concreto a compressão, com ênfase na deformabilidade e modo de ruptura. Um total de dezoito (18) prismas com blocos sobrepostos foram testados, usando blocos vazados com uma única geometria e dois traços de argamassa. Para investigar o efeito da junta vertical utilizaram-se dois meios blocos na junta intermediária dos prismas. Utilizou-se o programa comercial DIANA para simular em elementos initos o comportamento da alvenaria estrutural. As simulações numéricas foram realizadas usando um elemento bidimensional de oito (8) nós e o estado biaxial de tensões do material foi modelado pela com -binação das condições de Rankine e Drucker-Prager. Foram comparados os resultados numéricos e experimentais para validar a capacidade de prever as deformações e a carga última do conjunto. Pode se perceber pelos resultados que um modelo analítico não pode ser formulado sem um entendimento das interações entre o bloco e argamassa. Foi observado que a não linearidade da alvenaria correspondeu a um aumento nas deformações laterais devido à extensiva issuração do material e a um progressivo aumento nas proporções entre a deformação lateral e axial; as issuras nos prismas de três blocos construídas com argamassa forte foram verticais em ambos os lados; os prismas construídos com argamassa mais fraca tiveram um modo de ruptura por esmagamento e, também, issuras verticais devido à concentração de tensões em alguns pontos; a presença da junta vertical nos prismas levou a uma issura de separação entre o bloco do meio e a junta vertical de argamassa.
Palavras-chave: blocos de concreto, alvenaria estrutural, modo de ruptura, comportamento à compressão.
Study of the compressive strength of concrete block
prisms – stack and running bond
Estudo da resistência à compressão de prismas de
blocos de concreto - juntas sobrepostas e amarradas
G. MohaMad a [email protected]
P.B. LoURENÇo b [email protected]
h. R. RoMaN c [email protected]
a Universidade Federal do Pampa, Curso de Engenharia Civil, Av. Tiarajú, 810, Alegrete, RS, Brasil. [email protected] b Universidade do Minho, Departamento de Engenharia Civil, 4800-058 Guimarães, Portugal. [email protected]
c Universidade Federal de Santa Catarina, Departamento de Engenharia Civil. 88040-900, Florianópolis, SC, Brasil [email protected]
Received: 13 Aug 2010 • Accepted: 14 Apr 2011 • Available Online: 19 Aug 2011
abstract
1. Introduction
Unreinforced structural masonry can be considered as a system formed of distinct materials which interact to respond to vertical and horizontal loads produced by self-weight, wind and seismic activity during its useful life, with a low tensile strength, as stated by Vermeltfoort [1]. It is worth noting that the behavior of the set is dependent not only on the quality of each material employed, but also on the physic-chemical interactions between the materi-als. Thus, a structural masonry wall must be treated not as a function of the characteristics of its individual materials but as a composite material resulting from the interaction of the unit, of the mortar and also, when used, the grout. It is therefore impor -tant to fully understand the behavior of the ‘masonry material’, which can vary with the different types of unit, mortar and grout. For this reason, the structural performance of masonry walls can-not be estimated without carrying out tests on walls or prisms of the materials to be used.
2. Mechanism failure of masonry
The main mechanical properties of masonry walls are the com-pression, tensile, lexural and shear strengths. Of these proper-ties, the most important is the compression strength because, in general, masonry walls are submitted to more intense vertical loads than horizontal loads produced by wind or seismic activ-ity. Concrete hollow block masonry structures are currently being used extensively in many parts of the world and there is an urgent need to obtain experimental and numerical data of different bond-ing arrangements.
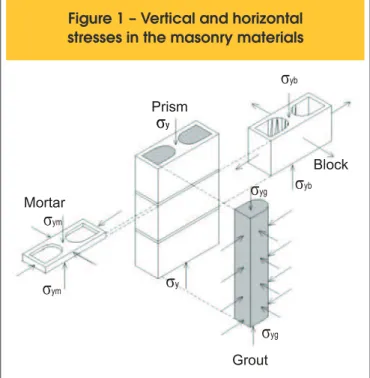
Previous studies on blockwork masonry indicate that the failure mode of masonry occurs under a biaxial state of tensile-compres-sive stress and the nonlinearity of the stress-strain relationship corresponds to a large increase in the lateral strain which is as-sociated with microcracking of the concrete [2, 3, 4, 5 and 6]. To evaluate the carrying capacity of the wall and to improve the knowl-edge about its compressive strength, it is important to understand the mechanisms involved in deformation and failure. The distribu-tion of stress of masonry prisms under compression are depicted in Figure 1.
Atkinson et al. [7] stated that the prediction of compressive strength and deformation characteristics of full scale masonry based on compressive tests of stack-bonded masonry prism and the
inter-pretation of the results of prism tests have a signiicant inluence on the allowable stress and stiffness used in masonry design. Obvi-ously, besides the strength another relevant parameter for design is the stress–strain relationship. In particular, the elasticity modulus is of interest, which is a mechanical property inluenced by different factors. It was noted that the elasticity modulus of masonry as a composite system includes the effect of the different components, namely mortar and unit.
Cheema and Klingner [8] described the failure criterion for hollow prisms using the Young’s modulus ratio between mortar/block and the failure type (by mortar crushing and transverse block splitting). Material non-linearity was accounted for by using secant modulus, and the strength of the constituent materials was computed con-sidering the effects of multiaxial stresses.
Khalaf, Hendry and Fairbain [9] did an investigation to evaluate the effect of the concrete ill strength and mortar joint type on the compressive strength and behavior of unilled and illed blockwork masonry prisms. The experimental results were used to derive a
Figure 1 – Vertical and horizontal
stresses in the masonry materials
ate materials for masonry structures (Mohamad [14]) and the ef-iciency factor is a commonly used concept to deine the adequacy of the materials. This factor is obtained by dividing the compres-sive strength of the masonry prism by the comprescompres-sive strength of the unit and, generally, this value is lower than one and decreases with the increase in the strength of the unit.
The present paper addresses several relevant issues as a contri-bution for the discussion of the mechanics of hollow concrete block masonry under compression.
3. objectives of the study
The main objective of this investigation is to understand the axial and lateral deformation behavior of concrete hollow block masonry prisms with different bonding arrangement, considering the inlu -ences of two different sets of block/mortar strength combinations. It is noted that most experimental results available in the international literature of masonry are focused on stack bond prism, while in this work the main goal is to understand the mechanisms involved in the deformation and failure of stack and running bond prism.
4. Experimental methodology
and program
Initial results of the combination of two types of mortars, one block geometry and two types of prisms (stack and running bond) are presented. The mortars are in accordance to ASTM C 270 [15], corresponding to different mixes, with appropriate workability and suficient luidity. Two different sets of block/mortar were tested for each type of masonry prism, with mortar designated according to the standards ASTM C270 [15], EUROCODE 6 [16] and BS 5628 [17]. The industry of precast concrete produces different geometry of hollow concrete blocks (two-core or multi-core) but in this study we used only two hollow concrete blocks, because they are easily available and are the most widely used. The webs and face shells have tapered section with added lare at the top. The thickness at simple empirical formula to determine the speciied compressive
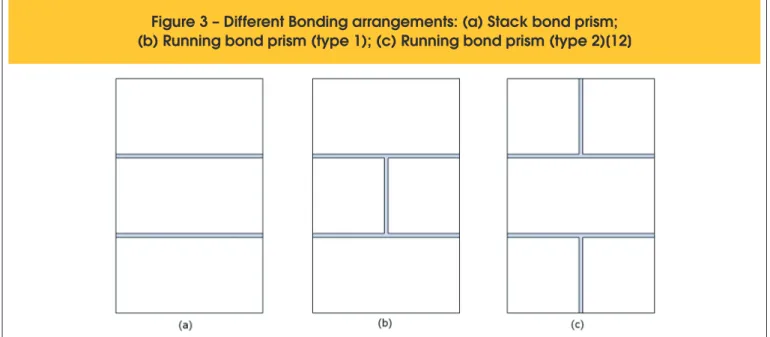
strength of blockwork masonry, based on the contribution of the individual materials. The authors concluded that the mortar joint has a negligible effect on the compressive strength of the prism. Riddington and Naom [10] developed a inite element program to predict the ultimate compressive strength of masonry, using local failure criteria of the different materials. A theoretical investiga-tion using three dimensional inite element analysis was done by Ganesan and Ramamurthy [11]. The authors discussed the effect of different parameters on the behavior of concrete hollow block masonry, such as type of hollow-block geometry, bonding arrange-ment, type of mortar bedding and mortar properties. To make the analysis easier, symmetry was taken into account, i.e. only one quarter of the prism of the hollow-block masonry was analyzed. To represent the range of block geometries adopted, three types of hollow block geometries and different bonding arrangements were considered. The gross and the net areas of all types of blocks were kept constant. The main conclusion of the studies was that a stack-bonded prism did not represent the behavior of masonry panel in running bond and it tends to give a false value for the compressive strength. Figure 2 shows the geometry of different blocks, namely: (a) a three-core conventional block; (b) a two-core conventional block, and; (c) and a structurally eficient block. Figure 3 presents the bonding arrangement.
The failure mode of fragile materials, as concrete, occurs when the principal tensile stress reaches the limit of the tensile strength of the material. Masonry is a composite with distinct directional prop-erties and the mortar joints are planes of weakness. To simulate the masonry complexity two strategies can be adopted - micro and macro models - depending on the level of accuracy. The models of masonry under compression have to represent the nonlinear stress-strain relation, the failure envelope under multiaxial stress condition and the post-cracking and crushing behavior of the mate-rial (Page and Shrive [12] and Lourenço [13]).
It is noted that the compressive strength and failure mode of ma -sonry components are important for the speciication of
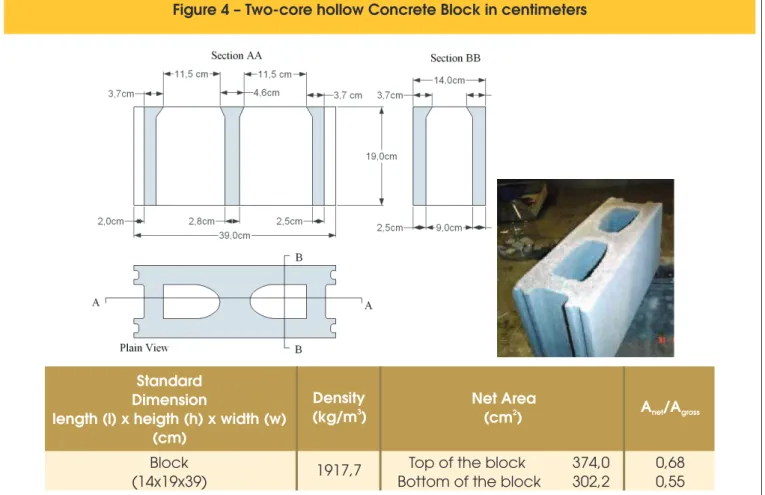
the top of the face shell and end webs was about 17 mm more than that at the bottom, and the central web is just over 18 mm thicker at the top than that at the bottom. Figure 4 shows the geometries of the two-core hollow concrete block.
The particle size distribution of the sand of mortar is important to understand the material performance in use. The results of gra-dation tests are presented in percentage cumulative passing and retained in different sieves size (Table 1). The value of the ineness
modulus of the sand is 2,27, and was obtained by adding the per-centage of the aggregate retained on each of the standards series of the sieves up to 0,15 mm.
For the experimental studies two types of prism were tested, the irst named ‘A’ containing three full concrete blocks and two bed joints. The second type of prism, named ‘B’, is three blocks high, the middle block being composed of two half blocks with one ver-tical and two bed joints. The top and bottom of the block of the prisms are ground by a mechanical process to assure a lat sur-face, rather than use a cement paste.
The main objective of the prisms tests was to determine the inlu-ence of the vertical joint on the deformability characteristics and failure mode of the set. The total number of prisms of type A was eight, that is, four for mortar mix I and four for mortar mix II, with
Figure 4 – Two-core hollow Concrete Block in centimeters
Standard
Dimension
length (l) x heigth (h) x width (w)
(cm)
Density
3(kg/m )
Net Area
(cm )
2A /A
net grossBlock
(14x19x39)
1917,7
Top of the block
374,0
0,68
Bottom of the block
302,2
0,55
Table 1 – Gradation tests of the
sands of the mortars
Sieve size
(mm)
retained, by mass
Cumulative %
passing, by mass
Cumulative %
4,80
0,34
99,66
2,40
6,67
93,32
1,20
19,89
80,10
0,60
36,28
63,71
0,30
73,62
26,38
0,15
90,38
9,61
0,075
97,72
2,27
Receiver
100
0
Table 2 – Proportion of cement, lime and
sand in the mortar mixes (by volume)
Series
Mix – Proportion of materials used (by volume)
Cement
Lime
Sand
I
1
0.25
3
the mix proportion (in volume) presented in Table 2. For type B the number of prisms constructed with mixes I and II were 4 and 6, respectively. A larger number of prisms were constructed with mix II due to the possibility that mortars with a lower strength may have a higher dispersion of the values.
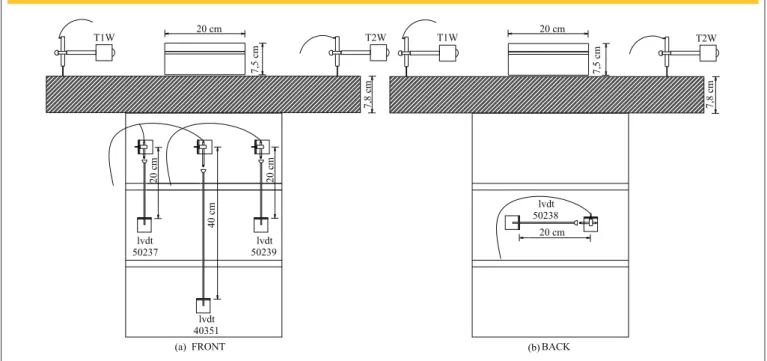
The instrumentation layout of the compression test of one and
two bed joints are shown in Figs. 5 and 6. A total of six LVDTs with different displacement ields were used. The LVDTs were as follows: numbers 50237, 50238 and 50239, with a maximum displacement ield of ± 1 mm (measurement base of 20 cm); and number 40351 with a maximum displacement ield of ± 5 mm (measurement base of 40 cm).
Figure 5 – Positioning of the LVDTs in the tests with prisms comprising three whole blocks (type A)
(a) (b)
lvdt 50238
BACK 20 cm 20 cm
7,
5
cm
7,
8
cm
20 cm
7,
8
cm
7,
5
cm
FRONT
20
cm
20
cm
40
cm
lvdt 40351
lvdt 50239 lvdt
50237
T1W T2W T1W T2W
Figure 6 – Positioning of the LVDTs in the tests with prisms comprising
two full blocks and two half blocks (type B)
Experimental tests done by Barbosa and Hanai [18] con-cluded that the bending of steel plate leads to a non-uniform stress distribution. To investigate the effect of lex-ibility of the test machine plate on the strain distribution, two LVDT´s - T1W and T2W have been attached on the top of the prisms, allowing us to charac-terize the load transfer and any bending deformation. For the compression tests it was concluded that a steel plate of 78 mm avoids concentration of stresses in the prism, provid-ing a uniform distribution of the stress and strain.
5. Experimental
results of the prisms – stack and
running bond
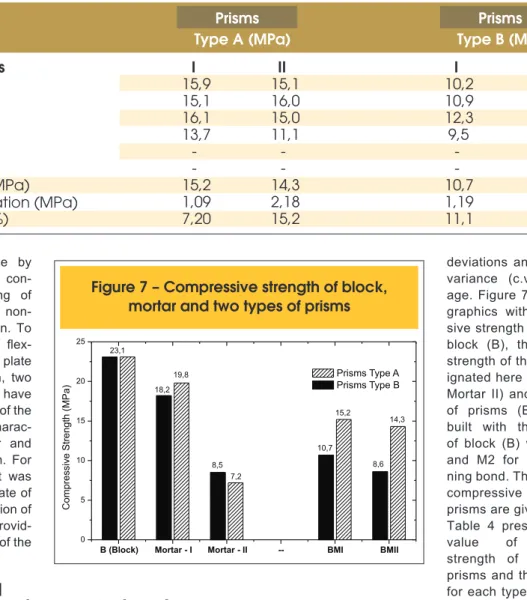
The individual (fprism) and mean (fp average) values of compres-sive strength for stack-bonded and running bond prisms (type A and B) are given in Table 3, with the respective standard
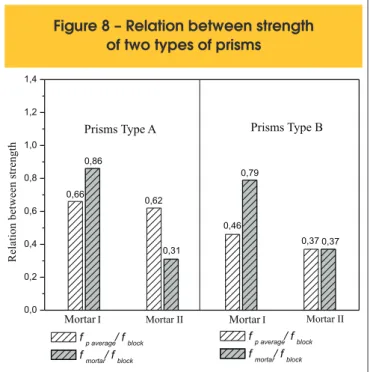
deviations and coefficient of variance (c.v.) in percent-age. Figure 7 shows the bar graphics with the compres-sive strength of the concrete block (B), the compressive strength of the mortars (des-ignated here as Mortar I and Mortar II) and the two types of prisms (BMI and BMII) built with the combination of block (B) with mortar M1 and M2 for stack and run -ning bond. The values for the compressive strength of the prisms are given in net area. Table 4 presents the mean value of compressive strength of block, mortar, prisms and their relationship for each type of prisms. Fig-ure 8 summarize the average results of the relation between strength of fprism/fblock (efficiency factor) and fmortar/fblock ratios. From the experimental results it was not possible to estimate the increase in the stiffness of the mortar joint due to the con-finement. Table 5 gives the mean values of the axial strain considering a single bed joint, the stress/strength ratio and the
Table 3 – Compressive strength of prisms with statistical results
Prisms
Type A (MPa)
Type B (MPa)
Prisms
Series
I
II
I
II
15,9
15,1
10,2
7,0
15,1
16,0
10,9
9,2
16,1
15,0
12,3
9,3
13,7
11,1
9,5
9,6
-
-
-
9,9
-
-
-
6,5
f
p average(MPa)
15,2
14,3
10,7
8,6
Standard deviation (MPa)
1,09
2,18
1,19
1,45
c.v (%)
7,20
15,2
11,1
16,9
Figure 7 – Compressive strength of block,
mortar and two types of prisms
B (Block) Mortar - I Mortar - II -- BMI BMII 0 5 10 15 20 25 C om pr es si ve St re ng th (M Pa
) Prisms Type A Prisms Type B
10,7 8,6 15,2 14,3 23,1 18,2 8,5 19,8 7,2
Table 4 – Compressive strength of blocks, mortar and prisms
Type
Series
f
block(MPa)
(MPa)
f
mortarf
(MPa)
p averagef p average/fblock
f p mortar/fblock
A
I
23,1
19,8
15,2
0,66
0,86
II
23,1
7,2
14,3
0,62
0,31
Figure 8 – Relation between strength
of two types of prisms
0,0 0,2 0,4 0,6 0,8 1,0 1,2 1,4
f p average/ f block f mortar/ f block f p average/ f block
f mortar/ f block
Prisms Type B
0,31 0,37 R el at io n be tw ee n st re ng th 0,66 0,62 0,46 0,37 0,86 0,79
Mortar I Mortar II
Prisms Type A
Mortar I Mortar II
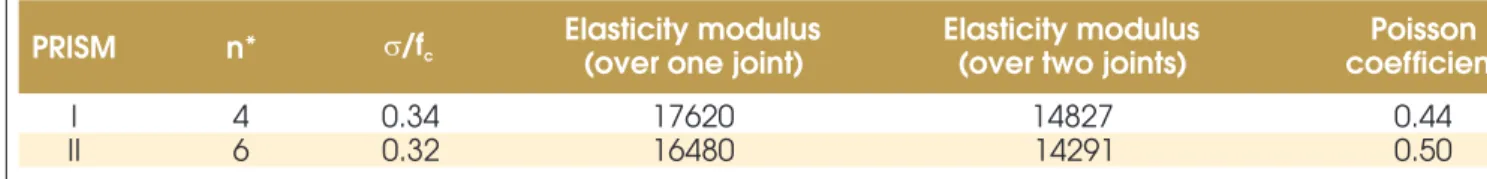
secant elasticity modulus of the prisms with a bed joint, ob-tained for the LVDTs designated as 50237 and 50239. It was verified that there is an increase in the average compressive strain of the prisms, due to the decrease in the compressive strength of the mortar. The secant elasticity modulus values for prisms I and II were rather close.
Table 6 shows the average results for the prism strain (type A), the stress/strength ratio, the Poisson ratio and the secant elasticity modulus of the prisms. In this case, the axial strain includes two bed joints. In the same way, the horizontal strain of the set at half the prism height was veriied, allowing the calculation of the
Pois-Table 5 – Average experimental results for the strain of the prisms (Type A)
Prism
n*
Average axial strain (over one joint)
(Lvtd:50237 and 50239)
s
/f
cModulus (MPa)
Elasticity
I
4
0.0002266
0.31
20989
II
4
0.0002447
0.33
19405
* n is the numbers of the specimens
Table 6 – Average experimental results for the strain of the prisms (Type A)
* n is the numbers of the specimens
Prism
n*
(over two joints) 40351
Axial strain
Lateral strain
50238
s
/f
cPoisson
ratio
Modulus (MPa)
Elasticity
I
4
0.0002962
0.0000670
0.31
0.22
16056
II
4
0.0003098
0.0000866
0.33
0.28
15326
son ratio of the prism. The compressive test on the prism produces a tensile stress at mid high, as expected.
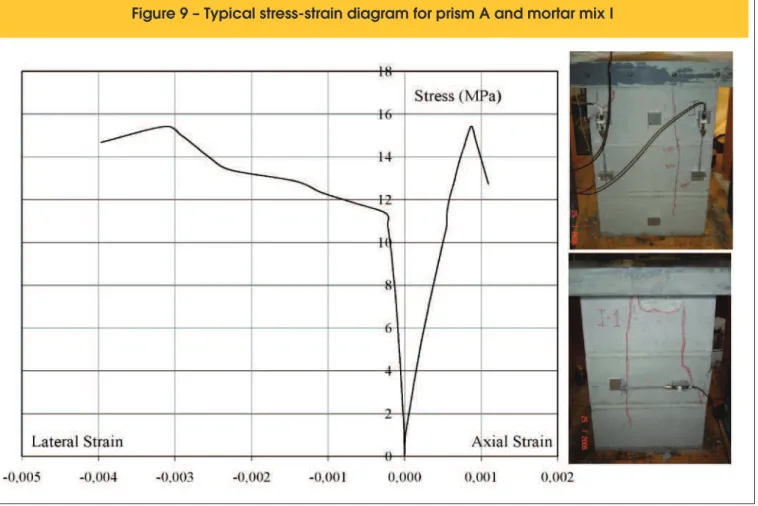
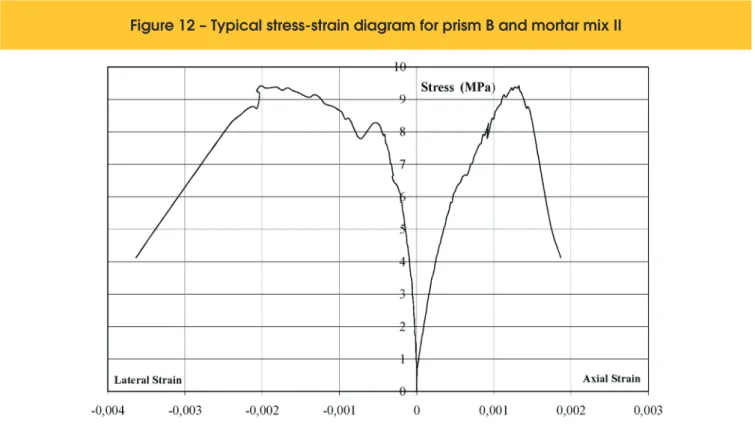
Figures 9 and 10 shows the axial and lateral stress-strain dia -grams for the prisms constructed with mortar mixes I and II. For prism A with mortar mix I, an increase in the lateral strain can be observed when the stress reaches 0.80 of compressive strength. For the prisms with mortar mix II localized crushing and crumbling of the prisms was observed. There was no instantaneous increase in the lateral strain; instead, there was a continuous increase. The areas of crushing were located in the upper mortar joint of the prism for a stress level close to 50% of the compressive strength. Afterwards, crumbling of the block began, inducing the propaga-tion of vertical cracks.
It can be observed that, for prism B, the vertical joint can introduce an increase in the coeficient of variation of the results. This prob -ably occurs due to the fact that the failure process begins at the vertical joint. The average results for the compressive strength of the prisms with a vertical joint were lower than those for the prisms without a vertical joint (type A). This decrease was 42% and 66% for the mortar mixes I and II, respectively.
Figure 9 – Typical stress-strain diagram for prism A and mortar mix I
6. Simulation of non linear behavior
of prisms
The adoption of a numerical model is generally based on the con-sideration that its results are deterministic and non probabilistic, which means that the mechanical properties are taken as averages, without considering the variability. The aim of this study is to obtain a model able to simulate numerically the prism compression tests, through a constitutive model using the theory of plasticity. The nu-merical simulations were carried out using a commercial non-linear inite element program (Diana [19]), which provided good results in analyzing this type of masonry under compression [20]. More com -plex models involving some kind of mesoscale seem necessary for other masonry types [21,22]. Two dimensional 8-node elements under biaxial stress state were considered using a combination of the yield conditions of Rankine and Drucker-Prager. An incremental-iterative Newton-Raphson method with arc-length control and line search was adopted to solve the equilibrium conditions and obtain convergence at the end of each load increment within prescribed tol-erance limits. Figure 13 shows the quadrangular mesh of elements with eight nodes, submitted to a plane state of stress, displacement restrictions and loadings using the numerical model. The linear and
* n is the numbers of the specimens
PRISM
n*
s
/f
cElasticity modulus
(over one joint)
Elasticity modulus
(over two joints)
coefficient
Poisson
I
4
0.34
17620
14827
0.44
II
6
0.32
16480
14291
0.50
Figure 11 – Typical stress-strain diagram for prism B and mortar mix I
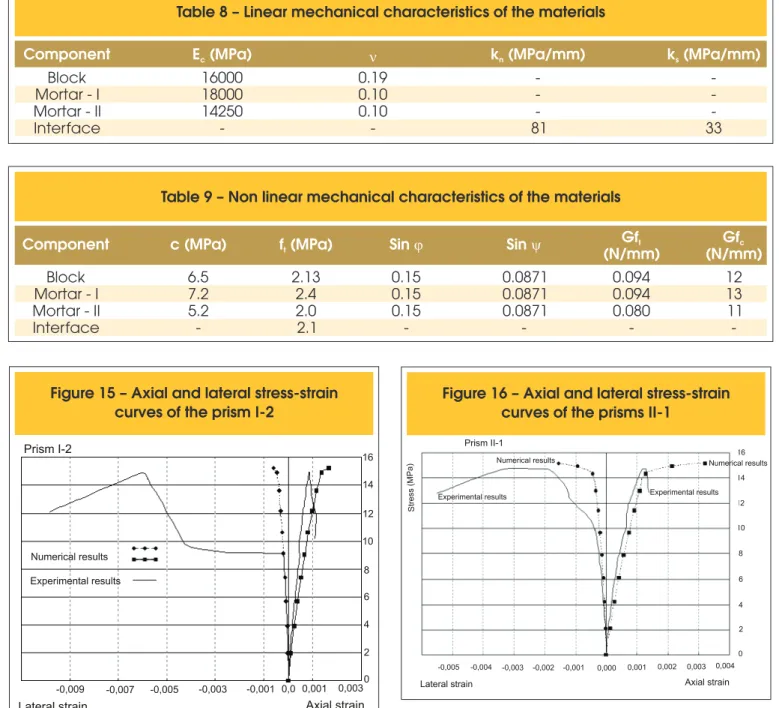
non-linear mechanical characteristics of the materials used in the simulation are shown in Table 8 and Table 9, according to experi-mental results obtained by Mohamad et. al [23]. The mechanical properties of the mortars mixes I and II were established considering the stress state in which they were found, that is, using as a refer-ence the triaxial compression strength envelopes, the increase in the secant elasticity modulus of the conined mortar (Ec) obtained in experimental tests on prisms and the decrease in the Poisson ratio due to the lateral coninement. An artiicially low friction angle of 9o
and dilatancy of 5o was adopted, in order to obtain a proper plane
stress failure representation of the materials using Drucker-Prager. The fracture energy under tension and compression were obtained by experimental tests of samples cut from the block (Mohamad [14]). The experimental results for the prisms were used for comparison, named I-1, I-2, II-1 and II-2. The properties of the materials were adjusted in each simulation, according to the measured values of the masonry components.
6.1 Numerical results
Figure 12 – Typical stress-strain diagram for prism B and mortar mix II
a change in the mortar mix (mixes I and II). It was verified through the stress-strain curves, for prisms I-1 and I-2, that the axial stiffness of the numerical model was lower than the experimental values, meaning that the LVDTs did not provide an adequate value for the Young’s modulus. Regarding the lateral strain, the numerical model managed to represent the experimental tests up to the opening of the first crack. Figures 14, 15, 16 and 17 show a comparison between the axial and lateral stress-strain curves of the prisms obtained
experimen-tally for mortars I and II and the results obtained numerically at similar positions.
The appearance of localized stress at a height half way up the prism for mix I induced cracks in the block, leading to an instanta -neous increase in the lateral strain of the prism, as can be seen in Figs. 14 and 15. Thus, the simulation of the prism constructed with mortar mix I did not manage to capture the lateral strain increase,
Figure 13 – Geometrical characteristics
of the block-mortar set
Block
Mortar
Table 8 – Linear mechanical characteristics of the materials
Component
E (MPa)
cn
k (MPa/mm)
nk (MPa/mm)
sBlock
16000
0.19
-
-
Mortar - I
18000
0.10
-
-
Mortar - II
14250
0.10
-
-
Interface
-
-
81
33
Table 9 – Non linear mechanical characteristics of the materials
Component
c (MPa)
f (MPa)
tSin
j
Sin
y
(N/mm)
Gf
t(N/mm)
Gf
cBlock
6.5
2.13
0.15
0.0871
0.094
12
Mortar - I
7.2
2.4
0.15
0.0871
0.094
13
Mortar - II
5.2
2.0
0.15
0.0871
0.080
11
Interface
-
2.1
-
-
-
-
Figure 15 – Axial and lateral stress-strain
curves of the prism I-2
Figure 16 – Axial and lateral stress-strain
curves of the prisms II-1
for stress levels above 0.6. fc (compressive strength), but a good agreement for the failure stress was obtained.
The prisms constructed with mortar mix II provided a better agree-ment between the numerical and experiagree-mental results for the axial and lateral strain and the failure stress. The failure mode observed experimentally for this type of prism began with crushing of the mortar, and no sudden crack opening half way up the prism was observed, as occurred in the prism with mix I. Thus, there was better agreement between the lateral and axial stresses and strain at failure. Table 10 shows the comparative results for the ultimate axial strain obtained in the experimental tests and in the numerical simulations. The ultimate deformation is taken as the loss in the
total load capacity of the component, and not the appearance of the irst crack. Note that there is a signiicant difference in the ulti -mate axial strain when comparing the numerical and experimental results.
Figure 17 – Axial and lateral stress-strain
curves of the prisms II-2
results that there was an increase in the Poisson ratio from 0.19 to 0.36 for the bed joint of mix I. For mortar mix II the Poisson ratio changed from 0.19 to 0.48.
Through the numerical analysis, a relation was obtained between the vertical and horizontal stresses for the mortar and the block. In
the case of the mortar, the type horizontal stress was compressive, while the same stress was tensile for the block. For the failure of the prisms constructed with mortar mix I, the coninement stress value for the mortar was 2.19 MPa and the tensile stresses of the block reached a maximum of 0.12 MPa. The prism of mix I showed a linear increase in the coninement stress up to a σ/fc ratio close to 0.9. Figures 18 and 19 show the numerical results of the stress -es for a speciic element in the mortar and block.
For the failure of the prisms with mix II, the coninement stress of the mortar was 5.9 MPa and the maximum tensile stress of the block was 0.37 MPa. The prisms of mix II had a linear increase in the coninement stresses of the mortar up to a σ/fc ratio of 0.6. Afterwards, there was a disproportional increase in the lateral stresses, showing the strong non linear nature of the mortar set. From the numerical results it was concluded that the level of ten-sile stress acting in the block was not suficient to generate tenten-sile stress leading to a failure of the concrete due to the tension, which conirms that the representation of the collapse is essentially
phe-Table 10 – Non linear mechanical
characteristics of the materials
Prism
e
axial ultimate straine
axial ultimate strain(Experimental)
(Numerical)
I - 1
0.00088
0.00168
I - 2
0.00086
0.00168
II - 1
0.00124
0.00321
II - 2
0.00332
0.00321
Table 11 – Average numerical results
for the deformability of the prisms
Mortar mix I
Mortar mix II
s
/f
cPoisson ratio
Poisson ratio
0
0
0
0.13
0.19
0.19
0.26
0.19
0.19
0.38
0.21
0.22
0.49
0.24
0.24
0.59
0.26
0.27
0.70
0.27
0.28
0.80
0.29
0.30
0.90
0.30
0.33
0.98
0.32
0.43
1.00
0.36
0.48
Figure 18 – Relation between the stresses of the
numerical model for the mortar
and block for mix I
nomenological, requiring more advanced models to properly rep-resent the failure mode, see also [22].
With the numerical results, for a selected element in the bed joint and in the block, a relation between the stresses and the axial and lateral strain was obtained. With these values the secant elastic -ity modulus was calculated, up to the prism failure. The relation between the ratio of elasticity modulus of the mortar to that of the block (Emortar/Eblock) and the ratio of the acting stress to the com-pression strength (σ/fc) was determined, as shown in Figure 20. The lower and upper limits in Fig. 20 provide a link between the behavior and the stiffness ratio of the materials. The numerical re-sults for the prisms of mix I showed the development of tensile stresses in the mortar since the elasticity modulus was higher than that of the block and, consequently, compression stresses were generated in the block. For the prisms with mix II, the block was submitted to tensile stresses throughout the loading and the mortar was under triaxial compression, since the elasticity modulus of the mortar did not reach that of the block. This leads to the conclusion that the failure modes of the prisms were differentiated, that is, for the prism with mix I there was a progressive increase in the strain in the x direction, producing stresses which lead to the material failure by tension. For the prism constructed with mix II, there was a greater strain of the bed joint, generating localized crushing and leading to failure mainly through the collapse of the joint, and the subsequent development of tensile stresses in the block.
7. Conclusions
The main conclusions of this work are:
n The adopted experimental test and the numerical simulation seem to be capable of giving reasonably good prediction of the ultimate compressive strength for this type of geometry block and bedding joint.
n The appearance of non-linearity in masonry corresponds to an increase in the lateral strain due to the extensive cracking of the material and to a progressive increase in the Poisson ratio.
n The cracks in the three-block prisms constructed with mortar
Figure 20 – Relation between E
mortar/E
blockand
σ
/fc ratio
mix I were vertical, occurring in a symmetrical way on both sides. None of the samples suffered crushing in the bed joint. It could be observed visually that the prism began to behave as a single homogeneous material as the cracks were symmetrical, vertical and dispersed.
n The prisms constructed with mortar type II had, as a
conse-quence of localized crushing, vertical cracks due to the stress concentration at some points. In the failure process, the begin-ning of a loss of cohesion of the mortar, the crushing of the mortar joint and the crumbling of the upper and lower surfaces of the block, were veriied.
n For the prisms constructed with a vertical joint there was a progressive increase in the Poisson ratio, the values be -ing higher than those of conventional prisms with three full blocks. The presence of a vertical joint resulted in the ap-pearance of separation cracks between the middle block and the vertical joint of the mortar. The crack was observed when the stress reached approximately 30% of the com-pressive strength of the set. The prisms constructed with mortar mix type I had the following failure mode: localized crushing of the bed joint, crumbing of the block surface and vertical cracks in the block. It was veriied that there was a signiicant reduction in the prism strength generated by the presence of a vertical joint. This reduction in eficiency is probably due to the fact that the face shell and cross webs of the block aren´t juxtaposed and do not coincide with the transversal walls of the block. It may also be associated with the failure mode which the vertical joint produces. Further-more, the presence of a vertical joint led to a considerable reduction in the elasticity modulus value.
n These studies are preliminary and further experimental tests and numerical simulations on masonry prisms must be per-formed considering the three-dimensional effect.
8. References
[01] VERMELTFOORT. A.T- Brick-mortar Interaction in masonry under pressure. PhD thesis. Technical University of Eindhoven. October, 2005.
[02] HAMID, A. A. AND DRYSDALE, R. G.. Behavior of concrete block masonry under axial compression. American Concrete Institute Journal, vol. 76, no. 6, pp. 707-721, 1979.
[03] HENDRY, A. W. Structural brickwork. Edited by Halsted Press book. John Wiley & Sons. New York. USA. ISBN 0-470-27109-4, 1981.
[04] KHOO, C. L. A failure criterion for brickwork in axial compression. Thesis presented to University of Edinburgh, University of Edinburgh, Scotland, 1972. [05] SHRIVE, N. G. Compressive strength and strength testing of masonry. Proc. 7 IBMAC, Eds. T. McNeilly and J. C. Scrivener, Melbourne, BDRI, 699-710, 1985. [06] SHRIVE, N. G. AND EL-RAHMAN, M.. Understanding
the cause of cracking in concrete: A diagnostic aid. J ournal Concrete International, vol. 7, no. 5, pp. 39-44, 1985.
stack-bond brick masonry prisms in compression. Proc. 3rd North America Masonry Conference, Boulder, Col.,TMS, Paper 18, 1985.
[08] CHEEMA, T. S. AND KLINGNER R. E. Compressive Strength of Concrete Masonry Prism. American Concrete Institute- ACI Structural Journal. January, vol. 83, no. 1, pp. 88-97, 1986.
[09] KHALAF, F. M., HENDRY, A. W. AND FAIRBAIN, D.
R. Study of the compressive strength of blockwork masonry. American Concrete Institute Structural Journal, vol. 91, no. 4, pp. 367-375, 1994.
[10] RIDDINGTON, J. R. AND NAOM, N. F. Finite Element Prediction of Masonry Compressive Strength. Computers & Structures, vol. 52, no. 1, pp. 113-119, 1994.
[11] GANESAN, T.P. AND RAMAMURTHY., K. Behavior of concrete hollow-block masonry prisms under axial compression. Journal of Structural
Engineering, ASCE, vol. 118, no. 7, pp. 1751-1769, 1992.
[12] PAGE, A. W. AND SHRIVE, N.G. A critical assessment of compression tests for hollow block masonry. Masonry International, vol. 2, no. 2, pp. 35-70, 1988.
[13] LOURENÇO, P.B. Current experimental and numerical issues in masonry research. International Workshop on Masonry Walls and Earthquakes. University of Minho, Guimarães, Portugal. pp. 119-136, 2004.
[14] MOHAMAD. G. Mecanismo de ruptura de alvenarias de blocos a compressão. UMinho: Universidade do Minho. Departamento de Engenharia Civil. 312 p. Tese de Doutorado, 2007.
[15] AMERICAN STANDARD TEST METHOD. ASTM C 270. Mortar for unit masonry. Philadelphia: ASTM, 2008.
[16] EUROCODE 6. European standard - Design of masonry structures – Part 1-1: General rules for reinforced and unreinforced masonry structures. 2005. [17] BRITISH STANDARD INSTITUTE. BSI 5628: British
standards institution. BSI-5628: Structural use of unreinforced masonry. London, Part. 1, 1992. [18] BARBOSA, C. S. AND HANAI, J. B. Deformability of
Hollow Concrete Blocks and Platen Effect on Axial Compression Test. 14th International Brick & Block
Masonry Conference. 14 IBMAC. Sydney, Australia. February, 2008.
[19] DIANA. Finite element code: user´s manual – release 9. TNO Building and Construction Research, Delft. [20] BARBOSA, C.S., LOURENÇO, P.B. AND HANAI, J.B.
On the compressive strength prediction for concrete masonry prisms. Materials and Structures, vol.43, no. 3, pp. 331-344, 2010.
[21] LOURENÇO, P.B. AND PINA-HENRIQUES, J.L., Masonry micro-modelling: a continuum approach in compression. Computers & Structures, vol. 84, no. 29-30, pp. 1977-1989, 2006.
[22] PINA-HENRIQUES, J.L. AND LOURENÇO, P.B., Masonry compression: a numerical investigation at
the meso-level. Engineering Computations, vol. 23, no. 4, pp. 382-407, 2006.