ISSN 0104-6632 Printed in Brazil
Vol. 21, No. 02, pp. 307 - 315, April - June 2004
Brazilian Journal
of Chemical
Engineering
A LACTOSE FIA-BIOSENSOR SYSTEM FOR
O
TROL
L. S. Ferreira
ouza Jr
1*and R. O. M. Folly
11
niversity of Rio de Janeiro, Ilha do Fun 562-7636, Fax +(55) (21) 2562-7567,
Cx.P. 68542, CEP 21949-900, Rio de Janeiro - RJ, Brazil. rj.br
Chemical Engineering Department, Federal University of Rio Grande do Sul, 7,
posed of the immobilized enzymes E -galactosidase and glucose oxidase was developed. Oxygen consumption during the reaction catalyzed by these enzymes was detected. The biosensor was integrated into an FIA (flow injection analysis) system that allows measurement of lactose on-line in less than three minutes. This biosensor was used to monitor lactose concentration during the production o xianus from
abil ents had
lin g/L.
on
hich po rea
sa i c carr abo
analyses. Therefore, several biosensors, both integrated and not integrated into FIA (flow injection analysis) systems, have been used. These analytical devices incorporate a biological material (e.g. tissue, microorganisms, organelles, cell receptors, enzymes, antibodies, nucleic acids, etc.) that is closely associated with or integrated within a physicochemical transducer or transducing microsystem, which may be optical, electrochemical, thermometric, piezoelectric or magnetic. They have
mental diagnostics ustries.
very attractive: and speed. Glucose
d Li, 2000; Liu et olly et al., 1996), eigel et al., 1996), l (Compagnone et n et al., 1998) and nella (Pathirana et al., 2000) were previously measured with biosensors. FIA is a technique that is well suited to monitoring bioprocesses, especially when biosensors are used, because they are easily integrated into sample systems. The advantages of FIA are (1) system components can be substituted during the process without the risk contaminating the medium ; (2) the system can be recalibrated at any time without interference in the process; and (3) several measurements can be done with the same sample,
MONITORING AND PR CESS CON
1, J. O. Trierweiler
2, M. B. De S
Chemical Engineering Department, School of Chemistry, Federal U dão, CT, Bloco E, Phone +(55) (21) 2
E-mail: mbsj,rossana@eq.uf 2
Rua Luis Englert, s/n, Phone +(55 )(51) 3316-4072, Fax +(55) (51) 3316-327 CEP 90040-040, Porto Alegre – RS, Brazil.
E-mail: jorge,luciane@enq.ufrgs.br
(Received: February 13, 2003 ; Accepted: January 5, 2004)
Abstract - In this work an enzymatic lactose biosensor com
fE-galactosidase by the yeast Kluyveromyces mar
cheese whey. The sensor showed good st ity been performed. The analytical curve was
Keywords: lactose, biosensor, flow injecti
INTRODUCTION
Culture media are complex systems in w activity and the state of the biological com are extremely sensitive to changes in the bio physico-chemical environment. It's neces monitor on-line the process variables appropriate description of the state of the pro desired. Off-line analyses are not able to that task due to the time delay of some l
after four months and after almost 7000 measurem ear in the range of lactose concentration from 1 to 30 analysis,Kluyveromyces marxianus.
applications in medicine, environ and in the food and processing ind the
nents ctor’s ry to
f an ess is y out ratory
w . r l
en zyme is the product of the culti
o g l
rin s sub pro ose ers. t d xygen demand) that
f m s based re is m ran h c be
on mic senso er da binati
(B (C) E -gl sy ranes of
e i the
measurements for systems A, B and C were 0.3 – 1.7, 0.7 – 3.4 and 0.3 – 1.7 g/L of lactose and more than 600, 1000 and 800 samples could be measured, respectively. A microdialysis-coupled flow injection amperometric Sensor (muFIAS) was used by Rajendran and Lrudayaraj (2002) to determine glucose, galactose and lactose in milk. The sensor is based on an enzyme-catalyzed reaction in combination with the three well-established analytical techniques, namely microdialysis
detection. With the to detect glucose njection of their lucose oxidase and as determined by sidase and glucose showed a linear M for glucose, ctose and between osensor attached to ed by Vega et al. tion of galactoside ty of the biosensor lowed by raffinose, showed a linear for galactose, 0.5 0 mM for lactose . In Weigel et al.
, lactose, xylose, uconolactone were d pyranose oxidase of immobilized zed glycoamylase, -glucosidase) and the simultaneous ars three different ere applied and ements for lactose e prediction errors s than 3% for the model media and below 6% for the yeast-extract-containing
ust be calibrated. It is shown in Ferreira et al. (2003) that on them, and thus neural networks) were used to interpret the biosensor signals.
R AND ITS INTEGRATION INTO THE FIA SYSTEM
The lactose biosensor is composed of two ze the following reactions:
Lactose + H2O E-D-glucose +
E-D-Galactose (1)
E-D-glucose + O2 Gluconic
acid + H2O2 (2)
actose zyme vation actose g and it can strate teins, into The ue to varies rom 30,000 to 60,000 mg O2/L. In Brazil, ost of the cheese whey is set aside for animal food, so studies involving other applications for this byproduct must be encouraged.
Usually, to improve process operation in all possible applications of lactose, a fast and efficient way to measure lactose concentration is required. For this purpose, some lactose biosensors can be found in the literature. In Amárita et al. (1997) a hybrid biosensor, in which the biological materials were
Saccharomyces cerevisiae and E-galactosidase, had a
high response time, 1 hour. Jäger and Bilitewski (1994) presented an enzymatic electrode
the technology of compact film commonly to as the screen-printed electrode. With th the lactose can be determined in the concentrations from 0 to 1.6 g/L, whic considered very low for most of the ec applications. Adányi et al. (1999) developed to measure lactose content in milk and oth products. Three sensors with different com of biological material were tested: (A galactosidase and galactose oxidase, galactosidase and glucose oxidase and galactosidase, galactose oxidase and oxidase. They were integrated into an FIA The enzymes were immobilized in memb natural protein and an amperometric el measured the hydrogen peroxide produced enzymatic reactions. The ranges of
sampling, FIA and amperometric multianalysis sensor it was possible and galactose by sequential i corresponding oxidase enzymes, g galactose oxidase, while lactose w injection of a mixture of E-galacto oxidase enzymes. The sensor response between 0.05 and 10 m between 0.1 and 20 mM for gala 0.2 and 20 mM for lactose. A bi an FIA system was also develop (1998) for the automatic determina conjugates and glycerol. Sensitivi was the highest for galactose, fol lactose and glycerol. The sensor response between 0.2 and 2 mM and 6 mM for raffinose, 25 and 25 and 2 and 200 mM for glycerol (1996) glucose, maltose, sucrose sorbose, galactose, fructose and gl analyzed by means of immobilize as well as by the combination glucose oxidase with immobili invertase, mutarotase, maltase (D glucose isomerase by FIA. For hen different sensors are working together
In this work a biosensor is used to monito concentration during the production of the lactase. This en
f Kluyveromyces marxianus yeast usin
from cheese whey.
Whey is a byproduct of cheese manufactu due to the high content of lactose and protein be useful in a variety of ways, such as, as a for enzyme production, concentration of dairy drinks, biotransformation of lact glucose and galactose, ethanol and oth treatment of cheese whey effluents is difficul high BOD (biochemical o
on ferred ethod ge of
analysis of glucose and other sug flow-injection configurations w compared. The range of measur was from 1 to 10 g/L. The averag in the analyses were les
an o
rs iry
media.
In order to use these biosensors, they m
ons ) E
-E
-temperature has a strong influence nonlinear models (exponential and ) cose
o
ȕgalactosidase ustem. THE LACTOSE BIOSENSO
ctrode
o
Glucose oxidase nbo
ignal of the FIA/biosensor system.
Biosensor Construction
Glucose oxidase and E-galactosidas weighted and dissolved separately in p buffer solution at pH 7 (K HPO – 117.74
ns, on
b entr
f ox Fe nge crease
of ens
mum; beg ure m be compensated to avoid distortions
this reason, a model was u deal with the effects of temperature on the o s
e hos
2 4 g/L and
KH2PO4 – 44.99 g transferred to an eppendorf
carrier for covalent bonding (vinyl-epoxy alcohol, 50-200 Pm, Riedel-de Haën) t room temperature during day inally, entire
tic cartridge, using 8.
various amounts of r compositions are the calibration curve he responses are in e was coupled to a ridge). The lowest ation measured was 1 g/L.
Microreactor 6 had the best linear range and the st response and was used in all experiments
as detected in the e measurement of glucose biosensor 25 to 1.5 g/L. For , the output signal s that for lactose concentrations near 3 g/L, so a glucose biosensor
ogether with the lactose biosensor and the ucose concentration was subtracted from the lactose concentration. Figure 3 shows a typical e concentration obtained during the fed-batch cultivation.
Tabl Gluco xidase Oxid) E-galactosidase (E-gal) contents in lactose biosensor.
Glucose oxid -galactosidase
th could ation. ygen. rreira from
mixture was transferred to a plas phosphate buffer solution at pH 5. Six microreactors (MR) with enzymes, were constructed. Thei shown in Table 1. Figure 1 shows for each one of the microreactors. T In agreement with the above equatio
oxygen consumption and peroxide producti e monitored and related to the lactose conc It was decided to quantify the consumption o Temperature dependence was studied by (2002a) and Ferreira et al. (2002b). In the ra 20 to 30°C, it was observed that an in temperature accelerates the reaction consumption. It was observed that this happ 28°C, where the output signal reaches the maxi at temperatures higher than that, the signal decrease. Therefore the effects of temperat
in O2 up to
volts as the amperometric electrod voltage converter (Wheatstone B concentr
ins to highe ust
in sed to utput
were phate
presented in this work.
Glucose Biosensor
A small amount of glucose w cheese whey, enough to disturb th the lactose. Figure 2 shows the response to concentrations from 0. a glucose concentration of 0.25 g/L in volts is almost the same a measurements. For
/L). Next, they were carefully was used t containing the polymeric gl
and left a
three s. F the
glucos
e 1: se o (G and
ase E
MR
mefa Uefb mef Uef
number
1 2.35 470 5.9 53.1
2 2 400 11.3 101.7
3 2.3 460 17 153.1
4 2.2 440 23.1 207.9
5 3 600 33.6 302.4
6 3 600 22.3 200.7
a
mass weight, in mg;
b
Units of enzyme.
0 0.2 0.4 0.6 0.8 1 1.2
0 5 10 15 20 25 30 35
Lactose (g/L)
Si
g
n
a
l
(V)
MR1 MR2 MR3 MR4 MR5 MR6
0,1 0,2 0,3 0,4 0,5
0 ,5 1 1,5 2
G lucose (g/L)
Signal (
V
)
0
0
Figure 2: Output signal of glucose biosensor.
0,00 0,04 0,08 0,12 0,16 0,20
0 10
G
luc
os
e
(
g
/L
)
20 30 40 50
Time (h)
of glucose during fed-batch cultivation.
Figure 3: Concentration
ur system studied is composed of
aun Bioreactor (5L);
olypro g Probe); 1996), phos buffer solution at pH 5.8 (K2HPO4 – 1.1 g/L, NaH2PO4.2H2O – 5.3 g/L, KCl – 1.8 g/L, EDTA – 1.5 g/L and NaN3 – 0.065 g/L);
4) Two peristaltic pumps (Flocon 1003) with five channels;
5) Mixer;
6) Selection valve (Knauer) with seven channels; 7) and 8. Injection valves with six channels; 8) Lactose and glucose biosensor;
9) Two oxygen electrodes (Yellow Spring
at the Institute for f Hannover). bes, constructed of
ameter of 0.8 mm, m).
Flow Control & er) fully automates the system, controlling the sampling and evaluating FIA output signals. It works in MS-DOS mode using an A/D card (AX5210).
The flow rates were F1 (filter) – 0.55 mL/min, F2 (drain) – 0.77 mL/min, F3 (waste from the biosensor and amplifier) – 1.8 mL/min and F4 (sample line) – 0.67 mL/min. Lactose standard solutions were prepared with the same buffer solution as that of the carrier solution. Chemicals were from Nuclear, Vetec, Merck, QEEL, Grupo Química and Inlab.
FIA System
The FIA/biosensor device is shown in Fig The
e 4.
Instruments, 5331) and
10) Two amplifiers (constructed
pylene
phate
Technical Chemistry, University o The FIA system's capillary tu PTFE polymer, had an internal di except for the injection loop (0.5 m
CAFCA (Computer-Assisted Analysis – ANASYSCON, Hannov 1) B.Br
F3
3
6
1
4
9 10 11
2
7
8 F1
F2 F4
5
Figure 4: On-line measurement system for lactose.
0 0.2 0.6 0.8 1 1.2 1.4 1.6
20 40 60 80 40
Time ( ays)
E (
V)
0 1000 2000 3000 4000 5000 6000 7000 8000
N
° of
m
eas
ur
em
en
ts
2.5 g/L
LAC(MR nº6) + GOD(300 U) LAC(MR nº6)
+ GOD(600 U)
0.4
0 100 120 1
d
30 g/L measurements
tability of lactose biosensor.
Figure 5: S
dit
m nd
ure
ne s se biosensor of 600 (cartridge A) was used together with the lactose biosensor, and the other shows results when a glucose biosensor of 300 units (cartridge B) was used.
In accordance with Figure 5, the biosensor showed good stability even after 7000 measurements and four months of work. Cartridges filled with the same buffer solution as that used in the FIA system were kept in the refrigerator.
in a BIOSTAT B ipped with a 5L supply of 8 L/min. rature and pH were controlled at 37°C and 5.5.
nies of yeast were nmeyer flask filled dium. The flask was incubated in a shaker (model NT711/Nova Técnica Equipamentos para Laboratórios, Piracicaba, SP, Brazil) at 200 rpm and 37ºC during 15 to 20 h. The yeast, Kluyveromyces marxianus CBS 6556, was from the Biotechnological Development Center, Joinville, SC, Brazil.
The culture medium was composed of cheese whey (7% w/v) from Elegê Laticínios (RS) and yeast extract (0.5% w/v) from Biobrás. The fed medium was cheese whey (28% w/v) and yeast extract (2% w/v).
STABILITY OF THE LACTOSE BIOSENSOR
Figure 5 shows the sensor stability. In ad ion to their me
CULTIVATION
Cultivations were conducted bioreactor (from B. Braun) equ vessel, stirring of 600 rpm and air Tempe
easurements for 2.5 and 30 g/L of lactose a standard deviations, the number of meas made during this work is also shown.
The figure is divided into two parts; o results when a gluco
nts
hows units
Cells were measured by absorbance (620 lactose was also measured off-line by
nm the (dinitrosalicilic acid) method (Chaplin and Ken 1994).
E S
des ib il l
ing he m
rem
conc tration of cells and results in a bior medium with a higher cell concentration . The f
show two sets of c lc
from the growth curve (Xat) and the other (X) ded the effect of FIA samples, using Equation 3.
) and NS
where Xat is the cell concentrati the growth curve, V
D
nedy, sampling flow rate and
APPLICATION OF THE LACTOS BIOSENSOR IN CULTIVATION
Fed-batch cultivations were done as below. Initially, a batch was cultivated unt c
cr ed actose fed-final aining
the bioreactor was 975 mL. between measurement results for the DNS method can be observed. During the cultivation shown in cartridge A was replaced by g onsumption was completed. The follow
batches were started, at a variable time, and t batch phase was used to consume all the re substrate.
The fact that the FIA system continuously filtered samples from the bioreactor
oves causes eactor igures ulated ucting
This replacement was made bec problems with cartridge A due of bed packing, pressure incr opening of the cartridge to occur d
Figure 7 shows biosensor rec the cultivation. Good agreement b be observed. Calibration 4 w en
ell data, one for the values ca
in r at
in
(V
F t)
X
X
V
(3)on calculated with in is the initial volume, Fr is the
t is the time.
tions
the feed rate was m pump flow rate e total volume of medium fed into
Good agreement the biosensor and
Figure 6, glucose lucose cartridge B.
ause of structural to the high degree eased causing an uring cultivation.
alibrations during etween them can as performed after the problem with the glucose biosensor. It can be seen that the results for this calibration differ slightly from the others. This difference can be attributed to a minimum requirement of time for biosensor adaptation to the new environmental conditions.
Uncontrolled Fed-Batch Cultiva
In this experiment (Figure 6), constant at 33.5% of the maximu (6.2 mL/min). Th
0 10 30 40 50 60 70
0 10 20 30 40 50
Time (h)
nt
ra
ti
o
n
(g
/L)
Cells Cells (Eq.1) Lactose on-line Lactose off-line 20
C
onc
e
Figure 6: Experimental data for fed-batch cultivation with the following initial conditions: X0 = 0.2 g/L, S0 = 49.2 g/L and V0 = 4L.
0 0,2 0,4 0,6 0,8 1,2 1,4 1,6
0 5 10 15 20 25 30 35
Lactose (g/L)
Si
gnal
calibr.1 calibr.2 calibr.3 calibr.4 calibr.5 calibr.6
Figure 7: Data on biosensor recalibration during the cultivation.
1
(V
k 1 k k 1 Kh I(t ) I(t ) e(t )
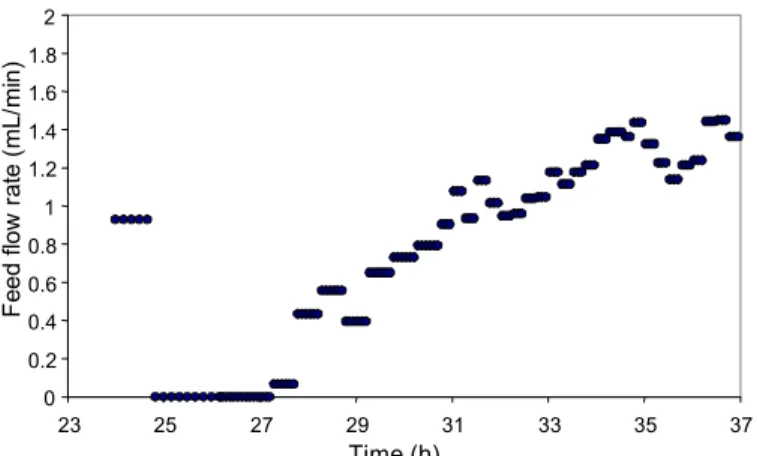
Controlled Fed-Batch Cultivation
ion eed
revi ch iscr proportional integral (PI) feedback con
(Aström and Häggl u
(4) and (5) show the PI controller used.
k
In this experiment lactose concentrat maintained at 2 g/L by manipulating the f rate. That value was chosen because in p experiments, high lactase activities were a with low levels of substrate. A d
was flow
set point.
Data for cells and lactose are Lactose measurements,
ous ieved etized troller ations
(4)
(5)
the control phase are detached in Figu variable, feed flow rate, is shown in Fi Control was not very efficient. contributed to this behavior: (1) th PI based on a process model (d cultivations, Secchi et al., 2001) t fed-batch cultivations poorly (res and (2) sensor noise and faults. T
occur when air bubbles are removed together with the sample, causing interfe
measurements p und, 1995) was used. Eq
k sp k
P(t ) K(y (t )y(t ))
i
W
where K is the controller gain, Wi is the
controller-reset time, h is the sampling time and e is the
difference between the controlled variable and the
shown in Figure 8. off-line and on-line, during re 9. The manipulated gure 10.
Two main factors e adjustment of the eveloped for batch
hat represented the ults not shown), hese faults mainly
rence with the erformed by the oxygen electrode detector. Nevertheless, this is one of the few studies that actually shows results of bioprocess control using a biosensor (see Hitzmann et al., 2000 and Siegwart et al., 1999; for others).
0 20 30 40 50 60
0 10 20 30 40 50
Time (h)
onc
e
nt
ra
ti
o
n
(
g
/L
)
Lactose on-line Lactose off-line Cells (eq. 3) Cells 10
C
Figure 8: Controlled fed-batch cultivation.
0 0.5 1 1.5 2 2.5 3.5 4 4.5 5
23 25 27 29 31 33 35 37
Time(h)
Lac
tos
e (
g
on-line off-line
Figure 9: On-line and off-line lactose measurements.
3
0 0.4 0.6 0.8 1 1.2 1.4 1.6 1.8 2
23 25 27 29 31 33 35 37
Time (h)
F
e
ed
fl
ow
r
ate (
m
L/
mi
n)
0.2
Figure 10: Feed flow rate during the control phase.
to be appro
f ntrati
tim r sens 97; Jä
r out s
o oxyg e syste filter ystem automatic detection of faults caused by air bubb
(5) nois pensation for
effects of temperature or investment in devices
m K
pplied 99; L 995
L. S. Ferreira is particularly grateful to Profs. M. A. Z. Ayub and R. Rech in Instituto de Ciência e Tecnologia de Alimentos at UFRGS and also to Prof. B. Hitzmann for the donation of some devices used in this work and the graduate student O. Broxtermann for his technical help and discussions. She would also like to thank CNPq for the research grant, FAPERGS for the financial support and the PROBRAL 199/00 Program (CAPES/DAAD) for the visiting scholarship during this work.
S
adi, M., Multi-rometric Detection
n Milk and Dairy ol., 209, 220-226 and Alkorta, F., e Lactose on Milk. 153-158 (1997).
PID Controllers: g. 2nd edition. (1995).
lin, M.F. and Kennedy, J.F., Carbohydrate ach, 2nd edition.
, M.C., Peluso, E. and Palleschi, G., Development of a Biosensor
during Alcoholic Bioelectronics, 13,
igação de um Sistema FIA-a MonitorFIA-ação e
(in Portuguese), neiro, Brazil
Ferreira, L.S., Trierweiler, J.O. and De Souza Jr., M.B., Investigação de um Sistema FIA-Biosensor de Lactose para Monitoração e Controle. Anais do Congresso Brasileiro de Automação (in Portuguese), Natal, Brazil (2002b).
Ferreira, L.S., De Souza Jr., M.B., Trierweiler, J.O., Hitzmann, B. and Folly, R.O.M. Analysis of Experimental Biosensor/FIA Lactose Measurements. Brazilian Journal of Chemical Engineering, 20, No. 1, 7-13 (2003).
REFERENCE CONCLUSIONS
The system studied was shown priate on.
Adányi, N., Szabó, E.E. and Vár enzyme Biosensors with Ampe or measurerement of lactose conce
Characteristics of linear range and response better (for our purposes) than for some othe found in the literature (Amárita et al., 19 and Bilitewski, 1994; Adányi et al., 1999).
Several factors influence the biosenso signal. Thus, for industrial application attention must be paid to (1) verification viability of the membrane that recovers the electrode, (2) automatic recalibrations of th (3) preventive methods (e.g., use of membranes) to avoid air bubbles in the s
e are ors ger
for Determination of Lactose i Products. Eur. Food Res. Techn (1999).
put
Amárita, F., Fernández, C.R. Hybrid Biosensors to Estimat some
f the en m, ing
Anal. Chim. Acta, 349, No. 9, Aström, K. and Hägglund, T.,
Theory, Design and Tunin Instrument Society of America Chap
; (4) les,
the to
Analysis: A Practical Appro Oxford: IRL Press (1994). Compagnone, D., Esti, M., Messia e filtering and (6) com
aintain it constant. For fault detection, filter algorithms or neural networks can be a supervise and detect faults (Luo et al., 19 1999; Yu et al.,1999; Xiaoan and Bellgardt, 1
ACKNOWLEDGMENTS
alman to iu, ).
for Monitoring of Glycerol Fermentation. Biosensors and 875-880 (1998).
Ferreira, L.S. Invest
Biossensor de Lactose par Controle. Master’s thesis
C., ose
Recombinant E. coli. Anal. Chim 2, 293-304 (2002).
Salgado, A.M. D
F olá,
Gluc
H , S
ontrol ncentration during Yeast Fed-ba , N
H ., Scheper, T. a
Model of F
J En
Lacto
L n, Y. a
siti n C cene, Glucose Oxida
lodex (19
L ors
tic Analysis and Bioprocess Monitori
L N
ategy Proce 13, 1
L Himmelblau, D.M., Sen
sis a he
Pathirana, S.T., Barbaree, J., Chin, B.A., Hart apid a . Bios.
Rajendran, V. and Lrudayaraj, J. Detection of Glucose, Galactose and Lactose in Milk with a MicrodialysisCoupled Flow Injection Amperometric Sensor. J. of Dairy Science, 85, No. 6, 1357-1361 (2002).
Rocha, L. and Ferreira, E.C. On-line Sim
Monitoring of Glucose and Acetate with FIA during High Cell Density Fermentation of
. Acta, 462, No.
esenvolvimento e Aplicação de Monitoração de trato por Modelo. Federal University
aldman, B. and Sucrose Enzymatic
, No. 4, 305-307,
., Barrera, P.R., Ayub, M.A.Z., Jr., M.B., Lactase
by Kluyveromyces
Kinetic Modeling. rd
ongress in Process na (2001).
K., Luong, J.H.T., Perrier, M. and Kamen, A., Adaptive Control at
of HEK-293 Cell logy Progress, 15,
Švitel, J., ýurilla, O. and Tkáþ J., Microbial Cell-lucose, Sucrose or iochem., 27,
153-C.G., Weigel, B., Hitzmann, B. Monitoring of
lycerol by Flow . Acta, 373, 57-62
mer, G., Schugerl, , F.. Analysis of rious Sugars by Means of Immobilized Enzyme Coupled Flow Injection Analysis. J. Biotechnology, 50, 93-106 (1996).
Xiaoan, W. and Bellgardt, K-H., On-line Fault Detection of Flow-injection Analysis Systems Based on Recursive Parameter Estimation. Anal. Chim. Acta, 313, 161-176 (1995).
Yu, D.L., Gomm, J.B. and Williams, D., Sensor Fault Diagnosis in Chemical Process via RBF Neural Networks. Control Engineering Practice, 7, 49-55 (1999).
olly, R.O.M., Valdman, B., Valero, F. and S Potentiometric Sensor for On-line Determination. Biotech. Tech.,10, 867-870 (1996). itzmann, B., Broxtermann, O., Cha, Y.-L.
O., Stärk, E. and Scheper, T., The C Glucose Co
obieh, of tch
Sensores e Sistemas de Biomassa, Etanol e de Subs D.Sc. Thesis (in Portuguese), Cultivation. Bioprocess Engineering, 23
337-341 (2000).
itzmann, B., Ritza, A., Ulber, R
o. 4,
nd ing
IA
of Rio de Janeiro, Brazil (2001). Salgado, A.M., Folly, R.O.M., V
Valero, F., Development of a Biosensor. Biotech. Tech., 12 1998.
Secchi, A.R., Longhi, L.G.S Schügerl, K. Neural Networks as a
Tool for the Evaluation and Analysis Signals. J. Biotech., 65, 15-22 (1998). äger, A. and Bilitewski, U., Screen-printed
Electrode for the Determination of Analyst, 119, 1251-1255 (1994).
iu, H. Haihong, L., Tailin, Y., Sun, K., Qi
zyme se.
nd
Trierweiler, J.O., Rech, R., Ferreira, L. S. and De Souza Production from Whey Cheese
Marxianus Yeast. Part II:
Qi, D. Amperometric Biosensor Sen Glucose and Lactose Based o immobilization of Ferro
ve to o-se, trin
Proceedings of 3 Mercosur C Engineering, Santa Fe, Argenti Siegwart, P., Cote, J., Male,
E-galactosidase and Mutarotase in E-cyc Polymer. Anal. Chim. Acta, 358, 137-144 iu, J. and Li, G., Application of Biosens
Diagnos
98). for ng.
Low Glucose Concentration Serum-free Cultures. Biotechno No. 4, 608-616 (1999). Sens. Act. B, 65, 26-31 (2000).
iu, W. An Extended Kalman Filter and Network Cascade Fault Diagnosis Str
eural for ss.
31-based Biosensor for Sensing G Lactose. Biotechnol. Appl. B 158 (1998).
Vega, F.A., Núnez, the Glutamic Acid Fermentation
Artificial Intelligence in Engineering, 140 (1999).
uo, R.F., Mistra, M. and sor
nd
and Ricci, J.C.D. On-line Galactoside Conjugates and G Injection Analysis. Anal. Chim Fault Detection via Multiscale Analy
Dynamic PCA. Industrial & Engineering C Research, 38, No. 4, 1489-1495 (1999).
mistry
ell, nd
(1998).
Weigel, B., Hitzmann, B., Kretz K., Huwig, A. and Giffhom Va
M.G., Neely, W.C. and Vodyanoy, V., R Sensitive Biosensor for Salmonella
Bioelec., 15, 135-141 (2000).