*e-mail: [email protected]
Effect of Different Approaches to Decouple the
Dependence of Nuclei-Liquid Surface Energy on Size and Temperature
Mara Cristina Freitasa, Dalmo Inácio Galdez Costaa, Aluísio Alves Cabralb*,
Adalto Rodrigues Gomesa, José Manuel Rivas Mercurya,c
a
Department of Mechanics and Materials – DMM – CEFET - MA, Brazil
bDepartment of Exact Sciences – DCE – CEFET - MA, Brazil
cAcademic Department of Chemistry – DAQ – CEFET - MA, Brazil
Received: October 27, 2008; Revised: February 14, 2009
Tests involving the Classical Nucleation Theory (CNT) often disregard the size dependence of surface energy. Thus, the surface energy of critical nuclei is assumed to be a macroscopic quantity that depends only on the temperature of a flat surface. However, because the size of critical nuclei changes with temperature, σcl(T) should be described as a function of both temperature and size of critical nuclei. The present work examines the temperature dependence of macroscopic surface energy, decoupling it from the size dependent part. Tolman, Rasmussen and Vogelsberger’s equations are used to decouple the dependence of surface energy on size, using experimental data for the following silicate glasses Li2O.2SiO2 (LS2) and Na2O.2CaO.3SiO2 (N1C2S3). These equations are successful in obtaining a decrease in σcl(T), in agreement with theoretical predictions. For all the values ofδ, Tolman’s equation produces the lowest values of σcl(T). Nevertheless, they are very close to the liquid/ vapor surface energy (σlv), which contradicts the Stefan’s rule (i.e. σcl/σlv << 1). Therefore, it is demonstrated that the assumption of the curvature dependence of surface energy does not suffice, per se, to explain the discrepancy between the experimental and theoretical values of nucleation rates.
Keywords: crystal nucleation kinetics, nuclei-liquid surface energy, decoupling equations
1. Introduction
The Classical Nucleation Theory (CNT) is well known for its good description of the temperature dependence of the nucleation rate, I(T). Nevertheless, CNT tests involving several silicate glasses that nucleate homogeneously have demonstrated that experimental crystal nucleation rates are much higher than theoretical ones1-5. These tests
consist of plotting Ln(Iη/T) vs. 1/T∆Gv2, where the intercepts and
slopes are proportional, respectively, to the pre-experimental factor and the surface energy of a flat interface. According to Cabral Jr.6,
this discrepancy persists even if different free energy expressions are used. These tests are often based on the assumption that surface energy does not change as a function of temperature and nucleus size.
Several assumptions have been investigated to explain the rea-sons for these discrepancies: i) metastable phase formation7-8; ii) the
influence of H2O content on crystal nucleation rates9; iii) the possible
breakdown of the Stokes-Einstein equation at (∆T/Tm ~ 0.5-0.6), which must not be applied to express the crystal nucleation kinetic as governed by viscous flow10; and iv) the absence of an experimental
technique to accurately determine the surface energy of nanometric aggregates independently of nucleation experiments11. Based on
the latter assumption, the CNT assumes that surface energy is a macroscopic thermodynamic property with a value equal to that of a planar interface, σ∞. In other words, surface energy is considered to be independent of nucleus size. This assumption is known as the capillarity approximation.
This discrepancy can be avoided by calculating a specific surface energy from experimental nucleation rate data at each temperature, using the theoretical value of the pre-exponential term. In this case, an increase in the temperature dependence of surface energy has been observed, as demonstrated by Turnbull12, Spaepen13 and James1.
On the other hand, Gutzow et al.14 demonstrated that the
crystal-melt surface energy, σcl, should decrease with increasing temperature,
mainly in cases where the molar volume of the liquid phase is higher than the corresponding one of the crystal phase. In addition, there is some experimental evidence that crystal-melt surface energy should decrease with increasing temperature11.
According to several researchers16-17, a plot of σ
cl(T) may indicate
a size effect, because the surface energy σcl(T, R) calculated from nu-cleation data refers to nuclei of critical size, R*. The latter parameter changes as a function of temperature.
Recently, Fokin & Zanotto11 applied the Tolman equation to
decouple the temperature and size-dependent parts of surface energy from the homogeneous crystal nucleation kinetics of Li2O.2SiO2 (LS2) and Na2O.2CaO.3SiO2 (N1C2S3) stoichiometric silicate glasses. Based on experimental data of crystal nucleation rates, viscosity, and induc-tion time, and on the difference between the volume free energies of glass and crystal, the authors demonstrated that the surface tension can decrease with temperature, since reasonable values were chosen for the Tolman parameter.
Taking into account the curvature dependence of surface tension, this paper focuses on the effects of the application of different expres-sions described in the literature on the decoupling of the temperature and size parts of surface energy. In addition to Tolman’s approach18,
the expressions derived by Vogelsberger15 and Rasmussen19 were also
applied to the crystal nucleation kinetics of LS2 and N1C2S3 silicate glasses to compare them with the σcl(T) results obtained by Fokin & Zanotto11 using only Tolman’s equation.
2. Theory
(
*)
exp D st W G I A k T + ∆ = ⋅ − ⋅ (1)
where Ist represents the number of nuclei formed per unit volume (m–3/s), A is a weakly temperature-dependent term, k is Boltzmann’s
constant, ∆GD (J/mol) is the kinetic barrier for nucleation (which cor-responds to the activation energy required to transport a structural unit through the nuclei/glass interface), and W* (J/mol) is the ther-modynamic barrier for the formation of critical size nuclei.
The pre-exponential term A is given by:
1 2 2 2 o A N kT ∞ λ σ
= ν
(2)
where N is the number of molecules with size λ per unit of volume, νo is the vibration frequency of a structural unit for typical
nuclea-tion temperatures, σ∞ corresponds to the free energy per unit area of crystal/melt flat interface, and h is Planck’s constant.
For spherical nuclei, W* is given by:
3 * 2 16 3 v W G ∞ pσ = ∆ (3)
where ∆GV (∆GV = ∆G/Vm) is the free energy change per unit volume of crystal, ∆G is the free energy change per mole, and Vm is the molar volume of the crystalline phase.
If one neglects a possible breakdown of the Stokes-Einstein equa-tion at deep undercooling (∆T/Tm ~ 0.5-0.6) and expresses the kinetic barrier in terms of viscosity, Equation (1) can be rewritten as:
( )
1(
)
2 * 5 2 exp st kT
I = σ −W kT
λ η (4)
If the kinetic barrier of nucleation, ∆GD, is expressed in terms of the induction period of nucleation, tind, Equation (1) can be trans-formed into Equation (5):
( )
1/22 3/2 2 3
2 2 16 16 exp 3 3 i m st
v ind v
N kT V
T
G t G kT
∞
p σ p σ
= −
∆ ∆ (5)
From Equation (1), one can see that the crystal nucleation rates can be strongly influenced by the values of W*. Therefore, if one neglects the strain energy associated with the formation of critical nuclei, the overall thermodynamic work, W, can be written as:
W = 4/3pR3∆G v - 4pR
2σ (6)
Several approximated equations have been derived to describe the curvature dependence of the crystal-melt surface energy, σ = σcl(R):
( )
21 cl R
R
∞ σ
σ = δ
+ , Tolman (7)
( )
(
1 2)
cl R ∞ δR
σ = σ − , Vogelsberger (8)
( )
( )
21 cl R ∞ δR
σ = σ − , Rasmussen (9)
where Tolman’s parameter, δ, characterizes the width of the interfa-cial region between the coexisting phases (whose order is of atomic dimensions).
It should be noted that these decoupling equations comprise a large range of σcl(R) values. Nevertheless, Schmelzer et al.15 have
demonstrated that the Tolman’s (Equation (7)), Vogelsberger’s ( Equation (8)) and Rasmussen’s (Equation (9)) expressions can be applied only to R >> δ, R >> 4δ and R >> 3δ, respectively. It should
be noted that the negative and infinitive values of σ obtained for small values of R/δ can be neglected.
3. Calculations
Experimental data of crystal nucleation rates, viscosity, induction time and thermodynamic quantities for the LS2 and N1C2S3 silicate glasses were selected from the literature, as indicated in Table 1.
The same values of δ used by Fokin & Zanotto11 were also used
here to evaluate σcl(R, T) through the decoupling equations for the silicate glasses investigated.
By combining Equation (6) and (7), one obtains:
(
)
3 3
4
4
3 v 2
W R G R
R
∞ σ
= p ∆ − p
+ δ (10)
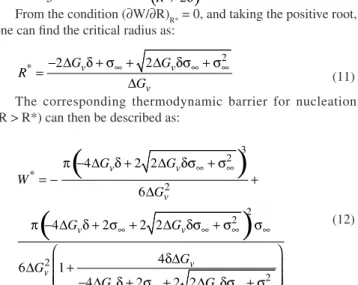
From the condition (∂W/∂R)R* = 0, and taking the positive root, one can find the critical radius as:
2
* 2 v 2 v
v
G G
R
G
∞ ∞ ∞
− ∆ δ + σ + ∆ δσ + σ
=
∆ (11)
The corresponding thermodynamic barrier for nucleation (R > R*) can then be described as:
(
)
(
)
3 2 * 2 2 2 2 24 2 2
6
4 2 2 2
4
6 1
4 2 2 2
v v v v v v v v v G G W G G G G G G G ∞ ∞ ∞ ∞ ∞ ∞ ∞ ∞ ∞
p − ∆ δ + ∆ δσ + σ
= − +
∆
p − ∆ δ + σ + ∆ δσ + σ σ
δ∆
∆ +
− ∆ δ + σ + ∆ δσ + σ
(12)
If one replaces Equation (12) with (4) or (5), only two parameters, σ¥ and d, will remain unknown in the resulting equation. In
posses-sion of all the experimental data – crystal nucleation rates, viscosity, induction time and difference in free energy per unit of volume – for each silicate glass investigated and at fixed values of δ, one can then determine the σ(T) dependence at different values of δ.
Similar procedures were employed to obtain the σcl(T) curves using the other decoupling equations (Equation (8) and(9)).
4. Results and Discussion
If one takes into account the dependence of surface tension on curvature, a significant quantitative change is expected in the work of critical cluster formation, as indicated in Figure 1. The typical values of the parameters used to calculate W as a function of the nucleus size for different approximations of σcl(R) are given in the caption of Figure 1.
It should be emphasized that to determine accurately the work of critical cluster formation, one should take into account the depend-ence of nuclei density on size, ρ(R)23. However, simulations carried
out by Fokin and Zanotto11 for a model glass demonstrated that W*
is weakly affected by ρ(R).
Additionally, as the temperature changes, one also expects a decrease in crystal density with temperature, ρ(T). However, the
Table 1. Sources of experimental data used to compute σ(T).
Glass I η τ ∆Gv Vm λ
results obtained by Fokin and Zanotto11 for a LS
2 glass demonstrated
that σcl(T) is weakly affected by ρ(T).
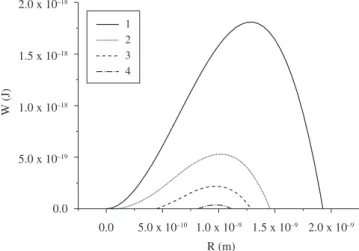
Hence, the calculations of σcl(R,T) presented in this paper dis-regarded the effects of ρ(R) andρ(T). Figures 2 and 3 show the σcl vs. T curves obtained for the LS2 and N1C2S3 glasses using viscosity data. The error bars indicated in each figure are between 0.3 and 1%. As expected, the σcl(T) plots obtained from experimental induction time data showed a behavior similar to that depicted in Figures 2 and 3 of this paper. Nevertheless, only the σcl(T) curves obtained from viscosity data are presented on Figures 2 and 3.
As can be seen in Figures 2 and 3, the σcl(R, T) curves calculated from viscosity follow the same tendency, i.e., σcl(Tolman) < σcl(Rasmussen) < σcl(Vogelsberger). This behavior is similar to that obtained by using the induction time as the kinetic barrier.
At temperatures below Tg, it is well known that the elastic strain resulting from the difference between the densities of glass and crystal can underestimate the driving force for crystallization and, hence, overestimate the thermodynamic barrier for nucleation, W*22.
Therefore, the slopes of the σcl(T) curves were estimated from tem-peratures higher than Tg. Figures 4 and 5 illustrate the behavior of
W (J)
R (m)
1 2 3 4
2.0 x 10⁻¹⁸
2.0 x 10⁻⁹
1.5 x 10⁻¹⁸
1.5 x 10⁻⁹
1.0 x 10⁻¹⁸
1.0 x 10⁻⁹
5.0 x 10⁻¹⁹
5.0 x 10⁻¹⁰
0.0
0.0
Figure 1. Calculated free energy changing of a model system due to the formation of nucleus as a function of size: (1) σ is size independent; (2) σ is size dependent (Equation (7)); (3) σ is size dependent (Equation (8)); (4)
σ is size dependent (Equation (9)). The following parameters were used:
∆GV = 4.08 x 10⁸ J/m3, σ
∞ = 0.262 J.m–2.
Temperature (K)
Temperature (K) Temperature (K)
680 700 720 740 760 780
0,148 0,150 0,152 0,154 0,156 0,158
σcl
(J.m
–2)
σcl
(J.m
–2)
σcl
(J.m
–2)
σcl
(J.m
–2)
680 700 720 740 760 780
0,24 0,25 0,26 0,27 0,28 0,29 0,30 0,31
Tolman Rasmussen Vogelsberger
Tolman Rasmussen Vogelsberger
Tolman Rasmussen Vogelsberger (a)
Temperature (K)
(c) (d)
(b)
680 700 720 740 760 780
0,26 0,28 0,30 0,32 0,34 0,36 0,38
680 700 720 740 760 780
0,28 0,30 0,32 0,34 0,36 0,38 0,40 0,42
Figure 2. Crystal-melt surface energy as a function of the temperature calculated for a LS2 glass, using viscosity data and the equations proposed by Tolman
(□), Rasmussen (○) and Vogelsberger (). The δ values used were: a) 0; b) 2.33 x 10⁻¹⁰ m; c) 3
x 10–10 m; d) 3.5
x 10–10 m. For δ = 0, the same values of σ cl
840 860 880 900 920 940 960 0,098
0,100 0,102 0,104 0,106 0,108 0,110 0,112 0,114
σcl
(J.m
–2)
σcl
(J.m
–2)
σcl
(J.m
–2)
σcl
(J.m
–2)
σcl
(J.m
–2)
σcl
(J.m
–2)
Temperature (K) (a)
Temperature (K) (c)
Temperature (K) (e)
Temperature (K) (f) Temperature (K)
(d) Temperature (K)
(b)
840 860 880 900 920 940 960 0,160
0,165 0,170 0,175 0,180 0,185 0,190 0,195 0,200 0,205
Tolman Rasmussen Vogelsberger
Tolman Rasmussen Vogelsberger
Tolman Rasmussen Vogelsberger
Tolman Rasmussen Vogelsberger Tolman Rasmussen Vogelsberger
840 860 880 900 920 940 960 0,19
0,20 0,21 0,22 0,23 0,24 0,25 0,26 0,27 0,28 0,29
840 860 880 900 920 940 960 0,24
0,26 0,28 0,30 0,32 0,34 0,36 0,38 0,40
840 860 880 900 920 940 960 0,26
0,28 0,30 0,32 0,34 0,36 0,38 0,40 0,42 0,44 0,46 0,48 0,50 0,52
840 860 880 900 920 940 960 0,26
0,28 0,30 0,32 0,34 0,36 0,38 0,40 0,42 0,44 0,46 0,48 0,50 0,52
Figure 3. Crystal-melt surface energy as a function of the temperature calculated for a N1C2S3 glass, using viscosity data and the equations proposed by Tolman
(□), Rasmussen (○) and Vogelsberger (). The δ values used were: a) 0; b) 2.95 x10⁻¹⁰ m; c) 4.5
x 10–10 m; d) 7,5
x 10–10 m; e) 8.65
x 10–10 m; f) 10–9 m. For
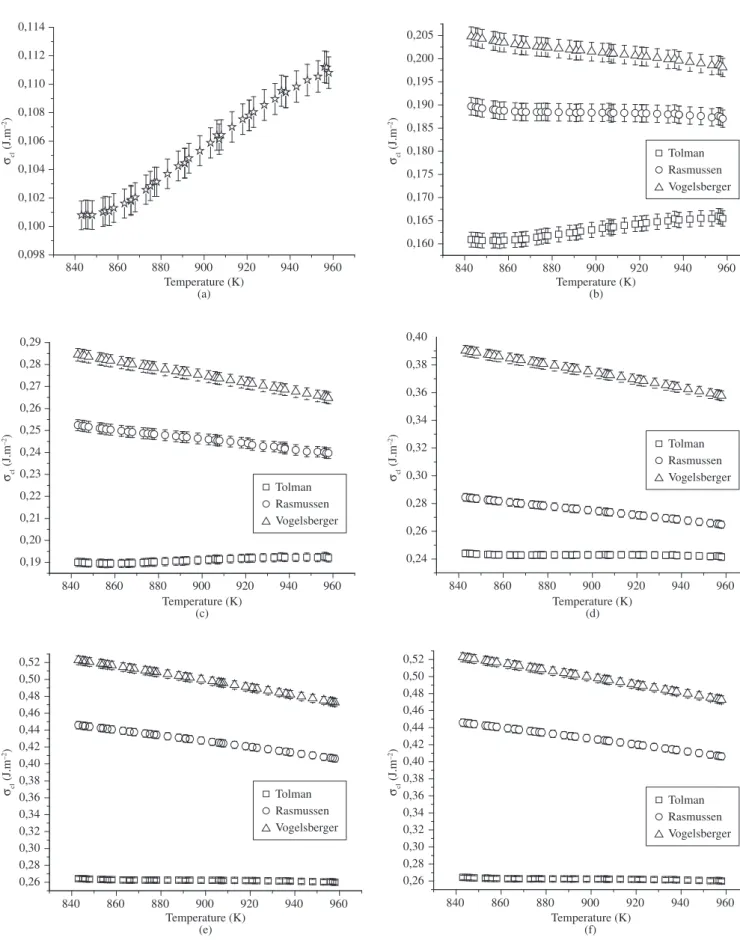
dσcl/dT as a function of λ for LS2 and N1C2S3 glasses, respectively. The dotted lines serve to guide the eyes, while the solid lines indicate the values of Tolman’s parameter at the point where dσcl/dT becomes negative.
From Figures 4 and 5, one can observe that dσcl/dT decreases gradu-ally, becoming negative as δ increases. Therefore, physically reason-able values of the Tolman parameter can be chosen in such way that a decrease in surface tension is obtained, as predicted by the CNT14.
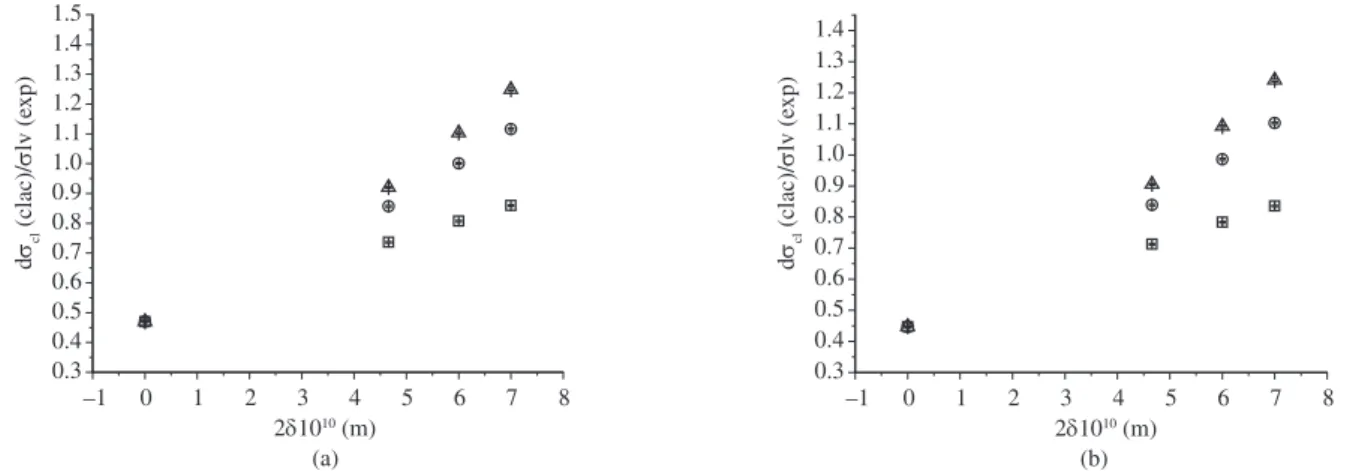
Nevertheless, one must analyze the physical meaning of the σcl values, which can done by calculating the ratio of σcl/σlv (σlv is the surface energy in the liquid). In line with Stefan23, σ
cl/σlv≅∆Hcl/∆Hlv
<<1; where ∆Hcl and ∆Hlv are, respectively, the melting enthalpy of the crystalline phase and the enthalpy of evaporation. Considering the σlv measured by Appen
26 for a Li
2O-SiO2 glass composition similar
to the one investigated here, we obtained a plot of the σcl/σlv ratio as a function of δ, as indicated in Figure 6.
–1 0 1 2 3 4 5 6 7 8
2.0 x 10⁻⁴
1.0 x 10⁻⁴
–1.0 x 10⁻⁴
–2.0 x 10⁻⁴
–3.0 x 10⁻⁴
–4.0 x 10⁻⁴
–5.0 x 10⁻⁴
–6.0 x 10⁻⁴
(a)
–1 0 1 2 3 4 5 6 7 8
(b) 0.0
2.0 x 10⁻⁴
1.0 x 10⁻⁴
–1.0 x 10⁻⁴
–2.0 x 10⁻⁴
–3.0 x 10⁻⁴
–4.0 x 10⁻⁴
–5.0 x 10⁻⁴
0.0
21010 (m) 21010 (m)
d
cl
/dT
, J/(K.m
−
2)
d
cl
/dT
, J/(K.m
−
2)
Tolman Rasmussen Vogelsberger
Tolman Rasmussen Vogelsberger
Figure 4. dσcl/dT as function of δ for a LS2 glassusing the Tolman, Rasmussen and Vogelsberger expressions, taking into account data of: a) viscosity, and b)
induction time.
Tolman Rasmussen Vogelsberger Tolman
Rasmussen Vogelsberger
0 5 10 15 20 0 5 10 15 20
(b) 2.0 x 10⁻⁴
1.0 x 10⁻⁴
–1.0 x 10⁻⁴
–2.0 x 10⁻⁴
–3.0 x 10⁻⁴
–4.0 x 10⁻⁴
–5.0 x 10⁻⁴
–6.0 x 10⁻⁴
0.0
d
cl
/dT
, J/(K.m
−
2) 1.0 x 10⁻⁴
–1.0 x 10⁻⁴
–2.0 x 10⁻⁴
–3.0 x 10⁻⁴
–4.0 x 10⁻⁴
–5.0 x 10⁻⁴
0.0
d
cl
/dT
, J/(K.m
−
2)
(a)
21010 (m) 21010 (m)
Figure 5. dσcl/dT as function of δ for a N1C2S3 glassusing the Tolman, Rasmussen and Vogelsberger expressions, taking into account data of: a) viscosity, and b) induction time.
–1 0 1 2 3 4 5 6 7 8
0.3 0.4 0.5 0.6 0.7 0.8 0.9 1.0 1.1 1.2 1.3 1.4 1.5
–1 0 1 2 3 4 5 6 7 8
0.3 0.4 0.5 0.6 0.7 0.8 0.9 1.0 1.1 1.2 1.3 1.4
d
cl
(clac)/
lv (e
xp)
d
cl
(clac)/
lv (e
xp)
(a) 21010 (m)
(b) 21010 (m)
Figure 6. Comparison of σcl(calc)/σlv(exp) for the LS2 glass using Tolman, Rasmussen and Vogelsberger expressions. Data of a) viscosity, and b) induction time
Taking into account the Rasmussen and Vogelsberger equations, one can observe from Figure 6 that for values of the Tolman’s param-eter (δ≥ 6 x 10⁻¹⁰ m) the nuclei/liquid interfacial tension (σ
cl) values
are larger than the liquid/vapor ones (σlv) i.e. σcl/σlv>>1. The reason for this result is not clearly understood at this time.
Applying Tolman’s equation, one can observe that σcl/σlv → 1. This result also contradicts the one given by Stefan’s rule.
5. Conclusions
The analysis of the curvature dependence involved the follow-ing silicate glasses that exhibit internal nucleation kinetics: LS2 and N1C2S3. In addition to the Tolman equation, the expressions proposed by Rasmussen and Vogelsberger were also applied to decouple the temperature and size parts of surface energy.
The σlc(T) curves obtained were plotted from experimental data of viscosity, crystal nucleation rate, thermodynamic free energy and induction time. The curves demonstrated that all the decoupling equa-tions used in this work were successfully applied to produce decreas-ing temperature dependence, in agreement with the results obtained by Fokin & Zanotto11, that applied only the Tolman equation. However,
the lowest values of σcl(T) were obtained with Tolman’s expression. This was reinforced by the σcl/σlv curves plotted for a LS2 glass.
Despite the lowest values of σlc(T), a more detailed analysis of the surface energy values was carried out for the LS2 glass using Stefan’s rule, which suggests that σcl/σlv << 1. As can be seen in Figure 6, this ratio does not agree with that prediction.
Therefore, it is evident that the assumption of the curvature dependence of surface energy does not suffice, per se, to explain the discrepancy between the experimental and theoretical values of nucleation rates.
Acknowledgements
The authors gratefully acknowledge the Brazilian research funding agencies CNPQ (# 620249/2006-4), FINEP, CAPES and FAPEMA for their financial support of this investigation.
References
1. James PF. Kinetics of crystal nucleation in lithium silicate glasses. Physics and Chemistry of Glasses. 1974; 15(4):95-105.
2. Zanotto ED, James PF. Experimental tests of the classical nucleation theory for glasses. Journal of Non-Crystalline Solids. 1989; 74(2-3):373-394. 3. Rowlands EG, James PF. Analysis of steady-state crystal nucleation rates
in glasses: part 2: Further comparison between theory and experiment for lithium disilicate glass. Physics and Chemistry of Glass. 1979; 20(1):1-14.
4. Gonzalez-Oliver CJR. Crystal nucleation and growth in soda-lime-silica glasses [tese]. Sheffield: University of Sheffield; 1979.
5. Fokin VM, Kalinina AM, Filipovich VN. Nucleation in silicate glasses and effect of preliminary heat treatment on it. Journal of Crystal Growth.
1981; 52(part 1):115-121.
6. Cabral Jr AA. Critical cooling rates on silicate glasses that nucleate homogeneously [dissertação]. São Carlos: Federal University of Sao Carlos; 1995.
7. Zanotto ED. Metastable phases in lithium dissilicate glasses. Journal of Non-Crystalline Solids. 1997; 219:42-48.
8. Soares Jr PC, Zanotto ED, Fokin VM, Jain H. TEM and XRD study of early crystallization of lithium disilicate glasses. Journal of Non-Crystalline Solids. 2003; 331(1-3):217-227.
9. Davis MJ, Ihinger PD, Lasaga AC. Influence of water on nucleation kinetics in silicate melt. Journal of Non-Crystalline Solids. 1997; 219:62-69.
10. Fokin VM, Zanotto ED, Schmelzer JWP, Potapov OV. New insights on the thermodynamic barrier for nucleation in glasses: the case of lithium disilicate. Journal of Non-Crystalline Solids. 2005; 351(18):1491-1499.
11. Fokin VM, Zanotto ED. Crystal nucleation in silicate glasses: the temperature and size dependence of crystal/liquid surface energy. Journal of Non-Crystalline Solids. 2000; 265(1-2):105-112.
12. Turnbull D. Formation of crystal nuclei in liquid metals. Journal of Applied Physics. 1950; 21(10):1022-1028.
13. Spaepen F. Homogeneous nucleation and the temperature dependence of the crystal-melt interfacial tension. Solid State Physics. 1994; 47:1-30.
14. Gutzow I, Kashchiev D, Avramov I. Nucleation and crystallization in glass-forming melts: old problems and new questions. Journal of Non-Crystalline Solids. 1985; 73(1-3):477-499.
15. Schmelzer JWP, Gutzow I, Schmelzer Jr. J. Curvature-dependent surface tension and nucleation theory. Journal of Colloid and Interface Science. 1996; 178(2):657-665.
16. Weinberg M, Zanotto ED, Manrich S. Classical nucleation theory with a size dependent interfacial tension: Li2O.2SiO2 crystal nucleation. Physics
and Chemistry of Glasses. 1992; 33(3):99-102.
17. Kožĺšek Z. Influence of the curvature dependence of interfacial energy on homogeneous nucleation kinetics. Crystal Research and Technology.
1991; 26(1):3-10.
18. Tolman RC. The effect of droplet size on surface tension. The Journal of Chemical Physics. 1949; 17(3):333-337.
19. Rasmussen DH. Thermodynamics and nucleation phenomena: a set of experimental observations. Journal of Crystal Growth, 1982; 56(1):56-66.
20. Fokin VM. 2006. [Personal Comunication].
21. Schmelzer JWP, Mahnk R. General formulae for the curvature dependence of droplets and bubbles. Journal of the Chemical Society, Faraday Transactions. 1986; 82(1):1413-1420.
22. Fokin VM, Zanotto ED, Yuritsin NS, Schmelzer JWP. Homogeneous crystal nucleation in silicate glasses: a 40 years perspective. Journal of Non-Crystalline Solids. 2006; 352(26-27):2681-2714.
23. Stefan J. Ueber die beziehung zwischen den theorien der capillarität und der verdampfung. Annalen der Physik und Chemie, 1886; 265(12):655.