www.nat-hazards-earth-syst-sci.net/12/731/2012/ doi:10.5194/nhess-12-731-2012
© Author(s) 2012. CC Attribution 3.0 License.
and Earth
System Sciences
Sediment budget monitoring of debris-flow and bedload transport in
the Manival Torrent, SE France
J. I. Theule1, F. Li´ebault1, A. Loye2, D. Laigle1, and M. Jaboyedoff2
1Irstea Grenoble, Unit´e de Recherche ETNA (Erosion Torrentielle, Neige et Avalanches), Saint-Martin-d’H`eres, France 2Universit´e de Lausanne, Facult´e des G´eosciences et de l’Environnement, IGAR (Institut de G´eomatique et
d’Analyse du Risque), Lausanne, Switzerland
Correspondence to:F. Li´ebault (frederic.liebault@irstea.fr)
Received: 20 September 2011 – Revised: 20 January 2012 – Accepted: 31 January 2012 – Published: 23 March 2012
Abstract. Steep mountain catchments typically experience large sediment pulses from hillslopes which are stored in headwater channels and remobilized by debris-flows or bed-load transport. Event-based sediment budget monitoring in the active Manival debris-flow torrent in the French Alps dur-ing a two-year period gave insights into the catchment-scale sediment routing during moderate rainfall intensities which occur several times each year. The monitoring was based on intensive topographic resurveys of low- and high-order chan-nels using different techniques (cross-section surveys with total station and high-resolution channel surveys with terres-trial and airborne laser scanning). Data on sediment output volumes from the main channel were obtained by a sediment trap. Two debris-flows were observed, as well as several bed-load transport flow events. Sediment budget analysis of the two debris-flows revealed that most of the debris-flow vol-umes were supplied by channel scouring (more than 92 %). Bedload transport during autumn contributed to the sediment recharge of high-order channels by the deposition of large gravel wedges. This process is recognized as being fun-damental for debris-flow occurrence during the subsequent spring and summer. A time shift of scour-and-fill sequences was observed between low- and high-order channels, reveal-ing the discontinuous sediment transfer in the catchment dur-ing common flow events. A conceptual model of sediment routing for different event magnitude is proposed.
1 Introduction
Channelized debris-flows are common, natural processes in the French Alps. They typically occur in steep, small to average size mountain streams (torrents) and induce each year disturbances and/or damages to infrastructure. The most
striking feature of debris-flows is their ability to transport a considerable volume of sediment over long distances (typ-ically several kilometres) and at a relatively high velocity (generally between 2 to 20 m s−1). Poorly sorted sediments mixed with water and organic debris form destructive surges depositing on alluvial fans, most of them being urbanized. The prevention of natural hazards related to debris-flows re-quires a better understanding of sediment transfer in debris-flow catchments.
The volume of channelized debris-flows have frequently been identified as influenced by channel scouring along the flow path (see Hungr et al., 2005 for a recent review). Several case studies of debris-flows triggered by slope failures re-ported that the volume of initial failures were insignificant as compared to the total volume of the event (Benda and Dunne, 1987; Berger et al., 2011a; Remaˆıtre et al., 2005). Debris-flows incorporate in-channel sediment as they move down slope. This is known as debris-flow bulking and the rate at which debris-flows scour the channel is referred as the yield rate (expressed in m3per unit length of channel). Therefore, the presence of erodible sediment in headwater channels is recognized as a primary control on the timing and magni-tude of debris-flows (Jakob et al., 2005). Some authors pro-posed to discriminate supply- and transport-limited debris-flow catchments as a function of the sediment recharge rate for low-order channels, this being defined as the rate at which colluvium fills the scoured channel after the passage of a debris-flow (Bovis and Jakob, 1999). The higher the recharge rate is, the higher the susceptibility of the catchment to pro-duce a debris-flow during high-intensity rainfall events.
but the respective influence of both can be very different between investigated sites. Field studies of sediment trans-fer in Oregon’s steepland catchments revealed that low-order channels accumulate sediment input from hillslopes for thou-sands of years until a slope failure occurs and transforms into a debris-flow which scours the sediment of first- to second-order channels (Benda, 1990; Benda and Dunne, 1987). Given the nature of coarse sediments delivered to headwaters, common runoff events are unable to mobilize them as bedload and, therefore, sediments are accumulated for very long periods of time. Similar sequences of scour-and-fill were reported in other regions, but over much shorter timescales. A recent study of an alluvial fan in New Zealand revealed seasonal cut-and-fill sequences driven by successive wet and dry periods (Fuller and Marden, 2010). In this case, aggradation phases of the fan are related to large sediment influx from debris-flows during wet periods, when failures are triggered in the upper catchment. Degradation phases are related to bedload transport events during autumn. Ob-servations of a first-order channel in Japan showed sediment accumulation during winter freeze-thaw cycles, and channel scouring during summer convective storms (Imaizumi et al., 2006). Most of the sediment flushing was driven by debris-flows while bedload transport was considered as a minor sed-iment transport process. Annual sedsed-iment transfer investiga-tions in the Illgraben catchment (Switzerland) also revealed the importance of alternating scour and fill of the channel in the understanding of sediment transfer in complex debris-flow catchments (Berger et al., 2011a), however, interactions between debris-flow and bedload transport were not empha-sized.
Intensive seasonal field observations of the sediment cas-cade in steepland catchments prone to debris-flows are still lacking in the alpine environment and notably in catchments where sediment transfer is driven by both debris-flow and bedload transport. These two processes may occur during the same flow event, but some events do not produce debris-flows when bed material is entrained only by shear stress exerted from water flow. We refer the latter case as a bed-load transport event. This paper presents observations from frequent field surveys of sediment transfer in a debris-flow torrent in the French Alps, where sequences of scour-and-fill were studied at a seasonal timescale from first- to fourth-order channels. These observations allowed us to (1) quan-tify the relative contribution of channel scouring for debris-flow volumes, and to (2) characterise the seasonal cycles of scour-and-fill from low- to high-order channels with respect to the driving processes (debris-flow vs. bedload).
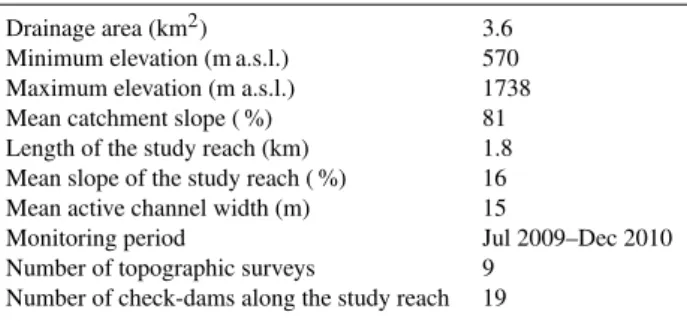
Table 1.General features of the Manival Torrent.
Drainage area (km2) 3.6
Minimum elevation (m a.s.l.) 570
Maximum elevation (m a.s.l.) 1738
Mean catchment slope ( %) 81
Length of the study reach (km) 1.8
Mean slope of the study reach ( %) 16
Mean active channel width (m) 15
Monitoring period Jul 2009–Dec 2010
Number of topographic surveys 9
Number of check-dams along the study reach 19
2 Material and methods
2.1 Study site
The Manival is a very active debris-flow torrent near Greno-ble in the Chartreuse Mountains of the Northern French Pre-alps (Fig. 1). It flows intermittently into the Is`ere River in the Gr´esivaudan valley. The high frequency of debris-flow events (one every year since 2008), easy access through-out the main channel and presence of a large sediment trap (25 000 m3)in the channel (protecting the urbanized alluvial fan against debris-flows) makes the Manival site suitable for implementing a monitoring programme of sediment transfer associated with debris-flows. The 1.8-km study reach ex-tends from the apex of the alluvial fan to the sediment trap.
The 3.6-km2 catchment above the sediment trap has 1130 m of relief with a mean catchment slope of 81 % (Ta-ble 1). Bedrock is composed of highly fractured, alternating sequences of Jurassic marls and limestones. A long reverse fault runs through the axis of the catchment with secondary faults found regularly on the head and east side of the catch-ment. The bedrock is covered by thick colluvial deposits which are mobilized by shallow landslides, hillslope debris-flows and snow avalanches. Limestone rock faces are prone to active rockfall which supplies debris to talus slopes. Dur-ing the snowmelt season, gullies located below rock faces can experience one rockfall every 5 to 10 min (according to the authors’ field experiences). Detailed descriptions of the geologic structure, including a 3-D geologic diagram of the Manival catchment, are found in Loye et al. (2012).
The mean annual precipitation measured at the nearest me-teorological station (Saint-Hilaire-du-Touvet) is 1450 mm. Precipitation consists of intense rainfall from convective storms in spring and summer (May to September) where debris-flows typically occur, steady low-duration rainfall in the autumn (September to December) where bedload trans-port occurs, and snow in the winter (January to March) when the channel is dormant.
A
B
Sediment Trap
Fig. 1. (A)Orthophoto view of the Manival catchment (image @ Aerodata International Surveys) located at 45◦17′N, 5◦49.75′E;(B)shaded relief map of the Manival study reach derived from airborne LiDAR surveys, displaying locations of cross-sections, check-dams and laser scanned areas; Sites S1–S3 refer to multi-scanned headwater reaches (Fig. 9).
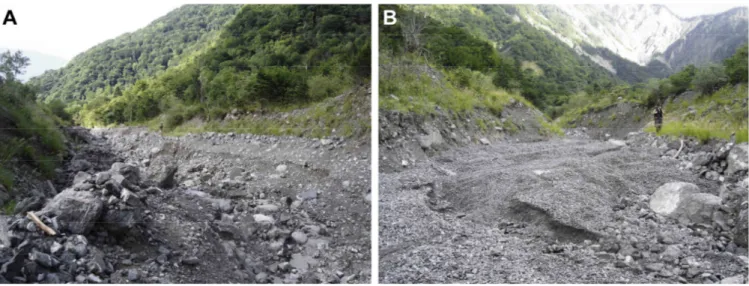
(range: 10–20 m) and presents a typical morphology of a debris-flow scoured channel with levees, boulder fronts and coarse lags (Fig. 2a). It is entrenched into the wide alluvial fan (40 to 250-m wide, increasing downstream). Macroforms related to bedload transport are observed along the main channel. They can be defined as gravel wedges with well sorted grain-size distributions (Fig. 2b). These macroforms partly or totally fill the debris-flow scoured cross-sections
and reveal that bedload transport is an important component of the torrent sediment budget. Further geomorphic descrip-tions can be found in previous works (Peteuil et al., 2008; Veyrat-Charvillon and Memier, 2006).
Fig. 2.Views looking downstream and upstream from XS 19 (Fig. 1) in the Manival study reach showing(A)debris-flow levees and coarse lags and(B)gravel wedges filling the U-shape debris-flow channel.
concrete check-dams are present along the upper part of the study reach between the surveyed cross-sections 24 and 39 (see Sect. 2.2.1). Before the 1970s, debris-flows propagated in the upper fan through several active channels, but to avoid the maintenance of check-dams along secondary channels, the ONF-RTM38 decided to concentrate debris-flows along one single channel constrained in the right-side of the fan by embankment works (gravel levees). Archive analysis of the Manival flood history during the last two centuries showed that the torrent can produce large debris-flows ranging from 10 000 to 60 000 m3 (Peteuil et al., 2008). Lopez Saez et al. (2011) presents further details on the debris-flow history of the Manival with these archives and the reconstruction of past debris-flow events using dendrogeomorphology. Since 2008, the Manival has produced one debris-flow each year depositing into the sediment trap.
2.2 Sediment budget
2.2.1 Channel storage changes
Multi-date topographic surveying of cross-sections were used for monitoring channel storage change in the study reach of the Manival torrent. Cross-sections were regularly spaced along the study reach, paying special attention to sample sections where channel deformation (scour-and-fill) was expected to be active. Thirty-nine cross-sections were deployed along the 1.8-km study reach of the Manival, giv-ing a mean cross-section spacgiv-ing of 46 m (3 times the mean active channel width) (Fig. 1). Wooden stakes on top of the channel banks were installed for cross-section benchmark-ing. Points were surveyed along transverse lines at each break of slope and each measurement point was marked with spray paint. This saved time during subsequent surveys by
only measuring the active portion of the cross-section (the portion with paint marks was no longer visible). The mean point spacing was 1.3 pts m−1. Two days were required for surveying all of the cross-sections. Topographic surveys were measured with a total station (Leica Flexline TS02). The manufacturer’s electronic distance measurement preci-sion is 1.5 mm±2 ppm, and the angular resolution is 7′′ or
3.4 mm of precision at a distance of 100 m. The total station was benchmarked on permanent points of alluvial terraces.
The time frequency of topographic surveys was controlled by the occurrence of competent flow events (flow events that induce a morphological response of the channel), but the time-lapse between two successive events was sometimes too short to permit a perfect match between events and surveys. Eight post-event surveys were measured since Spring 2009, two surveys were done after debris-flow events of moderate intensity. It is important to mention that the debris-flows in this torrent are often in the form of multiple surges (eye wit-ness reported 4 surges with 10 min intervals for one debris-flow). Therefore, topographic surveys capture the time-integrated volume change of the torrent during the event. For this paper, the two types of events are characterised:
– A debris-flow event consisting of multiple surges, also including secondary bedload transport. Typical field in-dicators are unsorted levee, lobe, lag and terminal de-posits with a fine sediment matrix. The secondary bed-load transport can sometimes deposit sorted unconsoli-dated gravels in the thalweg.
develop into large wedges reaching bankfull. No debris-flow field indicators are present.
Cross-sections were used for quantifying volumes of ero-sion and deposition in the channel and back-calculating bed-material sediment transport using the morphological method (Ashmore and Church, 1998), widely applied for balancing sediment budgets in gravel-bed rivers (Ferguson and Ash-worth, 1992; Martin and Church, 1995; Raven et al., 2009; Reid et al., 2007). Volumes of deposition (VD)and erosion (VE)between cross-sections are obtained by the following: VE=
AE(n)+AE(n+1)
2 L(n,n+1) (1)
VD=
AD(n)+AD(n+1)
2 L(n,n+1) (2)
with L, the streamwise distance between the two cross-sections n and n+1, and AE and AD the cross-sectional area of erosion and deposition, respectively. The net stor-age changeδV between two surveys for the channel reach between two cross-sections is determined by the difference of the two volumesVD andVE. The principle of mass con-servation is used to determine the coarse sediment transport for each reach with:
Vo=Vi−δV (3)
with Vo the sediment output and Vi the sediment input. Through monitoring sediment outputs at the downstream end of the study reach, the sediment transport and the sediment input can be determined for each sub-reach comprised be-tween two cross-sections.
Uncertainties of erosion or deposition volume estimates for each sub-reach, σV, were calculated according to the
propagation of uncertainty’s law of Taylor (see Reid et al., 2007 for details):
σV= s
σAn
δV
δAn
2
+
σAn+1
δV
δAn+1
2
+
σLn,n+1
δV
δLn,n+1
2
(4) The termsσAn andσAn+1 respectively refers to errors
asso-ciated with cross-sectional area of erosion or deposition at cross-sectionsnandn+1, respectively, andσLn,n+1 refers to
the error associated with the distance between cross-sections
nandn+1. Cross-sectional areas of erosion (AE)or deposi-tion (AD)were calculated by the following:
AE=
n X
i=1
e
i+ei+1 2
di,i+1 (5)
AD=
n X
i=1
f
i+fi+1 2
di,i+1 (6)
withei, the erosion depth at pointi,fi, the deposition depth
at pointianddi,i+1the distance between pointsiandi+1.
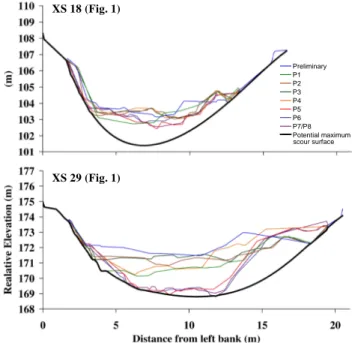
XS 18 (Fig. 1)
XS 29 (Fig. 1)
Preliminary P1 P2 P3 P4 P5 P6 P7/P8 Potential maximum s m scour surface
Fig. 3. Examples of Manival cross-section interpretations for deter-mining the maximum debris-flow scour surface from best-fit poly-nomial curves; the XS 18 shows a maximum scour surface con-strained only by the bank slopes, since the lowest elevation reached over the monitoring period did not excavate the channel up to the coarse lag layer; XS 29 shows a polynomial fit constrained by the lowest elevation over the monitoring period, since the presence of a coarse lag formation suggests that the channel will not deepen any further; thin coloured lines: cross-section resurveys over the moni-toring period (P1–P8); thick black line: maximum debris-flow scour surface derived from polynomial fit.
Therefore,σAused in Eq. (4) can be calculated using the
Tay-lor’s propagation of uncertainty with individual errors asso-ciated withei,fi anddi,i+1. Erosion and deposition depths were calculated as elevation differences between two suc-cessive surveys. We assumed that the uncertainty of eleva-tion measurements was equivalent to theD84of the bed sur-face grain-size distribution of the channel, which is approxi-mately 5 cm for the Manival (measured by Wolman’s pebble counts on 100+ particles). A similar value was attributed to the error associated with the distance between two succes-sive points, since the position of the prism during surveys is influenced by the roughness of the bed. The error asso-ciated with the curvilinear distance between two successive cross-sections was measured on a high-resolution digital ter-rain model (DTM) derived from an airborne laser scan (ALS) and was attributed a value of 1 m, corresponding to the pixel size of the DTM.
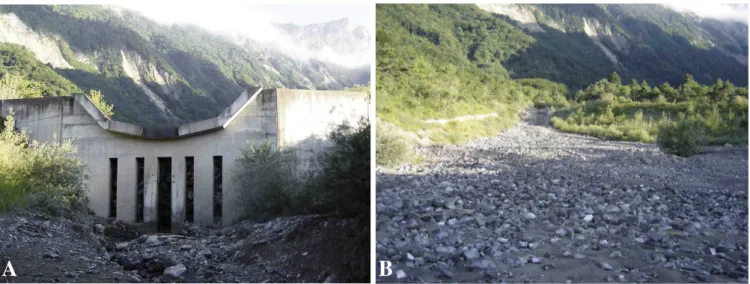
2.2.2 Sediment output
A
B
Fig. 4.View of the sediment trap after a debris-flow with(A)the dam blocked by the boulder front with tree debris and(B)the rest of the trap filled with finer sediment.
in 1926 and was closed since 1991 by a 5-m high concrete dam with sluice openings allowing water and fine sediment to pass through the dam, trapping only the coarse fraction of the sediment transport (Fig. 4). Since it can be expected that the trapping efficiency of the check-dam is not 100 %, resurveys of the sediment trap may only give a lower-bound estimate of the sediment output. Nevertheless, several observations lead us to consider sediment losses as negligible during the monitoring period. We observed that bedload deposits never reached the distal end of the trap during the recorded events. We also observed that debris-flows were slowly moving in the trap and they progressively reached the dam with a boul-der front obstructing the sluice openings. The strong channel incision observed downstream from the dam, which indicates sediment starvation, also suggests a high trapping efficiency. Most surveys of deposition in the sediment trap (4 of 5) were measured with the Leica TS02 total station. These sur-veys were subtracted from a terrestrial laser scan (TLS) of the empty sediment trap surveyed at the onset of the monitor-ing program. TLS surveys were measured with an ILRIS-3D (Optech Inc.) terrestrial laser scanner, with a 1535 nm laser giving a minimum footprint of 22 mm at 100 m. This TLS has a laser repetition rate of 2000 Hz, with a maximum range of about 1200 m for 80 % reflectivity surfaces. The manufac-turer’s precisions of the TLS are 7 mm for distance, 8 mm for position and 80 µrad for angle. The minimum point spacing is 2 cm at 1000 m.
Overall point densities of the total station surveys were comprised of between 0.08 to 0.23 pts m−2. The deposition surface was smooth and conical, however, to get a more re-liable representation of the deposition surface, we increased the density of surveyed points in areas with irregular topog-raphy and each break of slope was carefully sampled dur-ing the survey. Total station measurements were manually aligned with the previous TLS survey using 7 to 10 tie points
(check-dams corners and edges) by using IM Align mod-ule on the software PolyworksTM of InnovMetric. The un-certainty associated with deposition volume estimates was assessed by calculating the propagated uncertainty related to two parameters: (i) the surface roughness which was at-tributed to a value corresponding to theD75 of the surface grain-size distribution for debris-flow deposits (0.07 m) and bedload deposits (0.05 m), and (ii) the standard deviation of alignment error of the tie points which ranges from 0.05 to 0.10 m.
One post-event survey was measured with the TLS. For the sediment trap, TLS surveys required less than one hour with a final point spacing less than 2 cm and a maximum root-mean-square error (RMS) between the multi-date cloud points of
±0.02 m (detailed TLS methods are presented in Sect. 2.3). Sediment trap surveys were measured during the cross-section survey campaign, except when sediment deposition was not visible in the sediment trap or when a substantial part of the deposit was removed by dredging operations. The sediment trap is managed by a private company in charge of dredging operations to maintain a full capacity over time. Generally, the time lapse between the flow event and the dredging works was long enough to implement a topographic survey. For three out of eight times, the trap was disturbed af-ter small floods. The outputs in these situations had to be es-timated according to sediment yields determined from cross-section surveys.
2.3 Sediment supply from low-order headwaters
third-order steep-slope channel reaches confined between eroding hillslopes directly delivering sediments to the chan-nel by shallow landsliding and hillslope debris-flows initiated on talus slopes (denoted, respectively, as S2 and S3). Gen-eral characteristics of these 3 areas are presented in Table 2. The S1 site was accessible on a trail and can be seen from a view point with optimal angle and coverage. S2 and S3 sites were chosen because of having safe viewable locations and they are reaches between the first-order to the main torrent channel.
The TLS data were collected on a seasonal basis during 2009 (April, July, August and November). Scanning posi-tions for S1 were taken both within the channel and across the upper catchment using 2 to 8 locations with distances ranging from 2 to 600 m. S2 required two to three scanning positions with distances of 20 to 450 m. S3 required one po-sition at a maximum distance of 250 m. In order to save time in the field, long range scans had a maximum point spacing of 0.1 m which can vary according to shadow effects (chan-nel areas hidden by terrain obstructions from the laser).
The ALS survey for the entire catchment was flown by he-licopter in June 2009 by a private company (Sintegra) using a 200 kHz Riegl LMS Q560 laser scanner. The flight elevation fluctuated between 450 and 650 m above ground, with a max-imum instantaneous scan angle of 25 degrees, giving a laser footprint range between 0.16 and 0.24 m for flat terrains. The mean density of the filtered point cloud was 6.9 pts m−2and the altimetric and planimetric errors were 0.10 and 0.15 m, respectively. However, with the raw LiDAR data for the 3 sites, sparse vegetation cover was manually cleaned pre-serving a point density up to 30 pts m−2. Manually cleaning refers to identifying and selecting the backscattering from vegetation in the scan’s point cloud and deleting it rather than using automatic filters.
The multi-date scans (ALS and TLS) were merged and aligned on IM Align module on the software PolyworksTM of InnovMetric. With the IM Align, identifiable permanent structures such as check-dams can be selected as tie points for different scans, the point clouds of these features can then be aligned with the Automatic Iterative Closest Point algorithm (Besl and McKay, 1992). Digital Elevation Mod-els (DEMs) with 0.1 m resolution were created by ordinary kriging interpolation for the TLS data. This interpolation method was chosen because the resulting relief representa-tion was qualitatively identified as the most reliable to the field morphology. The DEM from the ALS data was cre-ated with a linear drift kriging for smoothing high density linear swaths of points in the airborne scans. These DEM lay-ers were used to create classical DEM of differences (DoD) for calculating volumes of erosion and deposition. The un-certainty associated with volume estimates was assessed by using IM Align to find the maximum RMS of alignments between the multi-date point clouds (±0.08 m) covering
ar-eas with permanent structures (Iavarone and Vagners, 2003; Rabatel et al., 2008).
2.4 Initial channel storage quantification
The volume of sediment storage in the main channel of the torrent was estimated at the onset of the monitoring. The objective was to determine the boundary conditions of the captured storage changes over the monitoring period and to evaluate the fraction of the total alluvial sediment reservoir that is remobilised during debris-flows. The Manival torrent has limited lateral migration with well-defined channel banks where the susceptible areas are controlled by the engineering works of the RTM services. This provides realistic estima-tions of connected channel storage to the sediment trap.
Channel storage att0 (6 July 2009) was obtained by the “sloping local base level” (SLBL) method (Jaboyedoff and Derron, 2005). The SLBL has been initially defined as a sur-face above which has rocks that are assumed to be erodible by landsliding (Jaboyedoff et al., 2004) and the method was adapted to estimate the sediment infilling of glacial U-shape valleys (Jaboyedoff and Derron, 2005; Otto et al., 2009). The general principle is to deepen DTM pixels included in the alluvial fill by an iterative routine until an assumed bedrock surface shape is reconstructed. The surface geometry was de-termined by quadratic equations. Cross-sections in the Mani-val are located in the main channel of the alluvial flat where a U-shape is most likely to form (validated with multi-date cross-section overlays). Therefore, it seemed relevant to use the SLBL method for quantifying the volume of erodible sed-iment by debris-flows along the main channel of the Manival. In this case, the maximum scour surface is not controlled by bedrock because the thickness of alluvial fill is much greater than the maximum potential scouring depth of debris-flows (which we estimated around 4 to 5 m). The main channel is entrenched in the alluvial fan with a general range of thick-ness from 10 to 30 m.
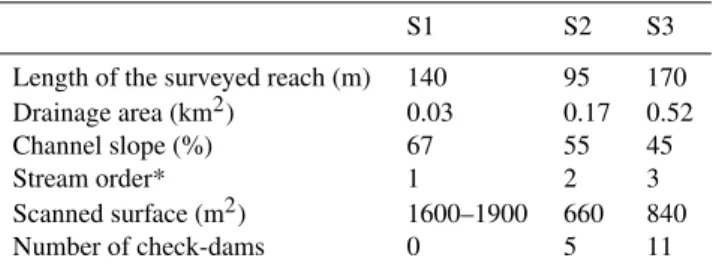
Table 2.General features of the three headwaters in the Manival catchment dedicated to the monitoring of sediment supply from hillslopes by LiDAR resurveys.
S1 S2 S3
Length of the surveyed reach (m) 140 95 170
Drainage area (km2) 0.03 0.17 0.52
Channel slope (%) 67 55 45
Stream order* 1 2 3
Scanned surface (m2) 1600–1900 660 840
Number of check-dams 0 5 11
* Based on LiDAR-derived DTM stream network.
this lowest elevation corresponds to the presence of older highly consolidated coarse lag (similar in strength to soft bedrock) preventing deeper scour during subsequent flows (Fig. 3). This procedure allowed for calculating the sedi-ment storage in the main channel and controlling the SLBL-derived sediment volume.
2.5 Rainfall monitoring
Two tipping bucket rain gauges (Rainwise Inc.) with a 196-mm diameter and resolutions of 0.12 and 0.16 196-mm were used for rainfall monitoring in the catchment. The rain gauges are connected to a data logger recording instantaneous time of tips and allowing computation of rainfall intensity at vary-ing time intervals. The first was installed in October 2008 at the apex of the alluvial fan (Fig. 1), at an elevation of 860 m a.s.l. The second was installed on the catchment ridge in July 2010 at an elevation of 1490 m a.s.l. We chose open sites easily accessible from the road to facilitate regular visits of the instrument for maintenance and data collecting. The two rain gauges are spaced 1.1 km apart, and they both gen-erally showed similar rainfall readings in the Manival during the summer. From autumn to spring the upper rain gauge is susceptible to snow cover and melt. Therefore, the lower rain gauge was used for analysis because of its continuous recording from the beginning of the monitoring program.
3 Results
3.1 Rainfall and channel responses
Despite rainfall of low to moderate intensity during the mon-itoring period (less than one to two year return period) (Ta-ble 3, Fig. 5), considera(Ta-ble channel responses were ob-served along the torrent. Eight periods of significant ge-omorphic activity were observed along the study reach be-tween July 2009 and December 2010 (denoted as P1 to P8), two of these periods being characterised by the occurrence of a debris-flow (August 2009 and June 2010). The maxi-mum daily rainfall was observed during P1, with a value of 34.7 mm. A frequency analysis of maximum daily rainfall
based on the nearest long-term rainfall time series (M´et´eo France station of Saint-Hilaire-du-Touvet, 1964–2010, ele-vation of 970 m a.s.l, located 5 km from the Manival, on the same mountain side) gave a 10-yr daily rainfall of 88 mm (90 % confidence interval: 83–94 mm). This calculation was based on a monthly sampling of maximum daily rainfall to increase the size of the sample and to provide a more ac-curate estimate of extreme rainfall (Djerboua, 2001; Djer-boua and Lang, 2007). According to the fitted probability law, the return period of the maximum 24 h rainfall observed during the monitoring period was 1.0 yr. The maximum 5-min rainfall intensity was recorded during P6, with a value of 79 mm h−1. This high-intensity storm event did not initi-ate any debris-flow in the catchment. Debris-flows occurred during P1 and P5, when maximum rainfall intensities were 49 and 25 mm h−1, respectively. The minimum rainfall in-tensity associated with an observable channel response was 7 mm h−1during P3 and P8.
3.2 Torrent sediment budgets
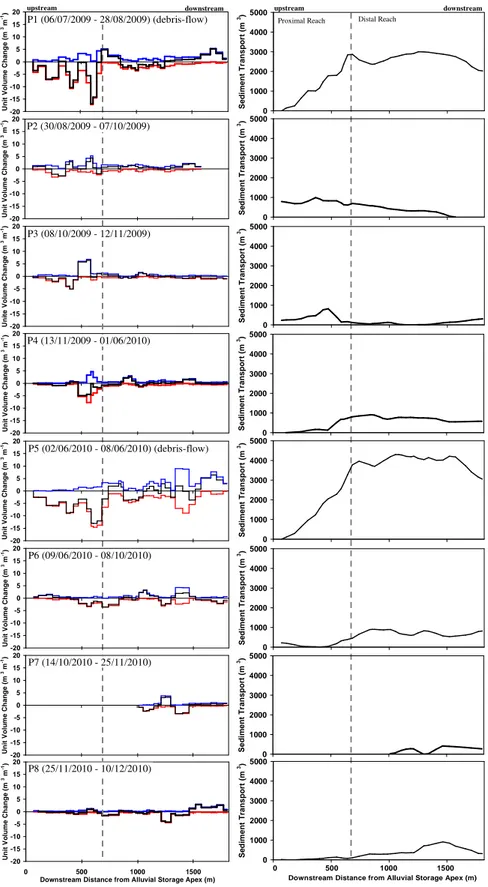
Sediment budgets reconstructed for the Manival during the eight investigated periods are summarized in Table 4. Unit volume changes (including yield rates) for these periods are reconstructed from the cross-section resurveys (Fig. 6). The high yield rates from the debris-flows (P1 and P5) identifies the extent of entrainment which can divide the torrent chan-nel into two sections, the proximal and distal reach in ref-erence to the apex of the alluvial fan. Sediment transport volumes were computed by first cumulating the unit volume change and then they are readjusted so that the output vol-umes match the sediment trap volvol-umes (Fig. 6).
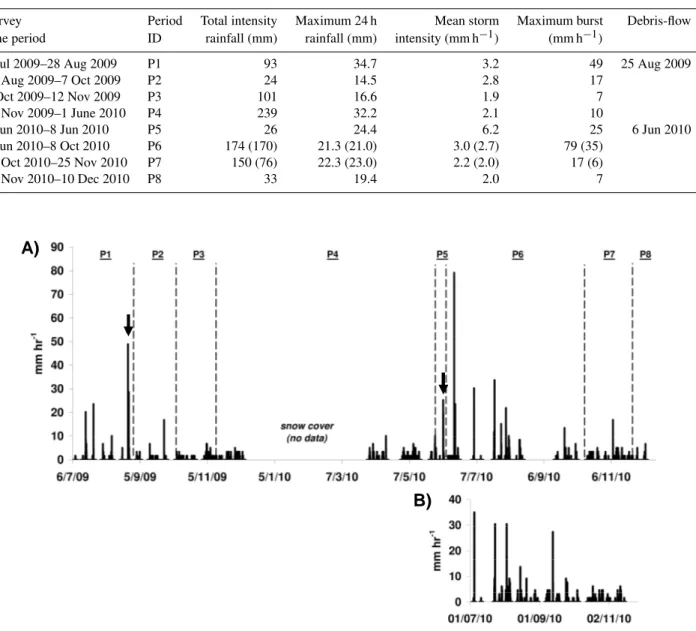
Table 3.Summary values of rainfall for each monitoring period of channel storage changes; mean and maximum intensities are calculated for a 5 min time-interval; rainfall data from the rain gauge at the Manival ridge are indicated in brackets and showed similar values to the rain gauge located near the main channel.
Survey Period Total intensity Maximum 24 h Mean storm Maximum burst Debris-flow
time period ID rainfall (mm) rainfall (mm) intensity (mm h−1) (mm h−1)
6 Jul 2009–28 Aug 2009 P1 93 34.7 3.2 49 25 Aug 2009
30 Aug 2009–7 Oct 2009 P2 24 14.5 2.8 17
8 Oct 2009–12 Nov 2009 P3 101 16.6 1.9 7
13 Nov 2009–1 June 2010 P4 239 32.2 2.1 10
2 Jun 2010–8 Jun 2010 P5 26 24.4 6.2 25 6 Jun 2010
9 Jun 2010–8 Oct 2010 P6 174 (170) 21.3 (21.0) 3.0 (2.7) 79 (35)
14 Oct 2010–25 Nov 2010 P7 150 (76) 22.3 (23.0) 2.2 (2.0) 17 (6)
25 Nov 2010–10 Dec 2010 P8 33 19.4 2.0 7
B)
A)
Fig. 5. Maximum rainfall intensity (five-minute resolution) observed for the Manival from(A)the lower study site rain gauge and(B)the upper study site rain gauge; cross-section surveys are indicated by dotted lines; the arrows indicate debris-flow occurrence.
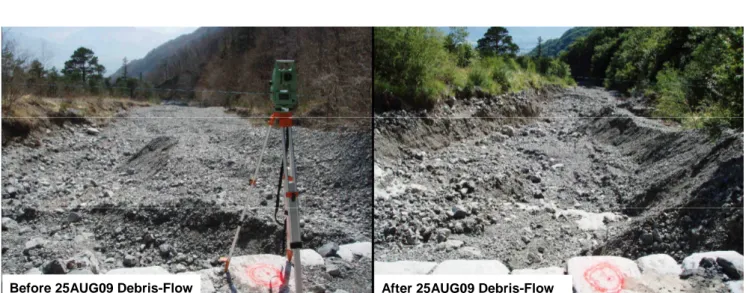
(Fig. 7). Maximum local scour reached 2.9 m. A net storage loss of 2034 m3±199 was obtained, which was equivalent to
the sediment output captured by the TLS survey of the sed-iment trap (1873 m3±62). Therefore, sediment input from
the upper catchment could be considered as very low (not greater than 63 m3given uncertainties of storage changes and output) and most of the sediment yield was supplied by chan-nel scouring along the main chanchan-nel. There were no signs of a debris-flow upstream from the proximal reach. This sug-gests that the debris-flow initiated in the proximal reach of the main channel.
During the P2 period (30 August to 7 October 2009), a succession of small rainfall events with a maximum in-tensity of 17 mm h−1 induced moderate channel changes related to bedload transport, with a general storage gain of 789 m3±84, homogeneously distributed along the study
-20 -15 -10 -5 0 5 10 15 20
0 500 1000 1500
Downstream Distance from Alluvial Storage Apex (m)
U n it V o lu m e C h a n g e ( m
3 m -1) -20 -15 -10 -5 0 5 10 15 20 U n it V o lu m e C h a n g e ( m
3 m -1) -20 -15 -10 -5 0 5 10 15 20 U n it V o lu m e C h a n g e ( m
3 m -1) -20 -15 -10 -5 0 5 10 15 20 U n it e V o lu m e C h a n g e ( m
3 m -1) -20 -15 -10 -5 0 5 10 15 20 U n it V o lu m e C h a n g e ( m
3 m -1) -20 -15 -10 -5 0 5 10 15 20 U n it V o lu m e C h a n g e ( m
3 m -1) -20 -15 -10 -5 0 5 10 15 20 U n it V o lu m e C h a n g e ( m
3 m -1) -20 -15 -10 -5 0 5 10 15 20 U n it V o lu m e C h a n g e ( m 3m -1) 0 1000 2000 3000 4000 5000 S e d im e n t T ra n s p o rt ( m 3) 0 1000 2000 3000 4000 5000 S e d im e n t T ra n s p o rt ( m 3) 0 1000 2000 3000 4000 5000 S e d im e n t T ra n s p o rt ( m 3) 0 1000 2000 3000 4000 5000 S e d im e n t T ra n s p o rt ( m 3) 0 1000 2000 3000 4000 5000 S e d im e n t T ra n s p o rt ( m 3) 0 1000 2000 3000 4000 5000 S e d im e n t T ra n s p o rt ( m 3) 0 1000 2000 3000 4000 5000 S e d im e n t T ra n s p o rt ( m 3) 0 1000 2000 3000 4000 5000 S e d im e n t T ra n s p o rt ( m 3)
0 500 1000 1500
Downstream Distance from Alluvial Storage Apex (m)
downstream downstream
upstream upstream
P1 (06/07/2009 - 28/08/2009) (debris-flow)
P2 (30/08/2009 - 07/10/2009)
P3 (08/10/2009 - 12/11/2009)
P4 (13/11/2009 - 01/06/2010)
P5 (02/06/2010 - 08/06/2010) (debris-flow)
P6 (09/06/2010 - 08/10/2010)
P7 (14/10/2010 - 25/11/2010)
P8 (25/11/2010 - 10/12/2010)
Proximal Reach Distal Reach
Table 4. Sediment budget for the Manival Torrent obtained from cross-section and sediment trap resurveys; sediment inputs were back-calculated from storage changes and outputs; uncertainties of channel erosion and deposition are back-calculated from the Taylor’s law of uncer-tainty propagation; storage change unceruncer-tainty is the sum of erosion and deposition uncertainties; sediment output unceruncer-tainty is calculated from individual errors associated with topographic surveys; ranges of values proposed for sediment output (when a topographic survey of the sediment trap is not available) or input are derived from storage change uncertainty.
Study Period Sediment Storage Channel Channel Sediment
period ID Input(m3) Change(m3) Erosion(m3) Deposition (m3) Output (m3)
6 Jul 2009–28 Aug 2009 P1 0–63 −2034 (±199) 5232 (±136) 3199 (±63) 1873 (±62)
30 Aug 2009–7 Oct 2009 P2 736–842 789 (±84) 1409 (±31) 2197 (±53) 0
8 Oct 2009–12 Nov 2009 P3 198–260 −73 (±66) 1546 (±36) 1473 (±31) 266–338 13 Nov 2009–1 Jun 2010 P4 0–36 −580 (±81) 1961 (±45) 1372 (±36) 535–625 2 Jun 2010–8 Jun 2010 P5 0–537 −3052 (±272) 7658 (±178) 4605 (±93) 3320 (±176) 9 Jun 2010–8 Oct 2010 P6 174–246 −608 (±82) 2246 (±46) 1637 (±36) 773–865 14 Oct 2010–25 Nov 2010 P7 0–49 −267 (±35) 921 (±20) 685 (±15) 226 (±34) 25 Nov 2010–10 Dec 2010 P8 0–76 −306 (±51) 1351 (±29) 1056 (±23) 515 (±41)
6 Jul 2009–10 Dec 2010 1108–2109 −6147 (±870) 7195–8075
Before 25AUG09 Debris-Flow After 25AUG09 Debris-Flow
Fig. 7. Photo sequence displaying channel scouring of the August 2009 debris-flow in the main channel of the Manival; views looking downstream.
sediment had been delivered by the upper catchment (cal-culated between 736 and 842 m3), despite the low rainfall. The main channel functioned as a sediment trap, capturing gravels coming from the upper catchment. A similar pat-tern of rainfall was observed during P3, with long duration and low intensity rainfall events, typical of the autumn sea-son. A net storage loss of 89 m3±66 was obtained. The
sediment trap was disturbed by dredging operations; how-ever, assuming zero input, the output could be estimated from the sediment transport trend to be 266–338 m3and a recharge from the upper catchment of 198–260 m3. Chan-nel responses were not very important, except in a small proximal reach where considerable gravel wedges accumu-lated in the channel, generating 1.2 m of deposition locally. Those gravel deposits were supplied by both channel
scour-ing in the proximal main channel and sediment supply from the upper catchment. The P4 period (13 November 2009 to 1 June 2010) included small rainfall events with low inten-sity (maximum of 10 mm h−1)during the early spring. A net storage loss of 580 m3±81 was captured, without any sign
The most important debris-flow of the monitoring period occurred during P5 period which was initiated by a short duration convective storm that occurred the 6 June 2010. With the storm burst defined as a continuous rainfall accord-ing to a 5-min time step, the duration was 2.3 h with a to-tal of 21 mm and a maximum 5-min intensity of 25 mm h−1. The general pattern of erosion and deposition along the main channel was very similar to the one of the August 2009 debris-flow (Fig. 6). A net storage loss of 3052 m3±272
was obtained, which is equivalent to the sediment deposition in the trap, measured at 3320 m3±176. Channel scouring
of the proximal reach supplied most of the sediment output and the direct contribution of the upper catchment to the sed-iment yield was negligible. The debris-flow grew in volume along a reach of 600 m length and 18 % slope, contribut-ing ∼4000 m3 to the distal reach and sediment trap. De-spite the high intensity of the rainfall, the sediment supply from the upper catchment was low (higher-bound estimate of 537 m3). However, mud marks were observed upstream from the scoured reaches indicating that fine sediments were already present. They most likely originated from hillslope runoff and bank erosion.
The channel response after the June 2010 debris-flow was different than what was observed after the August 2009 event. The debris-flow occurred in early summer; for the rest of the summer (P6), a series of high intensity rainfall (range: 20–79 mm h−1) did not produce any debris-flows. The P6 pe-riod was the most active in terms of rainfall, but not the most sensitive in terms of geomorphic response. The proximal reach continued to scour, whereas some thin gravel wedges were deposited in the distal reach (Fig. 6). A net storage loss of 608 m3±82 was obtained. The sediment trap was dis-turbed; however, the output was estimated to be 773–865 m3 and a recharge from the upper catchment of 174–246 m3was obtained. The August 2009 debris-flow lag and levee de-posits were eroded during this period and accumulated into gravel wedges along the distal reach. Throughout autumn 2010 (P7 and P8), these gravel wedges gradually mobilized downstream into the sediment trap without substantial sedi-ment supply from the upper catchsedi-ment (Fig. 6).
3.3 Sediment supply from first-order headwaters
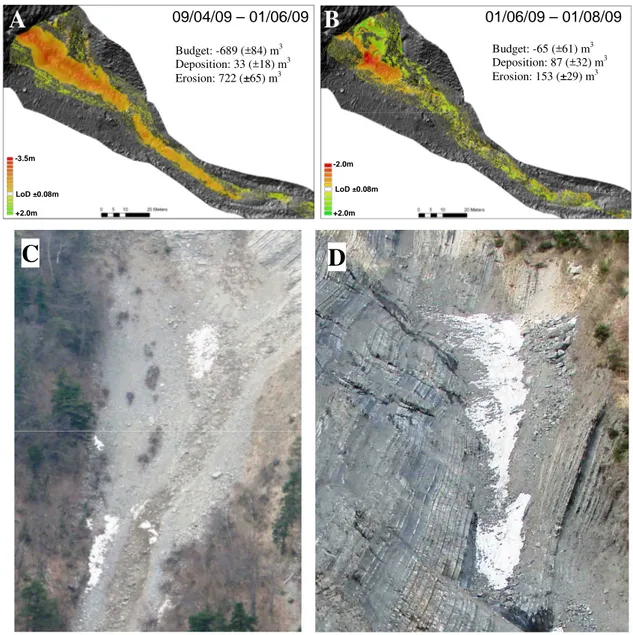
Seasonal repeat TLS surveys of Manival headwaters from April to November 2009 revealed important elevation changes over time. At site S1, located in Fig. 1, four DEMs of difference (the subtraction of a post and prior DEM) were produced during the period. From April to June and from June to August, the most striking change was a strong de-crease of elevation in the proximal part of the gully, which had reached 3 to 5 m locally (Fig. 8a and b). The loss in elevation was most dramatic between June and August even with rockfall deposits occurring just upslope. During this pe-riod, no convective storms occurred and no geomorphic ac-tivity was observed along the main channel of the Manival.
Moreover, no gain of elevation was observed in the distal part of the gully (confirmed with painted field marks), and it is difficult to imagine long travel distances of sediment with-out any significant rainfall. Therefore, the captured eleva-tion changes in the proximal part of the gully should have been driven by the melting of buried snow accumulations of the winter which were mixed and recovered by rockfall deposits coming from the active rock wall (Fig. 8c and d). Snow accumulations in shaded gullies resulted partly from snow avalanches, which are very frequent in the upper catch-ment of the Manival. The resulting DEMs of difference could not be integrated in the sediment budget analysis since most of the lost volume concerned snow (total volume loss: 754 m3±145).
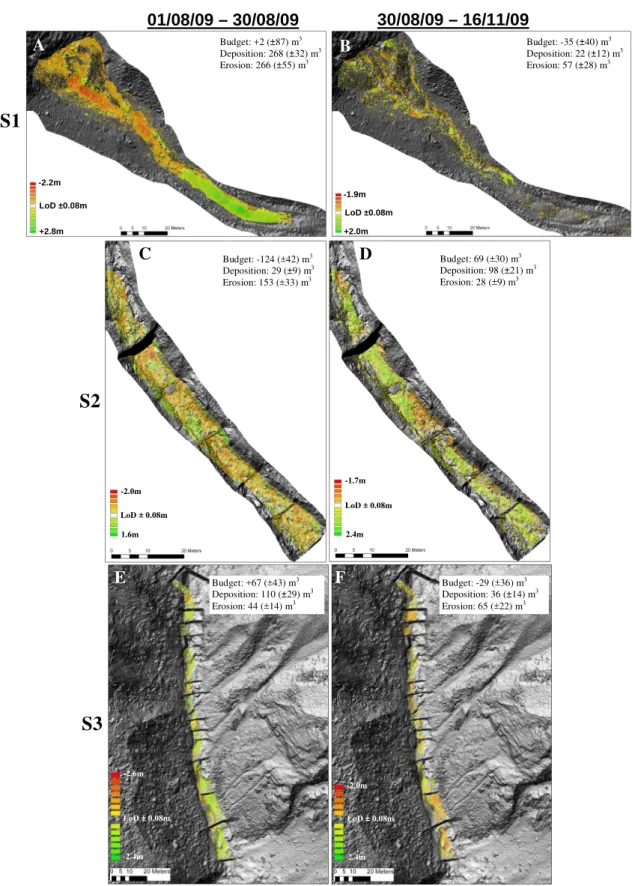
TLS resurvey of the S1 site during August (correspond-ing with P1) showed that a talus slope failure occurred in the proximal zone (Fig. 9a). An erosion of 266 m3 took place at the talus slope with 268 m3 depositing 40 to 80 m down the gully. The net deposition of 2 m3±87 shows very little
input from the rock wall. No morphological change was ob-served further downstream in the gully. There were not any rainstorms or sustained rainfall throughout August 2009 until the debris-flow event. The small talus slope failure was most likely initiated during the storm event of August 2009 that generated a debris-flow in the main channel of the Manival. The remobilised sediments remained in the distal part of the headwater channel and for the rest of the monitoring period. Even though the S1 site was disconnected from the channel, other first-order headwaters were active and connected to the channel and the S2 and S3 site (locations in Fig. 1).
-2.0m
+2.0m LoD ±0.08m -3.5m
+2.0m LoD ±0.08m
09/04/09 – 01/06/09 01/06/09 – 01/08/09
Budget: -689 (±84) m3
Deposition: 33 (±18) m3 Erosion: 722 (±65) m3
Budget: -65 (±61) m3
Deposition: 87 (±32) m3 Erosion: 153 (±29) m3
B
C
D
A
Fig. 8. Snowmelt indicated by DEM of differences derived from TLS and ALS resurveys of the S1 site on the Manival from April to June 2009(A)and June to August 2009(B); LoD: level of detection of significant elevation change based on the RMSE of the merging process. View(C)is of the proximal zone of the S1 site where snow was mostly mixed in the deposits; view(D)is of the proximal zone of a typical first-order gully of the Manival showing snow accumulation partially covered by rockfall deposits.
3.4 Fluctuating channel storage over time
The initial channel storage for the Manival torrent at the on-set of the monitoring estimated to be 35 500 m3 according to the SLBL method. This value is in good agreement with the storage volume estimated by cross-section interpretation of the maximum debris-flow scouring surface, which gave a total volume of 31 500 m3. The storage estimates were subdi-vided in 3 functional reaches according to the geomorphic re-sponses observed during the monitoring period: the proximal reach where maximum channel scouring was observed, holds an initial storage of 13 500 m3, the transport reach where an equilibrium was observed between erosion and deposition,
Budget: +67 (±43) m3
Deposition: 110 (±29) m3
Erosion: 44 (±14) m3
-2.6m
2.4m LoD ± 0.08m
-2.0m
2.4m LoD ± 0.08m
E
F
Budget: -29 (±36) m3Deposition: 36 (±14) m3
Erosion: 65 (±22) m3
S3
Budget: -124 (±42) m3
Deposition: 29 (±9) m3
Erosion: 153 (±33) m3
-2.0m
1.6m LoD ± 0.08m
-1.7m
2.4m LoD ± 0.08m
C
D
Budget: 69 (±30) m3Deposition: 98 (±21) m3
Erosion: 28 (±9) m3
S2
01/08/09 – 30/08/09
Budget: +2 (±87) m3
Deposition: 268 (±32) m3
Erosion: 266 (±55) m3
Budget: -35 (±40) m3
Deposition: 22 (±12) m3
Erosion: 57 (±28) m3
30/08/09 – 16/11/09
-2.2m
+2.8m
-1.9m
+2.0m LoD ±0.08m
LoD ±0.08m
A
B
S1
Fig. 10.Evolution of in-channel sediment storage during the moni-toring period along the Manival study reach. Upper and lower lim-its are plotted according to the calculated uncertainty. DF denoted debris-flow occurrences.
4 Discussion
Gregoretti and Fontana (2008) found that debris-flows in the Dolomites (Italian Alps) formed due to the scouring effect of critical discharge from peak runoff. They also found that the triggering areas are located where sediment is available and where overland flow can occur. Observations in the Mani-val Torrent are consistent with these findings; channelized debris-flows were initiated in the proximal reach of the main channel where most sediment storage is present. Triggering occurred during high intensity rainfalls which produced the critical discharge. For the two debris-flow events, clear field observations upstream from the main channel showed that surface water runoff was initiated in the upper catchment pro-ducing water surges (indicated by high water marks). Mor-phological signatures of bedload transport were clearly de-tected in these upper reaches (sorted unconsolidated gravel deposits), without any signs of debris-flow propagation (un-sorted levee, lobe, lag and terminal deposits with a fine sed-iment matrix). Multiple surges occur in the Manival where we do not know the exact timing of the headwater’s sediment transport in relation to the main channel debris-flow. How-ever, the sediment budgets indicate that there was little sed-iment transfer between the channel and the upper catchment for all the surges combined.
Sediment budget reconstitutions showed that debris-flow volumes at the downstream end of the study reach are equiv-alent to net erosion along the main channel (Table 4, Fig. 6). The direct contribution of hillslope erosion to debris-flow volume was insignificant, despite the occurrence of talus slope failures during storm events (Fig. 9). Sediment trans-fer along the stream network was characterised by impor-tant spatial discontinuities during summer storms. Sediment
0 500 1000 1500 2000 2500
0 500 1000 1500 2000
Downstream distance from apex of alluvial fan (m)
C
h
a
n
n
e
l
S
to
ra
g
e
(
m
3)
Initial Storage Storage after P5 Storage after P8
Proximal Transport Lower
Fig. 11. The distribution of the channel storage change during the monitoring period derived from cross-section interpretation of the maximum debris-flow scouring surface. Within the monitoring period, the proximal reach had a large storage loss, the transport reach had little change and the lower reach gained in storage.
coming from talus slope failures or gully stores stayed cap-tured in the distal reaches of headwaters and did not propa-gate down to the main channel (Fig. 9). A similar observation of sediment retention after a debris-flow in a second-order steep-slope channel was made at the Chalk Cliffs experimen-tal site in Colorado (McCoy et al., 2010). These temporary storages were released during long duration and low inten-sity rainfall events in autumn and were deposited as gravel wedges along the main channel, partly refilling the previous debris-flow scoured channel. The retention of sediment in headwaters during the summer induced the formation of low sediment concentration water surges in the proximal main channel, with a high erosive “hydraulic load” (Rickenmann et al., 2003). When these sediment-laden water surges en-tered the main channel, they rapidly scoured the channel and transformed into debris-flows. The sediment concentration rapidly increased downstream, thereby reducing the erosive capacity of the flow.
7 m3m−1, with maximum values of 17 m3m−1. These val-ues are close to the 10 m3m−1reported in the Eastern Italian Alps (Marchi and D’Agostino, 2004) and within the range of 3.6 to 30 m3m−1from the recent compilation of yield rates for confined debris-flows (Hungr et al., 2005).
The respective influence of debris-flow and bedload trans-port on channel deformations during flow events is of cru-cial importance for the understanding of mountain stream morphodynamics. Field observations of morphological re-sponses to these two types of flows in a same channel are not very common. The intensive topographic monitoring of the Manival Torrent gave a unique opportunity to characterise sediment budgets for both flow types. Even though it was easy to determine if a debris-flow occurs during each moni-toring period and then to compare morphological responses of periods with and without debris-flows, it was much more difficult to discriminate the effects of the two flow types for the periods characterised by a debris-flow occurrence. In this latter case, channel deformations integrate the effects of both types since bedload transport is generally active during flow recession and between debris-flow surges. Our moni-toring strategy was not designed to detect the variability of the flow properties during events and to cross-correlate with a high-frequency morphological signal. Without such infor-mation, it is not possible to unambiguously attribute scour-ing and fillscour-ing phases to specific flow conditions. However, other field (Berger et al., 2011b) and experimental evidences (Mangeney et al., 2010) identify that the maximum scouring is related to the passage of the debris-flow front.
The influence of sediment recharge on debris-flows is quite evident in the Manival. Figures 10 and 11 show a large decrease in channel storage after the June 2010 debris-flow (P5). This affected the channel’s response to rainfall for the rest of the year. In Fig. 12, rainfall burst intensity versus du-ration is plotted (bursts defined as a continuous rainfall, ac-cording to a 5-min time interval). These bursts are identified as to when the channel had storage (before June 2010 debris-flow), when the channel was without storage (after June 2010 debris-flow) and when a debris-flow occurred. The mean burst intensity and duration corresponds well with triggering thresholds from other monitoring sites (bursts defined with a 10-min time interval) (Badoux et al., 2008; Coe et al., 2008). However, when the channel was without storage, there were rainfall bursts similar to ones which triggered debris-flows. If storage was available, these bursts could have triggered debris-flows and, therefore, changing the threshold. This is clearly shown with the maximum burst intensities in Fig. 12. Unfortunately, there is not enough data for calculating the different triggering thresholds; however, a general range can still be observed (interpreted threshold range). The threshold range was approximately drawn to fit a line at the maximum extent for bursts with channel storage (lower-limit) and then a parallel line is drawn along the bursts which triggered debris-flows (upper-limit). This shows that the presence of storage controls the sensitivity of channel response to rainfall.
Interpreted threshold range
Fig. 12.Mean and maximum rainfall burst intensities against burst duration. Bursts are grouped according to available storage (before P6 debris-flow) (filled-red) and the channel with minimal storage (after P6 debris-flow) (empty-black). Debris-flows (solid-black) correspond well with thresholds from other sites with burst calcula-tions; however, the presence of storage can influence the threshold line (interpreted threshold range).
The general patterns of spatial and temporal variability of geomorphic responses in the Manival catchment is consis-tent with other recent reported monitoring studies on sedi-ment dynamic in debris-flow channels (Berger et al., 2011a; Fuller and Marden, 2010; Imaizumi et al., 2006; McCoy et al., 2010; Remaˆıtre et al., 2005). The pulses of sedi-ment supply from hillslopes during the winter accumulated in first-order channels and are transferred to their next higher order reaches during spring and summer storms by debris-flows. These observations can be summarized by a concep-tual model of seasonal cycles of sediment routing from low to high-order channels (Fig. 13). The model incorporates dif-ferent event intensities:
Fig. 13.Conceptual model of seasonal cycles of channel scour-and-fill from first-order to high-order debris-flow channels according to level of storm intensity. Thickness of lines indicates the importance of storage. Seasonal cycles with low summer rainfall intensities have downstream progressing sediment waves initiated by pulses of sediment supply from hillslopes during winter. The cycle with intermediate summer storms has a summer flushing from the head-waters but large lag deposits continue to flush out in autumn. The extreme summer events have longer sediment routings which flush out most of the channels with minimal lag deposits during the sum-mer storms.
summer 2009 (Fig. 9). We can also easily imagine that fine-grained debris may be mobilised as bedload by surface runoff and transported over short distances to second- or third-order channels. The net deposition ob-served for the third-order S3 site during summer 2009 is consistent with this scenario (Fig. 9e). Even if the expected general trend for intermediate channels is de-position of debris coming from headwaters, it is pos-sible to observe local channel scouring (Fig. 9c). The stochastic nature of the sediment supply from hillslopes during winter can explain heterogeneous conditions of debris coverage in first-order channels and then variable conditions of sediment supply to intermediate channels during summer.
In high-order channels, the expected response during the summer is channel scouring by debris-flow entrain-ment of loose sedientrain-ment accumulated during the pre-ceding autumn. These debris-flows are formed by the sediment concentration increase of surface runoff when the flow starts to entrain sediment from the main chan-nel. This has been consistently observed in the Manival during summer 2009 and 2010 (Fig. 6), where the vol-ume of the two debris-flows obtained in the sediment trap was equivalent to net erosion along the main chan-nel. During autumn, high-order channels are expected to receive sediment coming from debris in intermediate
channels that accumulated during the summer. These sediment transfers are governed by bedload transport, with rainfall intensities being generally insufficient to initiate debris-flows. Net deposition in the main channel during autumn 2009 confirmed this scenario (Fig. 10). Qualitative observations made by the ONF-RTM38 af-ter a small flow event in September 2008 (Peteuil et al., 2008) confirmed net deposition during autumn in the main channel of the Manival. It was not the case in au-tumn 2010, where net erosion was observed (Fig. 10). This may be attributed to a low sediment supply from hillslopes during winter, which may explain low sedi-ment availability in intermediate channels.
2. Intermediate rainfall intensity in the summer was not observed during the monitoring periods. However, it can be assumed that the storage in the main channel is still evacuated out as a debris-flow. In the headwaters, longer travel distances would be observed with more continuity in the sediment routing. The headwater ma-terial could potentially contribute to the main channel debris-flow as well as depositing material in the main channel. In autumn, this new material would then con-tinue to mobilize out of the channel in the form of gravel wedges.
3. Extreme rainfall intensity in the summer flushes sed-iment from first- to fourth-order channels out of the catchment system. An illustration of this is provided by the recent debris-flow history of the Manival. A large landslide occurred in the upper catchment dur-ing winter 1991, with a volume of 26 000 m3estimated from ALS data. The archives of ONF-RTM38 revealed that during the summer of 1991, two important debris-flows occurred and deposited a cumulative volume of 25 000 m3in the sediment trap. The large hillslope pulse depositing in the headwaters in the winter was essen-tially flushed out of the catchment during rainfall events in the summer.
5 Conclusions
The conceptual model provides a better understanding on seasonal cycles of scour-and-fill. Some authors provide sim-ilar sediment routing schemes but at a much longer timescale (Benda, 1990). The presented model provides valuable input for assessing current and potential hazards (seasonal and ex-treme). The determination of where and when important stor-ages occur allows for more effective management in these catchments.
Acknowledgements. This research was supported by Interreg-Alpine Space-PARAmount European project and the PGRN (Pˆole Grenoblois d’´etude et de recherche pour la pr´evention des Risques Naturels, Conseil G´en´eral de l’Is`ere). The ONF-RTM 38 is acknowledged for facilitating field access to the Manival. Bruno Bacq, Mathieu Cassel, Michael Deschatres, Adeline Heymann, Hugo Jantzi, Mathieu Labb´e, Oldrich Navratil, Emilien Parisot, Sandrine Tacon and Nicolas Talaska are acknowledged for their assistance during the fieldwork. This paper also benefits from discussions with Christophe Peteuil (ONF-RTM 38). We also thank the reviewers and the editor for their thorough evaluations.
Edited by: A. G¨unther
Reviewed by: A. Remaitre and another anonymous referee
References
Ashmore, P. E. and Church, M. A.: Sediment transport and river morphology: A paradigm for study, in: Gravel-Bed Rivers in the Environment, edited by: Klingeman, P. C., Beschta, R. L., Komar, P. D., and Bradley, J. D., Water Resource Publications, LLC, Highlands Ranch, Colorado, 115–148, 1998.
Badoux, A., Graf, C., Ryhner, J., Kuntner, R., and McArdell, B. W.: A debris-flow alarm system for the Alpine Illgraben catchment: design and performance, Nat. Hazards, 49, 517–539, 2008. Benda, L.: The influence of debris flows on channels and valley
floors in the Oregon Coast Range, USA, Earth Surf. Proc. Land., 15, 457–466, 1990.
Benda, L. E. and Dunne, T.: Sediment routing by debris flow, Inter-national Association for Hydrological Sciences, 165, 457–466, 1987.
Berger, C., McArdell, B. W., and Schlunegger, F.: Sediment transfer patterns at the Illgraben catchment, Switzerland: Implications for the time scales of debris flow activities, Geomorphology, 125, 421–432, 2011a.
Berger, C., McArdell, B. W., and Schlunegger, F.: Direct measure-ment of channel erosion by debris flows, Illgraben, Switzerland, J. Geophys. Res., 116, F01002, doi:10.1029/2010JF001722, 2011b.
Besl, P. J. and McKay, N. D.: A method for registration of 3-D shapes, IEEE T. Pattern Anal., 14, 239–256, 1992.
Bovis, M. J. and Jakob, M.: The role of debris supply conditions in predicting debris flow activity, Earth Surf. Proc. Land., 24, 1039–1054, 1999.
Coe, J. A., Kinner, D. A., and Godt, J. W.: Initiation conditions for debris flows generated by runoff at Chalk Cliffs, central Col-orado, Geomorphology, 96, 270–297, 2008.
Djerboua, A.: Pr´ed´etermination des pluies et crues extrˆemes dans les Alpes franco-italiennes: pr´evision quantitative des pluies
journali`eres par la m´ethode des analogues, PhD thesis, Institute National Polytechnique de Grenoble, Grenoble, 212 pp., 2001. Djerboua, A. and Lang, M.: Comparaison de diff´erents modes
d’echantillonnage pour l’estimation du gradex des pluies, Revue des Sciences de l’Eau, 20, 111–125, 2007.
Ferguson, R. I. and Ashworth, P. J.: Spatial patterns of bedload transport and channel change in braided and near-braided rivers, in: Dynamics of Gravel-Bed Rivers, edited by: Billi, P., Hey, R. D., and Thorne, C. R., Wiley, Chichester, 477–496, 1992. Fuller, I. C. and Marden, M.: Rapid channel response to
vari-ability in sediment supply: Cutting and filling of the Tarndale Fan, Waipaoa catchment, New Zealand, Mar. Geol., 270, 45–54, 2010.
Gregoretti, C. and Fontana, G. D.: The triggering of debris flow due to channel-bed failure in some alpine headwater basins of the Dolomites: analyses of critical runoff, Hydrol. Process., 22, 2248–2263, 2008.
Hungr, O., McDougall, S., and Bovis, M.: Entrainment of mate-rial by debris flows, in: Debris-Flow Hazards and Related Phe-nomena, edited by: Jakob, M. and Hungr, O., Springer, Berlin Heidelberg, Germany, 135–158, 2005.
Iavarone, A., Vagners, D.: Sensor fusion: Generating 3D by com-bining airborne and tripod mounted LIDAR data. In: Proceedings of the International Workshop on Visualization and Animation of Reality-Based 3D Models 2003, Engadin, Switzerland, Inter-national Archives of the Photogrammetry, Remote Sensing and Spatial Information Sciences, 34, 7 pp., 2003.
Imaizumi, F., Sidle, R. C., Tsuchiya, S., and Ohsaka, O.: Hydroge-omorphic processes in a steep debris flow initiation zone, Geo-phys. Res. Lett., 33, L10404, doi:10.1029/2006GL026250, 2006. Jaboyedoff, M., Baillifard, F., Couture, R., Locat, J., and Locat, P.: Toward preliminary hazard assessment using DEM topographic analysis and simple mechanic modeling, Landslides Evaluation and Stabilization, London, 191–197, 2004.
Jaboyedoff, M. and Derron, M. H.: A new method to estimate the infilling of alluvial sediment of glacial valleys using a sloping local base level, Geografia Fisica e Dinamica Quaternaria, 28, 37–46, 2005.
Jakob, M., Bovis, M., and Oden, M.: The significance of chan-nel recharge rates for estimating debris-flow magnitude and fre-quency, Earth Surf. Proc. Land., 30, 755–766, 2005.
Lopez Saez, J., Corona, C., Stoffel, M., Gotteland, A., Berger, F., and Li´ebault, F.: Debris-flow activity in abandoned chan-nels of the Manival torrent reconstructed with LiDAR and tree-ring data, Nat. Hazards Earth Syst. Sci., 11, 1247–1257, doi:10.5194/nhess-11-1247-2011, 2011.
Loye, A., Pedrazzini, A., Theule, J. I., Jaboyedoff, M., Li´ebault, F., and Metzger, R.: Influence of bedrock structures on the spatial pattern of erosional landforms in small alpine catchments, Earth Surf. Proc. Land., in press, 2012.
Mangeney, A., Roche, O., Hungr, O., Mangold, N., Faccanoni, G., and Lucas, A.: Erosion and mobility in granular col-lapse over sloping beds, J. Geophys. Res., 115, F03040, doi:10.1029/2009JF001462, 2010.
Marchi, L. and D’Agostino, V.: Estimation of debris-flow mag-nitude in the Eastern Italian Alps, Earth Surf. Proc. Land., 29, 207–220, 2004.
Proc. Land., 25, 1011–1024, 1995.
McCoy, S. W., Kean, J. W., Coe, J. A., Staley, D. M., Wasklewicz, T. A., and Tucker, G. E.: Evolution of a natural debris flow: in situ measurements of flow dynamics, video imagery, and terrestrial laser scanning, Geology, 38, 735–738, 2010.
Otto, J.-C., Schrott, L., Jaboyedoff, M., and Dikau, R.: Quantifying sediment storage in a high alpine valley (Turtmanntal, Switzer-land), Earth Surf. Proc. Land., 34, 1726–1742, 2009.
Peteuil, C., Maraval, C., Bertrand, C., and Monier, G.: Torrent du Manival: Sch´ema d’am´enagement et de gestion du bassin versant contre les crues, Unpublished technical report; Office National des Forˆets, Service de Restauration des Terrains en Montagne de l’Is`ere, Grenoble, France, 107 pp., 2008.
Rabatel, A., Deline, P., Jaillet, S., and Ravanel, L.: Rock falls in high-alpine rock walls quantified by terrestrial lidar measure-ments: A case study in the Mont Blanc area, Geophys. Res. Lett., 35, L10502, doi:10.1029/2008GL033424, 2008.
Raven, E. K., Lane, S. N., Ferguson, R. I., and Bracken, L. J.: The spatial and temporal patterns of aggradation in a temperate, up-land, gravel-bed river, Earth Surf, Proc. Landf., 34, 1181–1197, 2009.
Reid, S. C., Lane, S. N., Berney, J. M., and Holden, J.: The timing and magnitude of coarse sediment transport events within an up-land, temperate gravel-bed river, Geomorphology, 83, 152–182, 2007.
Remaˆıtre, A., Malet, J. P., and Maquaire, O.: Morphology and sed-imentology of a complex debris flow in a clay-shale basin, Earth Surf. Proc. Land., 30, 339–348, 2005.
Rickenmann, D., Weber, D., and Stepanov, B.: Erosion by debris flows in field and laboratory experiments, Debris-Flow Hazards Mitigation: Mechanics, Prediction, and Assessment, 883–894, 2003.