Materials Research, Vol. 10, No. 4, 449-452, 2007 © 2007
*e-mail: [email protected]
Modified Method for Obtaining the Critical Cooling
Rate for Vitrification of Polymers
Claudia Canova, Benjamim de Melo Carvalho*
Materials Engineering Department, Universidade Estadual de Ponta Grossa – UEPG,
84030-900 Ponta Grossa - PR, Brazil
Received: May 31, 2007; Revised: October 30, 2007
Due to the relevance of the critical cooling rate, Rc, for glasses, Barandiarán and Colmenero (BC) developed a method for calculating Rc as a function of the crystallization temperature on cooling obtained from thermal analysis. The critical cooling rate is obtained by the extrapolation method to conditions of infinity undercooling. However, for polymers, there is a strong reason for modifying the original BC method. In this case, the extrapolation must be extended only to the undercooling associated to the glass transition temperature, Tg, because no crystallization can occur below this temperature. Following this modified method (MBC) proposed by the present authors, the critical cooling rate for PP, PEEK, P10MS and PET were determined. The results showed that the new values are much lower than those obtained by the original BC method.
Keywords: critical cooling rate, noncrystalline polymers, crystallization, P10MS, PP
1. Introduction
In crystalline materials, the control of properties can be achieved by controlling the crystallization process. In some cases, it is desirable to avoid any crystallization. For example, if transparency is impor-tant or if one wants to measure the glass transition temperature with greater precision using Differential Scanning Calorimeter (DSC), amorphous polymers can be more appropriated. In the injection molding, depending on how fast some polymers are cooled, an amor-phous or crystalline part can be obtained. Therefore, in these cases it is important to know what is the lowest (critical) cooling rate that avoids the crystalline phase formation.
Due to the importance of the crystallization process for glasses, Barandiarán and Colmenero (BC) developed a method for obtaining the critical cooling rate using non isothermal crystallization tempera-ture as a function of cooling rate from thermal analysis1. Fitting these
experimental data to their model, represented by the Equation 1, the critical rate Rc is obtained by an extrapolation method to conditions of infinity undercooling:
ln(R) = A – (B/(Tmo – T c)
2) (1)
Rc(∞) = exp(A) (2)
where ∆T is the degree of undercooling (∆T = Tmo – T c), Tm
o the
equilibrium melting temperature, Tc is the crystallization temperature observed in a DSC experiment at a cooling rate R, and Rc(∞) is the
critical cooling rate.
However, in some cases the critical cooling rates obtained by this method are very high and probably overestimated2,3. Cabral Jr. et al.4
observed correctly that the extrapolation to infinity undercooling does not make sense. The reason is that this extrapolation can be achieved only mathematically but not physically, since negative crystallization temperatures should be necessary. So, the maximum undercooling ac-tually possible is obtained if Tc is equal zero Kelvin. Thus, the recent modification proposed by Cabral Jr. et al. 4 employs the extrapolation
to this maximum possible undercooling:
ln(Rc(0 K)) = A – (B/(T m
o – 0 K)2) (3)
Rc(0 K) = exp(A – B/(T m
o)2) (4)
However, at least for polymers, there is a strong reason for intro-ducing a more conceptual modification to the original BC method. In this paper, the authors propose a modification on the BC method, where the extrapolation is extended only to the undercooling associ-ated to the glass transition temperature Tg, since no crystallization can occur below this temperature. Therefore, the aim of this paper is to compare, for different polymers, the Rc values obtained by the original BC method1 and the modified method proposed by
Cabral Jr. et al.4 with the results obtained by the MBC method
pro-posed by the present authors.
2. Materials and Methods
Using the modified method proposed in the present work, the new critical cooling rate is obtained by Equation 5:
ln (Rc(Tg)) = A – (B/(T m
o – Tg)
2) (5)
Rc(Tg) = exp(A – (B/(T m
o– T g)
2) (6)
In this paper, experimental data of crystallization temperature and cooling rates obtained by DSC for some polymers - homopoly-mer polypropylene5 (PP), Poly-ether-ether-ketone6 (PEEK),
Poly(decamethylene sebacate)3 (P10MS) and poly(ethylene
terephthalate)7 (PET) - were selected from the literature. They were
used to evaluate the critical cooling rates according to the original BC method, expressed by Equation 2, by the modified method proposed by Cabral Jr. et al.4, Equation 4 and by the modified BC method, MBC,
450 Canova & Carvalho Materials Research
the glass transition temperature for PP, PEEK, P10MS and PET are presented in Table 13,5,7. Tables 2 and 3 present the crystallization
temperature as a function of cooling rate for PEEK6, polypropylene5,
P10MS3 and PET7, respectively.
3. Results and Discussion
On Figure 1, the experimental crystallization data as a function of the undercooling degree for PEEK were fitted by Equation 1. The difference between the extrapolation necessary for obtaining the Rc for BC and MBC methods can be seen. The intersection of the regression line with the undercooling associated to Tg (dotted verti-cal line) corresponds to lnRc(Tg) for the MBC method, while lnRc(∞)
corresponds to the intersection between the regression line with the y-axis in the original BC method. It is clear that the value of lnRc(Tg)
calculated by the MBC method is lower than that one obtained by the BC method.
Figure 2 shows the experimental crystallization data and the undercooling degree of PP fitted by Equation 1. It also can be dem-onstrated that Rc(Tg) value evaluated by MBC method is lower than
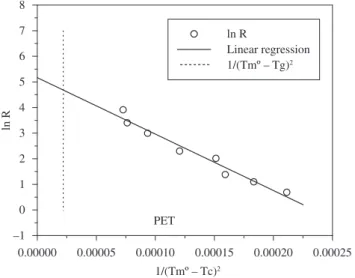
that one obtained by the original BC method. As it was described for Figures 1 and 2, the experimental crystallization data for P10MS and PET are presented on Figures 3 and 4.
Table 1. Glass transition temperature and equilibrium melting temperature
for the samples used in the present work3,5,7.
Sample PP PEEK P10MS PET
Tg (°C) 6.5 148.5 –53 67.2
Tmo (°C) 187.2 357.3 92.4 280.2
Table 2. Crystallization temperature Tc as a function of cooling rate R for
PP5 and PEEK6.
Cooling rate R (°C/min) Tc (°C) for PP Tc (°C) for PEEK
5 114.6 307.5
10 110.4 301.1
20 108.2 293.2
30 101.9
-40 102.9
-50 98.5
-Table 3. Crystallization temperature as a function of cooling rate for P10MS3
and PET7.
R (°C/min)
Tc (°C) P10MS
R (°C/min)
Tc (°C) PET
0.2 55.3 2 211.4
2 52.4 3 206.3
10 48.7 4 200.9
20 45.9 7.5 198.9
30 42.8 10 189.1
40 42.5 20 176.8
50 39.8 30 165.6
- - 50 162.9
0.0000 0.0001 0.0002 0.0003 0.0004 0.0005 2
4 6
PEEK
1/(Tmº – Tc)2
ln R
ln R
Linear regression 1/(Tmº – Tg)2
Figure 1. Fitting of the crystallization data to Equation 1 for obtaining the
critical cooling rate for vitrification of PEEK. Vertical line represents the undercooling associated to Tg.
0.00000 0.00005 0.00010 0.00015 0.00020 0
2 4 6 8 10
PP
ln R
ln R
Linear regression 1/(Tmº – Tg)2
1/(Tmº – Tc)2
Figure 2. Fitting of the crystallization data to Equation 1 for obtaining the
critical cooling rate for vitrification of PP. Dotted vertical line represents the undercooling associated to Tg.
0.0000 0.0002 0.0004 0.0006 0.0008
–4 –2 0 2 4 6 8 10 12 14
P10MS
ln R
1/(Tmº – Tc)2
ln R
Linear regression 1/(Tmº – Tg)2
Figure 3. Fitting of the crystallization data to Equation 1 for obtaining the
Vol. 10, No. 4, 2007 Modified Method for Obtaining the Critical Cooling Rate for Vitrification of Polymers 451
Figure 1-4 show that the experimental crystallization data from literature for the different polymers is relatively fitted by Equation 1, at least for the range of cooling rates employed in the present work.
Table 4 presents the values of the critical cooling rates for PEEK, PP, PET and P10MS according to the BC and MBC methods. It can be seen that for PEEK the Rc(Tg) obtained by the modified method
corresponds to 82% of that one calculated by the original BC method. In case of the PP, the difference is much higher, being the Rc(Tg)
cal-culated by the MBC method correspondent to 32% of that obtained by the original BC method. The Rc for PEEK is not so high and it is coherent with the relative facility to obtain an amorphous PEEK sample by quenching from the melt state. However, the value of Rc for the homopolymer PP is still very high, even if it is calculated by the MBC method. This value is coherent with the known difficulty (or impossibility in practical conditions) to obtain an amorphous PP sample.
For PET, Table 4 shows that the critical cooling rates are not so high, similarly to the results obtained for PEEK. That is also coher-ent with the fact that it is relatively easy to obtain an amorphous
sample of this polymer. For P10MS, Table 4 shows that the Rc(Tg)
value calculated by the MBC method proposed in the present work is 50% lower than that one predicted by the original method. However, it is still extremely high, as mentioned by Guimarães and Zanotto3.
This fact confirms the experimentally observed difficulty to vitrify this polymer, which is probably due to the high molecular mobility associated to its very flexible polymer chain3.
Table 4 also allows one to compare the Rc values obtained by the modified methods proposed by Cabral Jr. et al.4, Rc(0 K), and
the present authors, Rc(Tg), which employ the extrapolation to zero
Kelvin and Tg, respectively. The ratio between these Rc values and
Table 4. Critical cooling rates obtained for PP, PEEK, P10MS and PET by the original Barandiarán and Colmenero method, Rc(∞), and by the Modified
Baran-diarán and Colmenero methods, Rc(Tg) and Rc(0K).
Rc(∞) (°C/min) Rc(Tg) (°C/min) Ratio Rc(Tg)/Rc(∞) Rc(0 K) (°C/min) Ratio Rc (0 K)/Rc(∞)
PP 5789 1874 0.32 4865 0.84
PEEK 161 132 0.82 157 0.97
P10MS 14828 7369 0.50 13274 0.90
PET 175 108 0.62 163 0.93
Rc(∞) is showed on Table 4. It can be seen that the difference between
these modified methods is significant. For PP, the Rc(0K) obtained
by the extrapolation to zero Kelvin is 84% of the original value Rc(∞). However, Rc(Tg) is only 32% of Rc(∞). For P10MS, the ratio
Rc(0K)/Rc(∞) is 0.9, while Rc(Tg)/Rc(∞) is 0.5. For PET, Rc(0K)/Rc(∞) is
0.93, while Rc(Tg)/Rc(∞) is 0.62. For PEEK, Rc(0K) is only 3% lower
than the Rc(∞) predicted by the original BC method. However, the
difference between Rc(Tg) and the original value Rc(∞) is significant,
which is demonstrated by the ratio Rc(Tg)/Rc(∞) equal to 0.82.
The modified method proposed by the present authors al-lows a significant reduction of critical cooling rate compared to the original method. However, it is important to point out that any uncertainty in the determination of Tmo will have a very
large effect on the predicted Rc. For instance, in case of P10MS, Guimarães and Zanotto3 observed that according to the chosen
value of Tmo, the parameter Rc(∞) can assume values between
3000 °C/min (Tmo = 83 °C) and 15000 °C/min (T m
o = 92.4 °C). This
large difference overcomes the influence of the modified method proposed by the present authors. Therefore, any test of this modi-fied method with experimental data must be associated to a great confidence on the Tmo values of the polymer sample. With the recent
development of the chip calorimetry8, it will be possible to determine
with precision the experimental critical cooling rate for vitrification of several polymers.
Finally, it should be mentioned that with high cooling/heating rates, there is a significant temperature lag between the DSC furnace and the sample9-11. If one intends to test the theoretical methods for obtaining
the critical cooling rate, this effect also must be taken into account.
4. Conclusion
At least for polymers, the original BC method is not completely adequated. The modified method proposed in the present work showed that significant lower critical cooling rates can be obtained for poly-mers when the extrapolation is extended only to the undercooling associated to Tg. Probably, these new critical cooling rates calculated by the MBC method are more realistic or, at least, are more consistent with theoretical fundaments of polymer crystallization. It is expected that the recent developments of new experimental techniques will be very helpful in the validation of the available theoretical methods.
References
1. Barandirán JM, Colmenero J. Continuous cooling approximation for the formation of a glass. Journal of Non-Crystalline Solids. 1981; 46(3):277-287.
2. Guimarães LM. Testes das teorias clássicas de nucleação e crescimento de cristais no poli(sebacato de decametileno). [Unpublished D. Phil thesis]. São Carlos: Universidade Federal de São Carlos; 2002. 3. Guimarães LM, Zanotto ED. Cristalização e taxa crítica de resfriamento
para vitrificação do poli(sebacato de decametileno). Química Nova. 2003; 26(2):202-207.
4. Cabral AA, Cardoso AAD, Zanotto ED. Glass-forming ability versus sta-bility of silicate glasses. I. Experimental test. Journal of Non-Crystalline Solids. 2003; 320(1):1-8.
Figure 4. Fitting of the crystallization data to Equation 1 for obtaining the
critical cooling rate for vitrification of PET. Dotted vertical line represents the undercooling associated to Tg.
0.00000 0.00005 0.00010 0.00015 0.00020 0.00025 –1
0 1 2 3 4 5 6 7 8
PET
ln R
1/(Tmº – Tc)2
ln R
452 Canova & Carvalho Materials Research
5. Isayev AI, Catignani BF. Crystallization and microstructure in quenched slabs of various molecular weight polypropylenes. Polymer Engineering and Science. 1997; 37(9):1526-1539.
6. Carvalho BM, Bretas RES. Crystallization Kinetics of a PEEK/LCP Blend. Journal of Applied Polymer Science. 1995; 55(2):233-246.
7. Sajkiewicz P, Carpaneto L, Wasiak A. Application of the Ozawa model to non-isothermal crystallization of poly(ethylene terephthalate). Polymer. 2001; 42(12):5365-5370.
8. Adamovsky SA, Minakov AA, Schick C. Scanning microcalorimetry at high cooling rate. Thermochimica Acta. 2003; 403(1):55-63.
9. Janeschitz-Kriegl H, Wippel H, Paulik C, Eder G. Polymer crystalliza-tion dynamics, as reflected by differential scanning calorimetry. Part 1: On the calibration of the apparatus. Colloid and Polymer Science. 1993; 271(12):1107-1115.
10. Wu CH, Eder G, Janeschitz-Kriegl H. Polymer crystallization dynam-ics, as reflected by differential scanning calorimetry. Part 2: Numerical simulations. Colloid and Polymer Science. 1993; 271(12):1116-1128.