doi: http://dx.doi.org/10.1590/0103-6513.191915
1. Introduction
Traditional supply chain deals with man, money and material (3M) and the green supply chain deals with man, money, material and environment (3Me). Finally, sustainable supply chain deals with man, money, material, environment and society (3MeS). Hence, the sustainable procurement process (SPP) should include the coordination of social, environmental and economic dimensions (the triple bottom line), see e.g Matos & Hall (2007). Sustainable procurement process (SPP) should also include recycling of disposed product to improve sustainability of supply chain (Geyer & Jackson, 2004).
Good practices yield better result and inspire other. Unilever launched “Unilever Sustainable Living Plan” to achieve hundred percent sourcing of agricultural raw material sustainably by 2020. As part of its Sustainable Living Plan, Unilever promotes the use of tomatoes raised sustainably in Knor soups. In 2010, Tesco developed Tesco Knowledge Hub to share knowledge
with suppliers and agricultural producers to develop sustainable supply chain to reduce the energy costs, waste and environmental impacts of the products Tesco buys to achieve thirty percent reduction of carbon emissions from the company’s supply chain by 2020, compared to 2006-07 levels. In 2014, Ceres conducted the research to measure to what extent more than 600 of the largest, publicly traded U.S. companies are integrating sustainability into their business systems and decision-making to develop the supplier self-assessment questionnaire (SAQ) to form the foundation of sustainable of supply chain. Today companies are keen to know the process of augmenting the sustainable procurement. Thus, it is true that only companies that make sustainability a goal will achieve competitive advantage (Nidumolu et al., 2009).
In this paper an attempt has been made to integrate the concept of sustainable procurement with an
Received: Mar. 28, 2015; Accepted: Nov. 19, 2015
An integrated approach of sustainable procurement
and procurement postponement for the
multi-product, assemble-to-order (ATO) production system
Krishnendu Mukherjeea*
aMechanical Engineering Department, University of Engineering & Management, Jaipur, Índia *[email protected]
Abstract
Postponement strategy is mainly used to handle the perceived variety and actual variety of product in the most cost effective way. However, postponement strategy has never been used by researchers in procurement to reduce cost and to enhance overall flexibility of the process. This paper gives a new concept of postponement, called procurement postponement, which is considered to be effective for the multi-product, assemble-to-order (ATO) system. A two-stage integrated approach of sustainable procurement and postponement method is proposed for the multi-product ATO production system to deal demand uncertainty, green house gas (GHG) emission, reliability of supply, level of disassembly and social issues of supplier selection with intuitionsitic fuzzy analytic hierarchy (IF-AHP) and multi-objective genetic algorithm (MOGA). Case study of an Indian company is discussed to use the proposed method by cost-emission-decision matrix.
Keywords
innovative postponement strategy. The complexity of production process can be avoided by manufacturing a base product or core product as per aggregate demand and then auxiliary parts/components can be manufactured and assembled after the receipt of customer demand. This approach can reduce cost, lead time and also the complexity of logistics and inventory. Thus, ‘procure when required’ or ‘procurement postponement’ could be an effective strategy of any manufacturing company that assembles products. In this paper an integrated approach of procurement postponement and sustainable procurement process is discussed in light of a case study of an Indian company. This paper is organized as follows. Section 2 discusses about literature review. Section 3 describes methodology. Section 4 depicts the mathematical model for two-stage supplier selection for ATO. Section 5 provides the case study of an Indian company. Section 6 and 7 discusses about results and conclusions.
2. Literature review
Sustainability can be achieved by changing the objectives from the economy driven towards economy, environment and society driven (Frota Neto et al., 2009). This triple bottom line approach is also the cornerstone of sustainable procurement process. Material intensity, energy intensity, water consumption, toxic emissions and pollutant emissions are five basic sustainability indicators (Schwarz et al., 2002). The sustainable procurement process basically improves above five metrics. Literature on the sustainable procurement process is very limited. Only few journal articles have been found which considered environmental and social aspects – separately or together (Amindoust et al., 2012). With this limited journal articles an attempt has been made to answer few interesting questions: Is supplier selection, one of the key elements essential to supply chain success? What are the key dimensions to measure supplier performance? How to improve sustainable procurement process with postponement strategy?
Suppliers have been acknowledged as the best intangible assets of any business organization (Muralidharan et al., 2002). Tracey & Tan (2001) mentioned that one of the key elements essential to supply chain success is an effective purchasing function. H Shin et al. (2000) proposed that the buyer performance can be enhanced with the improvement of supplier performance. Smith et al. (1995) considered that the good relationship between buyer and supplier is based upon exchanging information and sharing benefits with each other. However, Spekman (1988) showed that communication between supplier and buyer is always limited as buyer always focuses on
the price of products and ignores the importance of preserving the long term relationship with suppliers. Van Hoek (1999) proposed three approaches for green supply chain management: (1) reactive approach, (2) proactive approach, and (3) value-seeking approach. Noci (1997) divided corporative green strategies into (1) reactive strategy, and (2) proactive strategy and integrated these green issues to supplier selection. Hsu & Hu (2009) measured supplier performance with five dimensions: (1) Procurement management, (2) R&D management, (3) process management, (4) incoming quality control, (5) management of the system. Noci (1997) suggested that a firm practicing green supply chain should evaluate suppliers with four factors: (1) green competencies, (2) green images, (3) current environmental efficiency, and (4) net life cycle cost. Handfield et al. (2002) proposed an environmental conscious purchasing decision to trade-off between environmental dimensions using the analytic hierarchy process (AHP). Wu et al. (2007) proposed the integrated approach of AHP and fuzzy logic to select green suppliers. Lee et al. (2009) used both environmental and non-environmental criteria, namely, quality, technology capability, pollution control, environmental management, the green product, and green competencies, for selecting green supplier in high-tech industry. Bai & Sarkis (2010) integrated economic, environmental, and social issues into the supplier selection model. Particularly they emphasized more the social dimension in their model. On the other hand, postponement is a concept which brings the efficiency of the lean concept and the responsiveness of the agile concept together (Van Hoek, 1999). The major reason of using postponement strategy is that one extremely high demand may be offset by another extremely low demand after aggregation (Cheng, pp 3). Apart from reducing demand variability, postponement is also used to tackle process and supply uncertainties. There are four forms of postponement strategies, namely pull postponement, logistics postponement, form postponement (Lee, 1998) and price postponement (Van Mieghem & Dada, 1999). The former three strategies are also referred to as production postponement (Van Mieghem & Dada, 1999). Bowersox & Closs (1996) stated three different postponement strategies- time postponement, place postponement and form postponement. A detail classification of postponement strategy is given in Table 1.
variability is reduced by aggregation (Christopher, 2000; Ernst & Kamrad, 2000). Postponement strategy always tries to address various ways to reduce the complexity of supply chain with effective product family architecture (PFA). Its modular characteristic not only reduces the cost of assembly (Chiou et al., 2002) but also enables outsource capability and speeds up new product development (Brown et al., 2000; Ernst &
Kamrad, 2000). The more outsourcing opportunities a company can pursue with the increase of the degree of modularity. However, extensive literature review has not found any journal article which integrates postponement strategy with the sustainable supplier selection process.
3. Methodology
The proposed method is suitable for the assembled product where product variety is achieved by adding auxiliary parts/components to the main product
or base product or core product as per demand of customer. To tackle uncertainty of demand a two-stage method is considered. The base product is assumed to be manufactured by deterministic demand and auxiliary parts/component is manufactured as per stochastic demand. Stage 1 is required to select suppliers for base product and stage 2 is required to select suppliers for auxiliary parts/components. In both stages analytic hierarchy process (AHP) is used with intuitionistic fuzzy set (IFS) to select and evaluate suppliers and multi-objective genetic algorithm (MOGA) is used to allocate order to selected suppliers for deterministic and/ stochastic demand. AHP is one of the most cited multi-criteria decision analysis (MCDA) tool (Mukherjee, 2014a) and the fuzzy version of integrated AHP is mostly used for supplier selection to deal with uncertainties of the supplier selection process (Mukherjee, 2014b). Intuitionistic Fuzzy Set (IFS) is a generalized fuzzy set and is more suitable in selecting suppliers as it includes the degree
Table 1. Classification of postponement strategy.
Sl.No. Type Definition Application
1 Pull postponement
It is also known as process postponement (Brown et al., 2000),which refers to moving the decoupling point earlier in the supply chain such that fewer steps will be performed under forecast results (Lee, 1998).
1. ABC Bicycle Company, India.
2. Benetton, an apparel manufacturer, postpones its colour dyeing process until orders are received (Lee & Tang, 1998).
2 Logistics postponement
Logistics postponement involves the re-designing of some of the processes in the supply chain so that some customization can be performed downstream closer to customers (Lee, 1998). Packaging postponement and labelling postponement (Twede et al., 2000) or branding postponement (Ackerman, 1997) can be subsets of logistics postponement when the packaging, labelling or branding processes are moved closer to customers.
1. Hewlett-Packard produces generic printers at its factory and distributes them to the local distribution centres, where power plugs with appropriate voltage and user manuals in the right language are packed. Since generic printers are lighter, more units could be shipped. 2. All products in IKEA retail stores are kept in semi-finished forms (flat packs) and are assembled after home delivery by customers or deliverymen. In this way, truckload capacities can be utilized and configurations can easily be made at customer locations.
3 Form postponement
Form postponement, also called product postponement (Brown et al., 2000), gives fundamental change of the product structure by using standardized components and processes to achieve high customization (Lee, 1998; Brown et al., 2000).
1. Brown et al. (2000) applied the form postponement in a semiconductor company (Xilinx), where it re-designs the IC so that it could be re-configured by software easily and quickly for customized features and functions.
4 Price postponement
Van Mieghem & Dada (1999) defined price postponement from economic and marketing perspectives. They described the price
postponement as a strategy aimed at deferring the pricing decision until customer demand is known. Selling price is negotiated with customers after they place their orders.
1. In July 2002, Bank of China (BOC) in Hong Kong applied a price postponement strategy for its initial public offering.
5 Time postponement Customer order triggers the forward movement of goods.
1.Dell usually assembles computer after the orders are placed by customers
6 Place postponement Keep the goods in the central location of the supply chain until the customer orders are arrived.
Hindustan Unilever Limited, India’s largest consumer product company, addresses three major market segments: modern trade segment (organized retail sector), general trade segment and rural markets. The modern trade segments, consists of large urban market, are usually serviced by a HUL warehouse that supplies to the cluster of retail locations.
of hesitation to measure uncertainty associated with each decision. Further, Shannon’s Entropy is included in the proposed method to measure the discord or conflict in selecting suppliers.
3.1. Intuitionistic fuzzy set (IFS)
In 1986, Atanassov proposed a generalized concept of fuzzy set popularly known as the intuitionistic fuzzy set (IFS). If X be a universe of discourse, then IFS A can be defined as A= {(x,µA(x),νA(x))|x∈X}where µA(x), νA(x) denote membership and non-membership functions of A and satisfy 0 1≤µA( )x +νA( )x ≤ ∀ ∈ .x X For every IFS A in X, the degree of hesitation can be defined as πA(x)=1- µA( )x −νA( )x which express whether x belongs to A or not. If A = {(x,µA(x),νA(x))|x∈X} and B= {(x,µB(x),νB(x))|x∈X}then the normalized hamming distance between A and B can be represented as
( ) ( )( ) ( )( ) ( ) ( ) 1 1 1 , 2 2 A B n A B i A B
µ x µ x
l A B x x
n x x ν ν π π = − + = − + −
∑
(Szmidt & Kacprzyk, 2000). To rank three IFS, their normalized hamming distance from the ideal solution M (1,0,0) should be calculated. Lowest distance from M will give better solution.
3.2. Shannon’s entropy
Shannon’s entropy is a classical measure of discord in probability theory. Let p= <px | x∈X> a probability defined on X. Then Shannon’s entropy is defined as
( ) xlog2 x x X
S p p p
∈
= −
∑
In AHP, priority pi is the probability that ith criterion is preferred by decision maker (Sanchez & Soyer, 1998).
3.3. IF-AHP algorithm
1. Prepare intuitionistic fuzzy pairwise comparison matrix for each criterion and alternative.
2. Calculate the score (Si) of all intuitionsitic fuzzy number with any of the given formula.
SI(Xij) = µij – νij where SI(Xij) ∈ [-1,1] (1)
SII(Xij) =µij – νij.πij Where SII(Xij) ∈ [-1,1] (2)
SIII(Xij) = µij – (νij +πij)/2 Where SIII(Xij) ∈ [-0.5,1] (3)
SIV(Xij) = (µij+νij)/2 - πij Where SIV(Xij) ∈ [-1,0.5] (4)
SV(Xij) = γ . µij –(1- γ). νij where γ∈
[0,1] and SV(Xij) ∈ [-1,1] (5)
SI(Xij) is useful for the simple decision making problem and SII(Xij), SIII(Xij), SIV(Xij) are useful for the complex decision making problem (Chen, 2011).
3. Calculate the normalized score matrix with the given formula
{ }
{ }
{ }
min max min ij ij ij ij ij s s j s s s j − =− (6)
4. Normalize each row of S with the given formula
1
ij 1, 2, 3.... 1, 2, 3...
n ij j
s
s i m and j n
s
⋅
=
= ∀ = =
∑
(7)5. Calculate entropy w.r.t ith attribute with the given
formula 1 1 ln ln n
i ij ij
j
E s s
n
⋅ ⋅
=
= −
∑
(8)6. Calculate entropy weight wi with the given formula
( ) 1 1 1 i i m i i E w E = − = −
∑
(9)7. Calculate normalized entropy weight to rank criteria or alternative with the given formula
1 i i m i i W w W = =
∑
(10)4. Sourcing strategy for sustainable ATO:
a mathematical approach
Due to price competition, many companies are manufacturing in low-cost countries and selecting such a location by considering manufacturing costs, corporate tax rate, export incentives, the presence of key suppliers or duty-free imports, infrastructure, the political situation and skilled labour. In ATO base product are expected to be manufactured at low-cost countries/locations and final configurations as well packaging are expected to be made at the distribution point near to the customer.
4.1. Stage-1: selection of supplier for the
base product
warehouse in generic form. Once order is arrived, base product is shipped with the bill of material (BOM), shown in Figure 2, to retailer’s site where auxiliary part/module is prepared and assembled. In closed loop supply chain, shown in Figure 1, used products are collected from the collection site and sent to the disassemble site where products are disassembled completely or partly. After processing, disassembled parts/sub-assembly is sent to the manufacturer site where they are reused as new parts/sub-assembly. Disassembly cost varies with level of disassembly. Hence, up to a certain level product should be disassembled (Mukherjee et al., 2011).
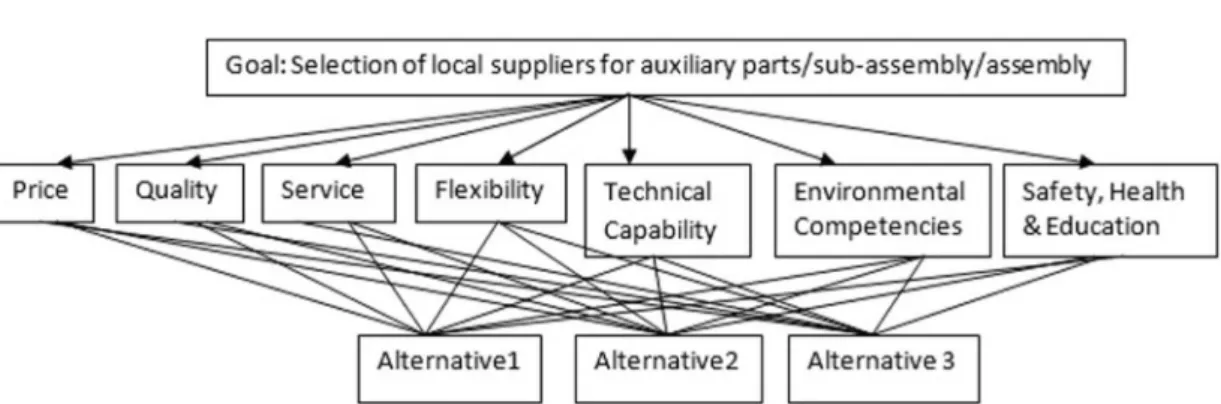
In the proposed AHP model, shown in Figure 3, flexibility encompasses volume flexibility, routing flexibility, material handling flexibility, machine flexibility, operation flexibility, expansion flexibility,
process flexibility. Proposed AHP model encompasses three main criteria to select suppliers for the base product through the sustainable procurement process.
4.2. Deterministic order allocation model
for the base product
The following assumptions are considered to prepare objective functions for supplier selection.
Assumptions
1. Multiple items are purchased from selected suppliers. 2. Quantity discounts are not taken into consideration. 3. No shortage of item is allowed for any supplier. 4. Demand of base product for the planned horizon
is constant and known with certainty.
Figure 1. The proposed 2-stage supply chain model for sustainable ATO. Source: Elaborated by the author.
Cij = the purchase cost of product j from ith supplier.
TCij = the transportation cost of product j from ith
supplier.
CCi = the overall performance index of ith supplier.
COij = the ordering cost of jth product from ith supplier.
αi = the reliability of ith supplier.
Xij= the order quantity of product j to ith supplier.
LDij= the percentage late delivery of product j from ith supplier.
Vij = the capacity of ith supplier for jth product.
Dj = the demand for jth product
Hj= the handling cost per ton of product j.
B=Total allocated budget for all products.
λj = percentage of jth product disposed at disposal site
ξj = Level of disassembly of jth product at disassembly site βi = GHG emission factor per weight unit distance due
to the use of transportation mode.
di = the distance of ith supplier from the manufacturing/
retailing site
alpha = probability value of chance constraint i= 1,2,3……… n of suppliers
j=1,2,3……. m no of products
The total cost of purchase (TCP) consists of purchase, transportation, order/setup, and holding cost.
Min TCP:
1 1 1 1 1 1 1 1
n m n m m n n m
ij ij ij ij j i Oij ij
i j i j j i i j
C X TC X H X C X
= = = =+ = += = = +
∑∑
∑∑
∑ ∑ ∑∑
(11)In the second objective function total value of reliable purchase (TVRP) is considered instead of total value of purchase (TVP) proposed by Ghodsypour
& O’Brien (1998). The reliability of supply, ,αi of each supplier is obtained from supplier’s reliability measurement data sheet, Table 2, to form TVRP equation.
Maximize TVRP: 1 1
n m i i ij i j
CC X
α
= =
∑∑
(12)Minimize number of late deliveries: 1 1
n m ij ij i j
LD X
= =
∑∑
(13)Minimize GHG emission for inbound logistics:
1 1
n m
i i ij
i j
d X
β
= =
∑ ∑
(14)Subject to
Capacity constraint:
1 1 1 1
m n m n
ij ij
j i j i
X V
= = ≤ = =
∑∑
∑∑
fori=1,2,3...n and j=1,2,3….m (15)
Demand constraint:
( )
1 1 1 11
m n m m
ij j j j j
j i j j
X D λ ξD
= = =−= − =
∑∑
∑ ∑
(16)Cost constraint: 1 1
m n ij ij j i
C X B
= = ≤
∑∑
(17)Non-negativity constraint: Xij≥ 0 for
i=1,2,3...n and j=1,2,3…m. (18)
4.3. Stage-II: supplier selection for auxiliary
parts
Higher priority is given to flexibility and technical capability of suppliers to tackle high volatile demand at retailer’s site. In this regard, an AHP model of supplier selection for auxiliary parts/sub-assembly is prepared, shown in Figure 4, to augment sustainable procurement process at retailer’s site.
4.4. Mathematical model for stochastic
demand
A multi-objective stochastic model is considered at retailers’ site to deal with uncertainty in demand. It is assumed that suppliers are very close to the retailer’s site. Therefore, transportation cost as well GHG emission through transportation is very negligible.
Min TCP:
1 1 1 1 1 1
n m m n n m
ij ij j i Oij ij
i j j i i j
C X H X C X
= = =+ = = =+
∑∑
∑ ∑ ∑∑
(19)Maximize TVRP: 1 1
n m
i i ij i j
CC X
α
= =
∑∑
(20)Minimize number of late deliveries: 1 1
n m
ij ij i j
LD X
= =
∑∑
(21)Subject to
Demand constraint: Pr 1
n
ij j
i
x D alpha
=
≥
∑
≥ (22)Table 2. Supplier data sheet.
Name
Cost (INR) Ordering Cost (INR/tonne)
Capacity
(Tonne) % late delivery
Distance
(Km) Mode of Transport Prod A Prod B Prod
A
Prod B
Prod A
Prod B
Supp. 1 100 150 2000 3000 1000 2000 0.2 190
1. By HGV
2. 100 Km by rail and 90 Km by HGV
Supp. 2 102 149 2000 3000 1000 1500 0.15 200 1. By Large container
Supp. 3 101 150 2000 3000 1000 1500 0.2 180 1. By HGV
Supp. 4 100 151 2000 3000 1000 1500 0.15 200
1.160 Km by rail and 40 Km by HGV.
2. By HGV
Supp. 5 103 152 2000 3000 1000 1500 0.1 240 1.200 Km by rail and 40 Km
by HGV.
Supp. 6 102 150 2000 3000 1000 2000 0.2 240 1. By HGV2.200 Km by rail and 40 Km by HGV.
Source: Elaborated by the author.
Above chance constrained can be converted to a deterministic constraint as follows (Guan et al., 2007)
( )
1 1 1
n m
ij j j
i j
X µ − alpha σ
= = ≥ + Φ
∑∑
(23)Where,
( ) ( ) ( )
2
2 1
2
1
,
2
X µ X
X e σ dX alpha alpha X
πσ
−
− −
−∞
Φ =
∫
= Φ = (24)Capacity constraint:
1 1 1 1
m n m n
ij ij
j i j i
X V
= = ≤ = =
∑∑
∑∑
(25)Cost constraint: 1 1
m n ij ij j i
C X B
= = ≤
∑∑
(26)Non-negativity constraint: Xij≥ 0 for
i=1,2,3...n and j=1,2,3…m. (27)
5. Case study
An Indian Company is manufacturing/assembling product A and B as per the bill of material shown in Figure 2. The company is 40 km away from the railway station and well connected with other cities by road. Considering fluctuation of market demand of product A and B, company is seeking effective procurement strategy for their ATO production system. The company has assembling unit in Punjab and retailers in different parts of India. Base product is manufactured as per the forecast and stored at the central warehouse shown in Figure 1. After receiving the customer order, the base product is brought to retailer shops in 15 to 20 days. Auxiliary parts/components/ sub-assemblies are manufactured or assembled at the retailer site. It is assumed that material handling
cost is 10% of procurement cost from each supplier. The aggregate demand for raw material to produce base product in the planning horizon is 4,900 tones. Senior members of different departments such as Finance, Marketing, Design and Manufacturing are asked to form a team of decision makers to select the right supplier for the company. Initially, a supply base is formed based on their industrial certifications such as ISO, TUV etc, material test data and ability to supply within the lead time. Based on the above information supplier’s data sheet, is prepared, and shown in Table 2. Distance and mode of transfer mentioned in Table 2 is used further to calculate cost of emission for inbound transport.
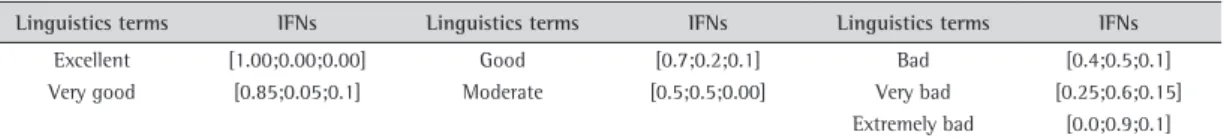
Linguistic terms, shown in Table 3, are used to prepare supplier’s reliability measurement data sheet, shown in Table 4. Arithmetic mean of each IFN, shown in Table 4, is used to calculate reliability of each supplier, shown in Figure 5.
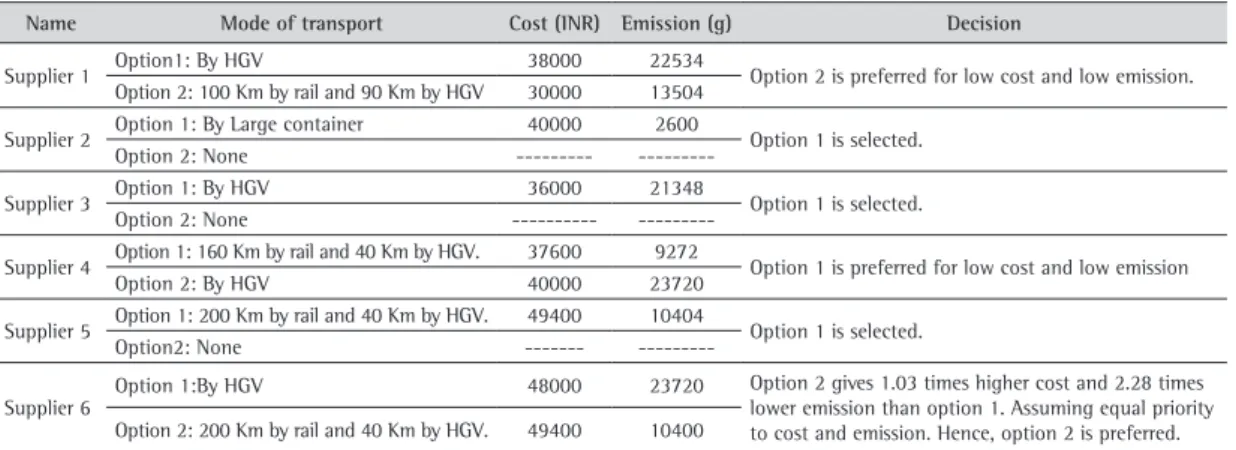
The normal hamming distance of each supplier is measured from ideal IFN (1.0;0.0;0.0). Complement of the normal hamming distance is considered as the overall reliability of each supplier. Cost-Emission-Decision Matrix is prepared with Table 5 and Table 6, shown in Table 7. Cost coefficient and emission coefficient from Cost-Emission-Decision Matrix is used to prepare transportation cost and GHG emission objective function, mentioned in Equation 11 and Equation 14, respectively. Local supplier performance matrix is prepared further with Table 3 and Table 8, shown in Table 9. Supplier’s data sheet for auxiliary product and demand of products at retailer’s site, shown in Table 10 and Table 11, are prepared to select and to distribute order to the selected suppliers at retailer’s site as per stochastic demand.
Table 3. Linguistic terms.
Linguistics terms IFNs Linguistics terms IFNs Linguistics terms IFNs
Excellent [1.00;0.00;0.00] Good [0.7;0.2;0.1] Bad [0.4;0.5;0.1]
Very good [0.85;0.05;0.1] Moderate [0.5;0.5;0.00] Very bad [0.25;0.6;0.15] Extremely bad [0.0;0.9;0.1] Source: Elaborated by the author.
Table 4. Supplier’s Reliability measurement data sheet.
Name Technical Qualification of workers Supplier’s Quality System Past supply of similar raw material
Supplier1 Good Good Good
Supplier2 Moderate Good Good
Supplier3 Bad Moderate Bad
Supplier4 Moderate Good Good
Supplier5 Excellent Excellent Excellent
Supplier6 Good Excellent Very good
Figure 5. IFN values for supplier’s reliability factors. Source: Elaborated by the author.
Table 5. Freight transmission emission factor (Department of Energy and Climate Change, 2009).
Mode Road LGV HGV Rail Small tanker Large container g/tonne-km 400.1 118.6 28.3 20 13 Source: Elaborated by the author.
Table 6. Inbound logistics cost (Freight Operations Information System, 2012).
Mode
Transportation Charges (INR/tone-Km)
Mode Distance (Km)
Approx. Transportation
Charges (INR/tonne-Km) From To
By road 200
By rail Train load LR4 Wagon load 120
1 100 120
101 125 142
126 150 165
151 175 185
176 200 207
Source: Elaborated by the author.
Table 7. Cost-Emission-Decision Matrix per unit tonne of transport.
Name Mode of transport Cost (INR) Emission (g) Decision
Supplier 1 Option1: By HGV 38000 22534 Option 2 is preferred for low cost and low emission. Option 2: 100 Km by rail and 90 Km by HGV 30000 13504
Supplier 2 Option 1: By Large container 40000 2600 Option 1 is selected.
Option 2: None ---
---Supplier 3 Option 1: By HGV 36000 21348 Option 1 is selected.
Option 2: None ---
---Supplier 4 Option 1: 160 Km by rail and 40 Km by HGV. 37600 9272 Option 1 is preferred for low cost and low emission
Option 2: By HGV 40000 23720
Supplier 5 Option 1: 200 Km by rail and 40 Km by HGV. 49400 10404 Option 1 is selected.
Option2: None ---
---Supplier 6 Option 1:By HGV 48000 23720
Option 2 gives 1.03 times higher cost and 2.28 times lower emission than option 1. Assuming equal priority to cost and emission. Hence, option 2 is preferred. Option 2: 200 Km by rail and 40 Km by HGV. 49400 10400
is allocated to supplier 3 as supplier 3 has highest reliability and IFS priority value.
7. Conclusion
In this paper, a new concept and an innovative method is proposed to initiate sustainable procurement process (SPP) by integrating the concept of sustainable supply chain and postponement strategy. The proposed method has several advantages, including but not limited to:
(1) The proposed model is very simple and easy to apply.
(2) It can be used for single item as well as multiple item of the assembly-to-order production system for stochastic and/ deterministic demand. (3) It considers reliability of supply to reduce inbound
risk.
(4) The proposed model also gives better supply chain visibility as it integrates far downstream customers with manufacturer through active co-operation of retailers. However, manufacturer should take appropriate strategy to share limited information with its retailers to maintain better security.
6. Results
Intel core i5 PC with 3 GB RAM is used to solve the model. Microsoft Excel is used for IF-AHP and Matlab R 2009a is used for MOGA. Uncertainty in demand at retailer’s site changes the amount of order in considerable amount for supplier 3, shown in Figure 6. For different values of alpha, highest order
Table 11. Demand of products at retailer’s site.
Product Type µJ (unit) σJ (unit) α Φ–1(α)
Product A 2500 1000 0.85 1.0364
Product B 2400 1200 0.85 1.034
Source: Elaborated by the author.
Table 10. Supplier’s data sheet for auxiliary product.
Name
Cost (INR) Ordering Cost (INR/piece)
Capacity
(piece) % late
delivery Reliability IFS priority value Prod A Prod B Prod
A
Prod B
Prod A
Prod B
Supplier 1 200 350 200 300 1000 2000 0.2 0.65 0.091825
Supplier 2 202 349 200 300 1000 1500 0.15 0.68 0.232825
Supplier 3 201 350 200 300 1000 1500 0.2 0.69 0.6751
Source: Elaborated by the author.
Table 9. Local Supplier Performance Matrix.
Name Price Quality Service Flexibility Technical Capability
Supplier 1 Very Costly Very good Good Very Good Excellent
Supplier 2 Cheap Good Moderate Good Moderate
Supplier 3 Cheap Good Moderate Moderate Moderate
Source: Elaborated by the author.
Table 8. Linguistic terms.
Linguistic Terms IFNs
Very Costly [1.00;0.00;0.00]
Costly [0.75;0.15;0.1]
Cheap [0.6;0.3;0.1]
Very Cheap [0.5;0.3;0.2]
Source: Elaborated by the author.
Figure 6. Order allocation at different value of alpha. Source:
hierarchy process and linear programming. International Journal of Production Economics, 56-57, 199-212. http:// dx.doi.org/10.1016/S0925-5273(97)00009-1.
Guan, Z., Jin, Z., & Zou, B. (2007). A multi-objective mixed-integer stochastic programming model for the vendor selection problem under multi-product purchases. Information and Management Sciences, 18(3), 241-252.
Handfield, R., Walton, S., Sroufe, R., & Melnyk, S. (2002). Applying environmental criteria to supplier assessment: a study in the application of the analytical hierarchy process. European Journal of Operational Research, 141(1), 70-87. http://dx.doi.org/10.1016/S0377-2217(01)00261-2. Heskett, J. L. (1976). Marketing. New York: Macmillan
Publishing Co.
Hsu, C.-W., & Hu, A. H. (2009). Applying hazardous substance management to supplier selection using analytic network process. Journal of Cleaner Production, 17(2), 255-264. http://dx.doi.org/10.1016/j.jclepro.2008.05.004. L e e , H . L . ( 1 9 9 8 ) . P o s t p o n e m e n t f o r m a s s
customization: satisfying customer demands for tailor-made products. In J. Gattorna (Ed.), Strategic Supply Chain Alignment. Surrey: Gower.
Lee, H. I., Kang, H. Y., Hsu, C. F., & Hung, H. C. (2009). A green supplier selection model for high-tech industry. Expert Systems with Applications, 36(4), 7917-7927. http://dx.doi. org/10.1016/j.eswa.2008.11.052.
Lee, H. L., & Tang, C. S. (1998). Variability reduction through operations reversal. Management Science, 44(2), 162-172. Matos, S., & Hall, J. (2007). Integrating sustainable development
in the supply chain: the case of life cycle assessment in oil and gas and agricultural biotechnology. Journal of Operations Management, 25(6), 1083-1102. http://dx.doi. org/10.1016/j.jom.2007.01.013.
Mukherjee, K. (2014a). Analytic hierarchy process and technique for order preference by similarity to ideal solution: a bibliometric analysis ‘from’ past, present and future of AHP and TOPSIS. International Journal of Intelligent Engineering Informatics, 2(2/3), 96-117. http://dx.doi. org/10.1504/IJIEI.2014.066210.
Mukherjee, K. (2014b). Supplier selection criteria and methods: past, present and future. International Journal of Operational Research. In press.
Mukherjee, K., Sarkar, B., & Bhattacharya, A. (2011). Comments on the erratum to “Supply planning model for remanufacturing system in reverse logistics environment” Computers &
Industrial Engineering, 61(4), 1349-1350. http://dx.doi. org/10.1016/j.cie.2011.06.013.
Muralidharan, C., Anantharaman, N., & Deshmukh, S. G. (2002). A multi-criteria group decision making model for supplier rating. The Journal of Supply Chain Management, 38(3), 22-33. http://dx.doi.org/10.1111/j.1745-493X.2002.tb00140.x. Nidumolu, R., Prahalad, C.K., & Rangaswami, M.R. (2009).
Why sustainability is now the key driver of innovation? Harvard Business Review,.
Noci, G. (1997). Design “green” vendor rating systems for the assessment of a supplier’s environmental performance. European Journal of Purchasing & Supply Management, 3(2), 103-114. http://dx.doi.org/10.1016/S0969-7012(96)00021-4. Sanchez, P. P., & Soyer, R. (1998). Information concepts and
pairwise comparison matrices. Information Processing Letters, 68(4), 185-188. http://dx.doi.org/10.1016/S0020-0190(98)00161-6.
In addition to the above this innovative method can reduce logistic lead time, chances of over stock or under stock and the complexity of inventory. This proposed method is suitable for manufacturing industries which particularly assembled different components to develop complex products.
References
Ackerman, K. B. (1997). Postponement: practical handbook of warehousing. 4th ed. New York: Chapman and Hall. Amindoust, A., Ahmed, S., Saghafinia, A., & Bahreininejad, A.
(2012). Sustainable Supplier Selection: a ranking model based on fuzzy inference system. Applied Soft Computing, 12(6), 1668-1671. http://dx.doi.org/10.1016/j.asoc.2012.01.023. Bai, C., & Sarkis, J. (2010). Green supplier development:
analytical evaluation using rough set theory. Journal of Cleaner Production, 18(12), 1200-1210. http://dx.doi. org/10.1016/j.jclepro.2010.01.016.
Bowersox, D. J., & Closs, D. J. (1996). Logistical management, the integrated supply chain process. New York: Macmillan Publishing Company.
Brown, A. O., Lee, H. L., & Petrakian, R. (2000). Xilinx improves its semiconductor supply chain using product and process postponement. Interfaces, 30(4), 65-80.
Chen, T. Y. (2011). A comparative analysis of score functions for multiple criteria decision making in intuitionistic fuzzy settings. Information Sciences, 181(17), 3652-3676. http:// dx.doi.org/10.1016/j.ins.2011.04.030.
Cheng, T. C. E., & Podolsky, S. (1996). Just-in-time manufacturing: an introduction. 2nd ed. London: Chapman and Hall. Chiou, J. S., Wu, L. Y., & Hsu, J. C. (2002). The
adoption of form postponement strategy in a global logistics system: the case of Taiwanese information technology industry. Journal of Business Logistics, 23, 107-124.
Christopher, M. (2000). The agile supply chain: competing in volatile markets. Industrial Marketing Management, 29(1), 37-44.
Department of Energy and Climate Change. (2009). Guidelines to Defra/DECC’s GHG conversion factors for company reporting: methodology paper for emission factors. London: DECC. Ernst, R., & Kamrad, B. (2000). Evaluation of
supply chain structures through modularization and postponement. European Journal of Operational Research, 124, 495-510.
Freight Operations Information System. (2012). Retrieved in 01 January, 2015, from https://www.fois.indianrail.gov. in/FoisWebsite/html/Freight_Rates.htm
Frota Neto, J. Q., Walther, G., Bloemhof, J., Van Nunen, J. A. E. E., & Spengler, T. (2009). From closed-lo op to sustainable supply chains: The WEEE case. International Journal of Production Research, 48(15), 4463-4481. http://dx.doi. org/10.1080/00207540902906151.
Geyer, R., & Jackson, T. (2004). Supply loops and their constraints: the industrial ecology of recycling and reuse. California Management Review, 46(2), 55-73. http://dx.doi. org/10.2307/41166210.
Twede, D., Clarke, R. H., & Tait, J. A. (2000). Packaging postponement: a global packaging strategy. Packaging Technology and Science, 13(3), 105-115</jrn>.
Van Hoek, R. I. (1999). From reversed logistics to green supply chains. Supply Chain Management, 4(3), 129-134. http:// dx.doi.org/10.1108/13598549910279576.
Van Mieghem, J. A., & Dada, M. (1999). Price versus production postponement: capacity and competition. Management Science, 45(12), 1631-1649.
Wu, C. H., Kuo, T. C., & Lu, Y. Y. (2007). Environmental principles applicable to green supplier evaluation by using multi-objective decision analysis. International Journal of Production Research, 45(18-19), 4317-4331. http://dx.doi. org/10.1080/00207540701472694.
Acknowledgements
The author expresses gratitude to two anonymous reviewers for their valuable comments and the detailed reading of the paper.
Schwarz, J., Beloff, B., & Beave, E. (2002). Use sustainability metrics to guide decision-making. CEP Magazine, July, 58-63. Retrieved in 01 January, 2015, from www. cepmagazine.org
Shin, H., Collier, D. A., & Wilson, D. D. (2000). Supply management orientation and supplier buyer performance. Journal of Operations Management, 18(3), 317-333. http://dx.doi. org/10.1016/S0272-6963(99)00031-5.
Smith, K. G., Carroll, S. J., & Ashford, S. J. (1995). Intra-and inter-organizational cooperation: toward a research agenda. Academy of Management Journal, 38(1), 7-23. http:// dx.doi.org/10.2307/256726.
Spekman, R. E. (1988). Perceptions of strategic vulnerability among industrial buyers and its effect on information search and supplier evaluation. Journal of Business Research, 17(4), 313-326. http://dx.doi.org/10.1016/0148-2963(88)90042-2. Szmidt, E., & Kacprzyk, J. (2000). Distance between intuitionistic
fuzzy sets. Fuzzy Sets and Systems, 114(3), 505-518. http:// dx.doi.org/10.1016/S0165-0114(98)00244-9.