Lu´ıs Miguel Gon¸
calves Miranda
Licenciado em Ciˆencias da Engenharia Electrot´ecnica e de
Computadores
Data Fusion with Computational
Intelligence techniques: a case study of
Fuzzy Inference for terrain assessment
Disserta¸c˜ao apresentada para obten¸c˜ao do Grau de Mestre em
Engenharia Electrot´ecnica e de Computadores, pela Universidade Nova
de Lisboa, Faculdade de Ciˆencias e Tecnologia
Orientador :
Jos´e Manuel Fonseca, Professor Auxiliar, FCT/UNL
Co-Orientador : Rita Almeida Ribeiro, Professora Associada, FCT/UNL
J´
uri:
Presidente:
Tiago Oliveira Cardoso, FCT/UNL
Arguente:
Lu´ıs Miguel Correira, FCUL
Vogal:
Jos´e Manuel Fonseca, FCT/UNL
Data Fusion with Computational Intelligence techniques: a case study of Fuzzy Inference
for terrain assessment
Copyright c2014 Luís Miguel Gonçalves Miranda, Faculdade de Ciências e Tecnologia, Univer-sidade Nova de Lisboa
Agradecimentos
Resumo
Com a constante progressão tecnológica está inerente o aumento exponencial dos arquivos dig-itais com todo o tipo de dados. Esses dados, por si só, podem não ter um significado preciso e podem até mesmo ser impossíveis de processar sem auxílio de ferramentas específicas. A fusão de dados contribui para esta problemática através da combinação de dados de forma a gerar informação útil para quem os analisa.
Dentro da fusão de dados existem inúmeras abordagens e metodologias de processamento de dados, sendo aqui dado destaque àquela que em certa medida mais se assemelha ao conheci-mento impreciso efectuado por um humano, o raciocínio difuso. Esta metodologia é aplicada nas mais variadas áreas, inclusivé como sistema de inferência em sistemas baseados em regras para escolha de local de aterragem de naves espaciais usando mapas de risco. Para tal é importante o uso de sistemas de inferência difusa, onde o problema é modelado através de um conjunto de regras linguísticas, conjuntos difusos, funções de pertença e demais informação.
Assim, nesta tese foram desenvolvidos um sistema de inferência difuso, para detecção de locais de aterragem seguros utilizando fusão de mapas, e uma ferramenta de visualização de dados. Deste modo ficam facilitadas a classificação e validação da informação que se tem em mãos.
Palavras Chave
Abstract
With the constant technology progression is inherent storage of all kinds of data. Satellites, mo-bile phones, cameras and other type of electronic equipment, produce on daily basis an amount of data of gigantic proportions. These data alone may not convey any meaning and may even be impossible to interpret them without specific auxiliary measures. Data fusion contributes in this issue giving use of these data, processing them into proper knowledge for whom analyzes.
Within data fusion there are numerous processing approaches and methodologies, being given here highlight to the one that most resembles to the imprecise human knowledge, the fuzzy rea-soning. These method is applied in several areas, inclusively as inference system for hazard detection and avoidance in unmanned space missions. To this is fundamental the use of fuzzy inference systems, where the problem is modeled through a set of linguistic rules, fuzzy sets, membership functions and other information.
In this thesis it was developed a fuzzy inference system, for safe landing sites using fusion of maps, and a data visualization tool. Thus, classification and validation of the information are made easier with such tools.
Keywords
Contents
1 Introduction 1
1.1 Motivation . . . 4
1.2 Objectives and Contributions . . . 4
1.3 Structure of the Dissertation . . . 5
2 State of the Art 7 2.1 What is Data Fusion? . . . 8
2.2 Challenging Problems of Data Fusion . . . 9
2.3 Data Fusion Branches . . . 11
2.3.1 Image Fusion . . . 12
2.3.2 Multi-Sensor Fusion . . . 13
2.3.3 Information Fusion . . . 14
2.3.4 Low-Level Fusion versus High-Level Fusion . . . 15
2.4 Fusion System Architectures . . . 16
2.4.1 Centralized Fusion Architecture . . . 17
2.4.2 Decentralized Fusion Architecture . . . 17
2.4.3 Distributed Fusion Architecture . . . 18
2.4.4 Hierarchical Fusion Architecture . . . 18
2.4.5 Difference Between Decentralized and Distributed Architecture . . . 19
2.5 Fusion Models . . . 20
2.5.1 JDL Model . . . 20
2.5.2 Waterfall Model . . . 22
2.5.3 Luo and Kay Model . . . 23
2.5.4 Thomopoulos Model . . . 24
2.5.5 Intelligence Cycle . . . 25
2.5.6 Boyd Control Loop Model . . . 26
2.5.7 Dasarathy Model . . . 27
2.5.8 Omnibus Model . . . 27
2.5.9 Distributed Blackboard Model . . . 28
2.6.1 Fusion Algorithm Taxonomy . . . 29
2.6.1.1 Fusion of Imperfect Data . . . 30
2.6.1.2 Fusion of Correlated Data . . . 31
2.6.1.3 Fusion of Inconsistent Data . . . 31
2.6.2 Fuzzy Reasoning . . . 32
2.6.2.1 Takagi-Sugeno Fuzzy Model . . . 34
2.6.3 Fuzzy Information Fusion . . . 35
2.7 Supporting Technologies to Data Fusion . . . 36
2.7.1 Probabilistic and Statistical Methods . . . 36
2.7.1.1 Bayes’ Theorem . . . 36
2.7.1.2 Kalman Filter . . . 37
2.7.1.3 Monte Carlo Simulation . . . 38
2.7.2 Dempster-Shafer Evidential Theory . . . 39
2.7.3 Neural Networks . . . 39
2.7.4 Possibilistic Theory . . . 41
2.7.5 Rough Set Theory . . . 42
2.7.6 Methods Summary . . . 43
2.8 Data Fusion Applications . . . 43
2.8.1 Military . . . 44
2.8.2 Remote Sensing . . . 45
2.8.3 Equipment Monitoring and Diagnostics . . . 46
2.8.4 Biomedical . . . 47
2.8.5 Transportation Systems . . . 48
2.8.6 Robotics . . . 49
3 Hazard Detection and Avoidance 51 3.1 Hazard Detection and Avoidance in Planetary Entry, Descent and Landing . . . 52
3.1.1 Safe Site Selection . . . 53
3.2 FUSION - Sensor Data Fusion for Hazard Mapping and Piloting . . . 54
3.3 IPSIS - Intelligent Planetary SIte Selection . . . 55
3.3.1 IPSIS Approaches to Site Selection . . . 56
4 Developed Work 59 4.1 Fuzzy Reasoning Algorithm . . . 60
4.1.1 Algorithm Description . . . 61
4.1.2 Projecting Fuzzy Inference Systems . . . 63
4.1.2.1 Camera Terrain Safety Rules . . . 64
Contents
4.1.2.3 Terrain Safety Classification . . . 65
4.1.2.4 Defining Membership Functions . . . 66
4.1.3 Functions Description . . . 67
4.1.3.1 Parameters File Reader Functions . . . 68
4.1.3.2 Evaluate Function . . . 69
4.1.3.3 Fis value evaluation Function . . . 69
4.1.3.4 Fuzzification Function . . . 70
4.1.3.5 Fuzzy inference method Function . . . 70
4.2 Oracle Viewer . . . 71
4.2.1 Functions Description . . . 71
4.2.1.1 Menuhotkeys Function . . . 73
4.2.1.2 Pushbuttonplot Function . . . 73
4.2.1.3 Plotoracles Function . . . 73
4.2.1.4 Oraclebestsites Function . . . 74
4.2.1.5 Calculateregion Function . . . 74
4.2.1.6 Plotpixelregion Function . . . 74
4.2.1.7 Plothazardmap Function . . . 75
4.2.1.8 Plothazardmapdetail Function . . . 75
4.2.1.9 Drawpixelregion Function . . . 76
4.2.2 User Guide . . . 76
4.2.2.1 Main Interface . . . 76
4.2.2.2 Data Visualization and Analysis . . . 78
4.2.2.3 Good Landing Site Example . . . 79
4.2.2.4 Bad Landing Site Example . . . 83
4.2.2.5 Special Functionality . . . 84
5 Results and Discussion 85 5.1 Execution Example . . . 86
5.2 Computational Requirements . . . 88
6 Conclusions 91 6.1 Conclusions . . . 92
List of Figures
1.1 The Knowledge Pyramid. Taken from (Biermann et al., 2004). . . 2
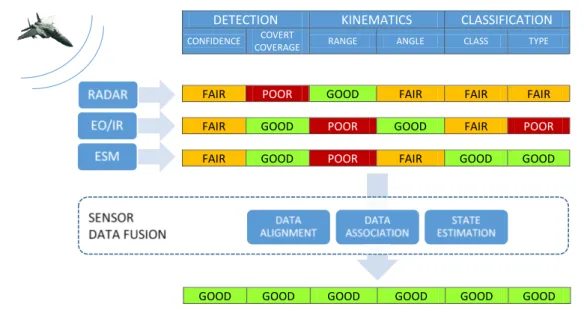
2.1 Fighter aircraft with multiple sensors uses data fusion for integrating detection, kinematics and classification assessments (EO/IR Electrooptical/InfraRed; ESM -Electronic Support Measures). Adapted from (Steinberg et al., 1999). . . 8
2.2 Pulsed radar and a Forward-Looking InfraRed (FLIR) imaging sensor with data correlation. Taken from (Liggins et al., 2008, Ch. 1). . . 13
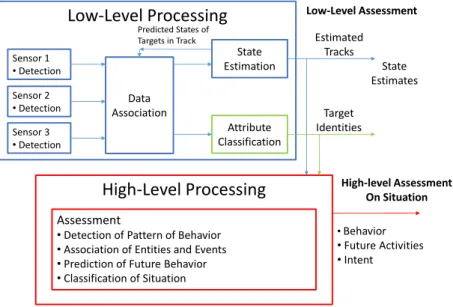
2.3 Low-level processing versus high-level processing. Adapted from (Blasch et al., 2010). . . 15
2.4 Centralized architecture. Taken from (Castanedo, 2013). . . 17
2.5 Decentralized architecture. Taken from (Castanedo, 2013). . . 17
2.6 Distributed architecture. Taken from (Castanedo, 2013). . . 18
2.7 Hierachical fusion architecture without and with feedback. Adapted from (Liggins et al., 2008, Ch. 17). . . 19
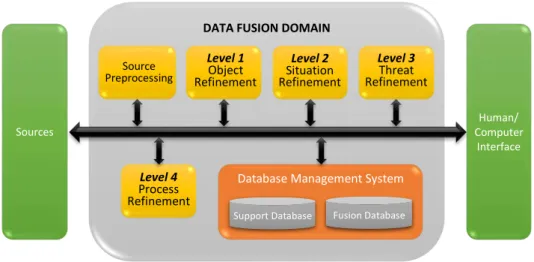
2.8 The JDL data fusion model. Adapted from (Steinberg et al., 1999). . . 21
2.9 The Waterfall data fusion process model. Taken from (Veloso et al., 2009). . . 22
2.10 Luo and Kay data fusion process model. Taken from (Veloso et al., 2009). . . 23
2.11 Thomopoulos data fusion process model. Taken from (Veloso et al., 2009). . . 24
2.12 The UK intelligence cycle. Adapted from (Bedworth and O’Brien, 2000). . . 25
2.13 The Boyd (or OODA) control loop data fusion process model. Adapted from (Bed-worth and O’Brien, 2000). . . 26
2.14 The Omnibus model - a unified data fusion process model. Taken from (Liggins et al., 2008, Ch. 22). . . 28
2.15 Distributed blackboard data fusion process model. Taken from (Veloso et al., 2009). 29 2.16 Taxonomy of data fusion methodologies. Taken from (Khaleghi et al., 2013). . . 30
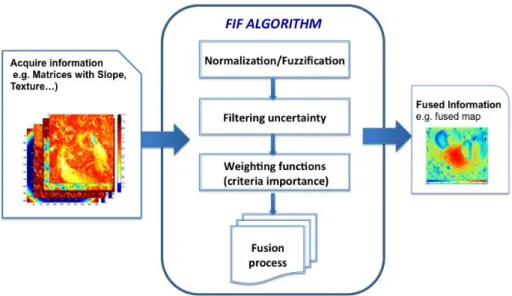
2.17 FIF algorithm architecture. Taken from (Ribeiro et al., 2014). . . 35
2.18 Recursive calculations in a KF. Taken from (Dailey and Lin, 1996). . . 38
2.19 An abstract neuron. Taken from (Rojas, 1996). . . 40
2.21 A generic layered neural network. Taken from (Rojas, 1996). . . 41
2.22 Example of an ocean surveillance system. Taken from (Liggins et al., 2008, Ch. 1). 44 2.23 The World Meteorological Organization Global Satellite Observing System, 2009. Taken from (WMO, 2010). . . 45
2.24 Penn State Applied Research Laboratory mechanical diagnostics testbed. Taken from (Liggins et al., 2008, Ch. 28). . . 46
2.25 A Pervasive Healthcare Approach. Taken from (Lee et al., 2008). . . 47
2.26 Example of an Advanced Driver Assistance System. Taken from (TI, 2013). . . 48
2.27 An artificial hand for robot arm. Taken from (ESA, 2010). . . 50
3.1 EDL phases of Curiosity Mars Rover. Taken from (NASA, 2014a). . . 52
3.2 Lander vision system. Taken from (Johnson and Golombek, 2012). . . 53
3.3 Hazard maps fusion. Taken from (CA3, 2013b). . . 54
3.4 HDA architecture and link with GNC. Taken from (Simões et al., 2012). . . 55
3.5 Simplified view of classical site selection based on exhaustive evaluation. Taken from (Bourdarias et al., 2010). . . 57
3.6 Simplified view of site selection based on non-exhaustive search methodologies. Taken from (Bourdarias et al., 2010). . . 58
4.1 Input hazard maps. . . 60
4.2 Solving approach with Fuzzy Reasoning Algorithm. . . 62
4.3 Rule evaluation example. . . 62
4.4 Fuzzy Reasoning model decomposition. Adapted from FUSION Internal Report. . 63
4.5 Trapezoidal membership function. . . 66
4.6 Camera sensor membership functions. . . 66
4.7 Lidar sensor membership functions. . . 67
4.8 FRA♠❛✐♥call graph. . . 68
4.9 Oracle Viewer data visualization tool main call graph. . . 72
4.10 Main interface (cropped from the original window size). . . 76
4.11 Menu bar. . . 77
4.12 Hotkeys list. . . 77
4.13 Iteration Info panel. . . 78
4.14 Main interface for iteration data visualization and analysis. . . 78
4.15 Best Sites panel (Min example). . . 79
4.16 Min aggregation method image detail. . . 79
4.17 Min aggregation method image (zoomed in). . . 80
4.18 Min aggregation method image detail (crosshair andgrid on). . . 80
List of Figures
4.20 Min aggregation method image detail (region selection). . . 81
4.21 Pixel region information of(94,30)site. . . 82
4.22 Pixel region information of(94,30)site: Slope map info. . . 82
4.23 Pixel region information of(94,30)site: Slope details (pixel value). . . 83
4.24 Pixel region information of(118,100)site. . . 83
4.25 Pixel region information of(118,100)site: Slope details (pixel value). . . 84
4.26 Pixel region information: ILUV Reachability details (pixel direction). . . 84
5.1 Sensor fuzzy-based safety maps. . . 86
5.2 Final fuzzy-based safety map output. . . 87
5.3 Oracle’s exhaustive search best site. . . 87
5.4 CallGrind output for FRA (test_fuzzy). . . 90
List of Tables
2.1 Characteristics of Luo and Kay Model data fusion levels. Adapted from (Esteban
et al., 2005). . . 24
2.2 The five levels of fusion in the Dasarathy model. Taken from (Bedworth and O’Brien, 2000). . . 27
2.3 Main characteristics of data fusion methods applied to HDA. Adapted from (Ribeiro et al., 2014). . . 43
4.1 Camera terrain safety fuzzy rule set. Adapted from (Serrano et al., 2006). . . 64
4.2 Lidar terrain safety fuzzy rule set. Adapted from (Serrano et al., 2006). . . 65
4.3 Crisp output values of the linguistic singleton terrain fuzzy sets. . . 65
4.4 Camera sensor criteria specifications. . . 66
4.5 Lidar sensor criteria specifications. . . 67
4.6 FRA❧♦❛❞❴♣❛r❛♠❡t❡rsfunction inputs. . . 68
4.7 FRA❧♦❛❞❴s❡♥s♦rparameters inputs. . . 68
4.8 FRA❡✈❛❧✉❛t❡function inputs and outputs. . . 69
4.9 FRA❢✐s❴✈❛❧✉❡❴❡✈❛❧✉❛t✐♦♥function inputs. . . 70
4.10 FRA❢✉③③✐❢✐❝❛t✐♦♥function inputs. . . 70
4.11 FRA❢✉③③②❴✐♥❢❡r❡♥❝❡❴♠❡t❤♦❞function inputs. . . 71
4.12 Oracle Viewer♠❡♥✉❤♦t❦❡②sfunction inputs. . . 73
4.13 Oracle Viewer♣✉s❤❜✉tt♦♥♣❧♦tfunction inputs. . . 73
4.14 Oracle Viewer♣❧♦t♦r❛❝❧❡sfunction inputs. . . 73
4.15 Oracle Viewer♦r❛❝❧❡❜❡sts✐t❡sfunction inputs. . . 74
4.16 Oracle Viewer❝❛❧❝✉❧❛t❡r❡❣✐♦♥function inputs and outputs. . . 74
4.17 Oracle Viewer♣❧♦t♣✐①❡❧r❡❣✐♦♥function inputs. . . 75
4.18 Oracle Viewer♣❧♦t❤❛③❛r❞♠❛♣function inputs and outputs. . . 75
4.19 Oracle Viewer♣❧♦t❤❛③❛r❞♠❛♣❞❡t❛✐❧function inputs. . . 75
4.20 Oracle Viewer❞r❛✇♣✐①❡❧r❡❣✐♦♥function inputs and outputs. . . 76
5.1 Algorithm’s best site details. . . 88
5.2 FRA execution time. . . 89
Acronyms
CA3 Computational Intelligence Research Group
CBM Condition-Based Maintenance
DoD Department of Defense
DSET Dempster-Shafer Evidence Theory
EDL Entry, Descent and Landing
ESA European Space Agency
FCL Fuzzy Control Language
FIF Fuzzy Information Fusion
FIS Fuzzy Inference Systems
FRA Fuzzy Reasoning Algorithm
GNC Guidance, Navigation and Control
GUI Graphical User Interface
HDA Hazard, Descent and Avoidance
IPSIS Intelligent Planetary Site Selection
ITS Intelligent Transportation Systems
JDL Joint Directors of Laboratories
KF Kalman Filter
NASA National Aeronautics and Space Administration
OODA Observe, Orient, Decide, and Act
OOSM Out-of-Sequence Measurements
PSO Particle Swarm Optimization
1
Introduction
Contents
1.1 Motivation . . . 4
1.2 Objectives and Contributions . . . 4
Human beings have the biological ability to efficiently combine data, having evolved that capability by using multiple senses which interact with the surrounding environment, and to interpret situa-tions, take decisions and thus act, improving its ability to survive. Integrating sensory data from sight, sound, smell, taste and touch, supported bya priori knowledge and a cognitive process,
makes the human brain an excellent example of a sophisticated fusion system (Hall and Llinas, 1997, Johansson, 2003, Nilsson, 2008).
This natural fusion system performed by the human brain is remarkably effective in today’s con-texts. (Ng, 2003) addresses this issue adding "that the ultimate goal is for an intelligent system to be modeled after human intelligence". Yet, the ability to engineer a system that match the func-tions of the brain in processing and controlling all the sensory systems and analyzing the input information is not a simple task.
The proliferation of available data ("Big Data") and new technologies and their subsequent in-tegration into our lives, creates new challenges and drives the process of decision making to become exponentially more complex. In many cases, the increasing amounts of available data, have to be filtered to create useful information to enable more informed, accurate and successful decision (Nilsson, 2008, Fan and Bifet, 2013). (Biermann et al., 2004) makes clear that thor-ough functional analysis of both operational and processing aspects are a necessary prerequisite for understanding the deep and sophisticated nature of information and the different processing levels (see Figure 1.1) required for producing intelligence from data.
Figure 1.1: The Knowledge Pyramid. Taken from (Biermann et al., 2004).
fusion/integration is made by a method/algorithm. The Knowledge Pyramid’s top encompasses the "Intelligence Processing", i.e. the initial measurements which have been transformed into knowledge with associations and correlations between data that can be understood, be put under judgment and predict future behaviors. However, the decision process in complex systems takes, in the majority of cases, a great effort of our cognitive capabilities which may be the main problem of predicting how the system will react to external manipulation, and understand the multiple interactions between system’s variables (Pfister and Bohm, 2008).
An intelligent agent will never get all the relevant information but will be impacted by partial, false, unreliable, irrelevant, redundant pieces of information which he will have to filter (Biermann et al., 2004). The human brain permanently selects and inserts relevant information from its internal, mental understanding and model of the situation as it is perceived so far, and the experience gained from "similar" problems in order to correlate and aggregate it all to a reasonable picture of the situation deciphering the meaning of all pieces of input data (Biermann et al., 2004).
Data fusion with the purpose of improving decision-making requires solutions for matters such, as stated by (Nilsson, 2008), "while information technology can transform a data poor situation into a data rich environment, the fact remains that data needs to be fused and analyzed effectively and efficiently, in order to provide appropriate information for intelligent decision making."
In the 1950s and 1960s, the search for practical methods of merging images from various sen-sors to provide a single composite image, which could be used to better identify natural and man-made objects, gave data fusion a scientific application perspective (Wang et al., 2005). With the emergence of new sensors, advanced processing techniques and improved processing hard-ware, real-time1fusion of data started to be increasingly viable. Just as the advent of symbolic
processing computers (e.g. LISP Machine developed at Massachusetts Institute of Technology (Bawden et al., 1977, Greenblatt et al., 1980)) in the early 1970s, provided an impetus to artificial intelligence (Liggins and Chang, 2009). Its rapid growth,per se, started in the late 1980s with the United States Department of Defense (DoD) conducting much of the early research on this tech-nology and exploring its usefulness in ocean surveillance, air-to-air and surface-to-air defense, and battlefield intelligence (Dailey and Lin, 1996, Steinberg et al., 1999, Macii et al., 2008). Nowadays, several studies and projects are emerging in more diversified areas of application and environment than just the military. Much research and applications are in the Unmanned Vehicles area, including for instance Unmanned Ground Vehicles (e.g. (Blasch et al., 2006)), Unmanned Underwater Vehicles (e.g. (Geder et al., 2009)), Unmanned Surface Vehicles (e.g. (Savitz et al., 2013) and the Portuguese project Ziphius (Azorean, 2014)), Unmanned Aerial Vehi-cles (UAV) (e.g. (Gonçalves-Coelho et al., 2007, de Fátima Bento, 2008, Morgado and de Sousa, 2009, Hormigo and Araújo, 2013) in a Portuguese context) and Unmanned Space Missions (e.g. (Martin et al., 2007, ESA, 2014a) and recently, the Curiosity Mars Rover (NASA, 2014a)). As
in National Aeronautics and Space Administration (NASA) Curiosity Mars Rover case (NASA, 2014a), spacecraft lander missions are the present and the future of space exploration missions (with European Space Agency (ESA) ExoMars Mars Rover launch due to 2016 (ESA, 2014b)). Unmanned Space Missions represent a very specific topic with a strong component of data fusion on matters such as assessment of the landing site, crucial to ensure safe landing missions, par-ticularly for NASA and ESA. With the advent of space missions and exploration of the universe through unmanned spacecrafts, several data fusion frameworks for terrain safety assessment are emerging, being of particular interest for this dissertation those that handle fuzzy reasoning such as (Howard and Seraji, 2004, Serrano et al., 2006, Seraji and Serrano, 2009). Fuzzy reasoning essentially "mimics" the imprecise knowledge of a human expert (Babuska, 2003).
1.1
Motivation
The work in this dissertation falls under FUSION - Sensor Data Fusion Hazard Mapping and Piloting project (CA3, 2013b) where it was necessary to test different data fusion methods and compare their performance and results. In this context, a fuzzy reasoning algorithm was imple-mented as a potential candidate method for data fusion in spacecraft landing site assessment.
Being the analysis of the obtained results a complicated task, it was created a data visualization tool to help both decision makers and engineers to analyze and verify those results.
1.2
Objectives and Contributions
In this dissertation we start with an overview of the data fusion domain and all that it entails, from the different main types of data fusion to the applied algorithms and areas of application.
After, we present an implementation of a fuzzy reasoning algorithm for hazard maps fusion within spacecraft landing site assessment, which was based in the works (Howard and Seraji, 2004, Serrano et al., 2006, Seraji and Serrano, 2009). Then its results and performance were compared with those obtained by the Intelligent Planetary Site Selection (IPSIS) algorithm (CA3, 2013d) for the same input dataset.
1.3 Structure of the Dissertation
1.3
Structure of the Dissertation
This thesis is organized in the following chapters:
1. Introduction
2. State of the Art
3. Hazard Detection and Avoidance
4. Developed Work
5. Results and Discussion
6. Conclusions
In Chapter 1 is described the introduction of the subject, as well as its objectives and contributions and the present explanation of dissertation organization.
In Chapter 2 is presented an overview of the state of the art of data fusion, including the challeng-ing problems regardchalleng-ing its implementation, a description of its branches, architectures, models, algorithms/methods and applications.
Chapter 3 focus in Hazard Detection and Avoidance (HDA) highlighting the project FUSION, for which the tools presented in this dissertation were developed, and a brief explanation of IPSIS algorithm for safe site selection.
Chapter 4 presents the developed tools, applying Takagi-Sugeno inference scheme and all the knowledge inherent of its application in the Fuzzy Reasoning Algorithm (FRA). In this chapter it is also described a data visualization and analysis tool developed in MATLABR, called Oracle
Viewer. The operation of these tools is analyzed in detail.
In Chapter 5 it is compared and scrutinized the obtained results of the FRA and the IPSIS algo-rithm. Thus, it is also taken into account the computational requirements of each algoalgo-rithm.
2
State of the Art
Contents
2.1 What is Data Fusion? . . . 8
2.2 Challenging Problems of Data Fusion . . . 9
2.3 Data Fusion Branches . . . 11
2.4 Fusion System Architectures . . . 16
2.5 Fusion Models . . . 20
2.6 Data Fusion Algorithms and Methods . . . 29
2.7 Supporting Technologies to Data Fusion . . . 36
This chapter contains an overview of the state of the art of data fusion with all that it entails, from its origin and definition, the problems that may result from its implementation and those that it proposes to solve, its branches, architectures, models, algorithms/methods and applications.
2.1
What is Data Fusion?
Data fusion is a wide ranging subject and many definitions are available in the literature. While there is not one commonly referenced definition of data fusion, there is a general consensus of what fusing data means. (Liggins et al., 2008) propose "data fusion techniques combine data from multiple sensors and related information to achieve more specific inferences than could be achieved by using a single, independent sensor." (Mitchell, 2007) suggests that multi-sensor data fusion is "the theory, techniques and tools which are used for combining sensor data, or data derived from sensory data, into a common representational format ... in performing sensor fusion our aim is to improve the quality of the information, so that it is, in some sense, better than would be possible if the data sources were used individually." (Bleiholder and Naumann, 2009) states that "data fusion is the process of fusing multiple records representing the same real-world object into a single, consistent, and clean representation." (Hyder et al., 2002, Ng, 2003, Lee et al., 2010) for instance, give other definitions of data fusion. In the overall, there is a common understanding that data fusion encompasses a wide variety of activities that involve using multiple data sources. In short, data fusion can be defined as any process of aggregating data from multiple sources into a single composite with higher information quality (Ribeiro et al., 2014).
DETECTION KINEMATICS CLASSIFICATION
CONFIDENCE COVERT
COVERAGE RANGE ANGLE CLASS TYPE
FAIR POOR GOOD FAIR FAIR FAIR
FAIR GOOD POOR GOOD FAIR POOR
FAIR GOOD POOR FAIR GOOD GOOD
GOOD GOOD GOOD GOOD GOOD GOOD
2.2 Challenging Problems of Data Fusion
Data fusion uses overlapping information to determine relationships among data (data associa-tion) and synergistic differences in the data to improve the estimate/assessment of a reported environment (state estimation). As such, data fusion can enable improved estimation of situations and, therefore, improved responses to situations, as for instance, the case of a fighter aircraft during flight (see Figure 2.1) (Steinberg et al., 1999).
The results of automated data fusion processes are generally employed to support human decision-making in complicated scenarios by refining and reducing the quantity of information that system operators need to examine to achieve timely, robust, and relevant assessments and projections of the situation (Steinberg et al., 1999, Macii et al., 2008).
2.2
Challenging Problems of Data Fusion
Despite the many recent advances in data fusion, due to the intrinsic imperfections and diversity of sources and contexts, there is still much to be accomplished to obtain a full-proof data fusion method (Ribeiro et al., 2014). (Liggins et al., 2008, Ch. 1) in revision of (Hall and Steinberg, 2000) work stated some important conclusions about the challenges/issues in data fusion such as:
• There isstillno substitute for a good sensor (and a good human to interpret the results);
• Downstream processing still cannot absolve upstream errors (or lack of attention to the data);
• Not only may the fused result be worse than the best sensor result, but failure to address pedigree, information overload, and uncertainty may really fowl up things;
• There arestillno magic algorithms;
• There will never be enough training data;
• Both research and implementation started at "the wrong end", as we have "started at the data side or sensor inputs" to progress toward the human side and not the opposite.
• Data uncertainty: data provided by any type of sensor is always affected by some level of impreciseness and noise in the measurements. Data fusion algorithms should be able to exploit the data redundancy to reduce such effects and help improve accuracy;
• Outliers and spurious data: data uncertainties from sensors are an unavoidable
conse-quence of their use and can also be caused by ambiguities and inconsistencies present in the environment, and from the inability to distinguish between them. Detecting these data discrepancies is an important task since outliers can change the results of a data analysis;
• Conflicting data: different sources may lead to conflicts because of incomplete, erroneous and out-of-date data (Dong and Naumann, 2009). To avoid producing counter-intuitive re-sults, highly conflicting data must be treated with upmost care;
• Data modality: sensor networks may collect the homogeneous or heterogeneous data
mea-surements of a phenomenon. Both cases must be handled by a data fusion system;
• Data alignment/registration: integration of a sensor’s data transformation common frame, in-stead of sensor’s local frames, is essential to align data into a common spatial and temporal reference before fusion occurs. Alignment problems are often referred to as sensor regis-tration and deals with the calibration error induced by individual sensor nodes. In practice, data registration is of critical importance to the successful deployment of fusion systems. Several methods of sensor registration are discussed in (Liggins et al., 2008, Ch. 6);
• Data correlation: this issue is particularly important and common in distributed fusion set-tings, e.g. wireless sensor networks, as for example some sensor nodes are likely to be exposed to the same external noise biasing their measurements. (Board, 1996) considers that sensor measurements should be compared with correlation metrics to score each alter-native assignment hypothesis. If such data dependencies are not accounted for, the fusion algorithm may suffer from over/under confidence in results;
• Data association: new problems arise from the major complexity introduced by using
multi-target tracking instead of single-multi-target tracking. The difficulties may come in two forms: measurement-to-track and track-to-track association. The former refers to the problem of identifying from which target, if any, each measurement is originated, while the latter deals with distinguishing and combining tracks, which are estimating the state of the same real-world target. A different technique of data association is proposed by (Liggins et al., 2008, Ch. 13);
• Processing framework: data fusion processing can be performed by various fusion system’s
2.3 Data Fusion Branches
• Operational timing: in a system comprising of several sensors with specific aspects associ-ated, may occur different rates of data transfer in different operation frequencies, as in the case of homogeneous sensors. It is fundamental that a data fusion method can process data in parallel and incorporate multiple time scales in order to deal with such timing vari-ations in data. In distributed fusion architectures (see Section 2.4.3), different parts of the data may traverse different routes before reaching the central fusion node, which may cause out-of-sequence arrival of data. Is then fundamental to prevent this issue to avoid potential performance degradation, which occurs especially in real-time applications;
• Static vs. dynamic phenomena: the phenomenon under analysis may be static (invariant) or dynamic (variant) in terms of time variance. In the latter case, it may be necessary for the data fusion algorithm to incorporate a historical database of recent measurements into the fusion process. Also the frequency of variations must be considered in design or selection of the appropriate fusion approach;
• Data dimensionality: the measurement data could be preprocessed, either locally at each of
the sensor nodes (as in Section 2.4.2) or globally at the fusion node (as in Section 2.4.1) to be compressed into lower dimensional data, assuming a certain level of compression loss is allowed. This preprocessing stage is beneficial as it enables saving on the communication bandwidth and power required for transmitting data;
• Cost effectiveness: to build a single sensor that can perform multiple functions is often more expensive than to integrate several simple and less expensive sensors with specific functions. Phenomenon observation requirements should be properly analyzed to conclude which is the best option.
Many problems of fusing data have been identified and solutions have been studied, but as stated previously, there is no magic algorithm capable of addressing all the aforementioned challenges (Bachmann, 2011). Some of the listed issues are addressed with further detail in Section 2.6.1.
2.3
Data Fusion Branches
As theory and applications have evolved over the years, it is important to state that similar un-derlying problems of data integration and combination occur in a very wide range of engineering, analysis and cognitive situations (Steinberg et al., 1999).
radar, infrared sonar, and visual information. Data fusion technology has rapidly advanced from a loose collection of related techniques to an emerging true engineering discipline with standard-ized terminology, collections of robust mathematical techniques, and established system design principles (Dailey and Lin, 1996) (Liggins et al., 2008, Ch. 1).
Data fusion can be viewed from different perspectives by different domains, being the most com-mon branches: image fusion, multi-sensor fusion and information fusion. The comcom-mon denomi-nator for all three domains is that the different sources must address/represent the same subject (e.g. scene, action, local, event, etc.) and that they share available techniques from statistical, probabilistic or computational intelligence methods (Ribeiro et al., 2014).
2.3.1
Image Fusion
2.3 Data Fusion Branches
2.3.2
Multi-Sensor Fusion
Multi-sensor fusion is the process of fusing data provided by sensors and consequently, its ob-jective is to integrate data measurements extracted from different sensors combining them into one representation (Ribeiro et al., 2014). In principle, fusion of multi-sensor data provides signifi-cant advantages over single source data. Along with statistical advantages gained by combining same-source data (e.g. improved estimate of a physical phenomena via redundant observations), using a set of multiple types of sensors may increase the accuracy with which a measurement can be observed and characterized (Hall and Llinas, 1997).
According to (Mitchell, 2007), performance improvements on multi-sensor data fusion are sum-marized in four different ways: a greater granularity in the representation of information, greater certainty in data and results, elimination of noise and errors producing greater accuracy, and more complete view on the environment. Nevertheless, often the performance of a multi-sensor sys-tem can be worse than one with individual sensors, a situation identified as Catastrophic Fusion (Mitchell, 2007). This can be caused by a set of sensors being designed to operate correctly only under certain conditions (Mitchell, 2007).
Most approaches of multi-sensor data fusion use statistical1 methods (Kalman filters) and
prob-abilistic2 techniques (Bayes theory) (Ribeiro et al., 2014). Other strategies include the use of
hybrid methods to combine different multi-sensor fusion techniques, taking the advantages of the individual approaches and mitigating their flaws (Ribeiro et al., 2014).
FLIR Combined Radar absolute uncertainty region Absolute uncertainty region intersection FLIR absolute uncertainty region Target report Target report Elevation uncertainty Elevation uncertainty Slant range uncertainty Slant range uncertainty Target report LOS Target report LOS Radar Azimuth uncertainty Azimuth uncertainty
Figure 2.2: Pulsed radar and a Forward-Looking InfraRed (FLIR) imaging sensor with data corre-lation. Taken from (Liggins et al., 2008, Ch. 1).
Figure 2.2 presents a combined observation system with a pulsed radar and a FLIR. Considering the object under observation a moving object, such as an aircraft, the radar provides the ability to accurately determine the aircraft’s range but has a limited ability to determine the angular direc-tion of the aircraft. On the other hand, the FLIR can accurately determine the aircraft’s angular
direction, but is unable to measure range (Hall and Llinas, 1997). If these two observations are correctly associated (as in "Combined"), then the combination of the two sensors data provides an improved determination of location than could be obtained by either of the two independent sen-sors. This results in a reduced error region as shown in the fused or combined location estimate. A similar effect may be obtained in determining the identity of an object based on observations of an object’s attributes. For example, there is evidence that bats identify their prey by a combination of factors that include size, texture (based on acoustic signature), and kinematic behavior (Hall and Llinas, 1997).
2.3.3
Information Fusion
Information fusion is a multi-level process of combining different data to produce fused informa-tion (Ribeiro et al., 2014). (Nilsson and Ziemke, 2007) made a reference about how Dasarathy (Dasarathy, 2001) viewed information fusion. To Dasarathy, information fusion refers to " ... ex-ploiting the synergy in the information acquired from multiple sources (sensor, databases, infor-mation gathered by humans, etc.) such that the resulting decision or action is in some sense better ... than would be possible if any of these sources were used individually without synergy exploitation" (Nilsson and Ziemke, 2007). Essentially, in information fusion the preprocessed out-puts of each single source are combined to create a new interpretation (Ribeiro et al., 2014) in such a way that a better decision could be performed (Nilsson and Ziemke, 2007). Usually, in the realm of artificial intelligence, information fusion has two main goals: to support decision-making and to improve the understanding of an application domain (Ribeiro et al., 2014). As a matter of fact, the traditional research focus within information fusion has been the "process of combining large amounts of information in a more comprehensive and easily manageable form" (Nilsson and Ziemke, 2007). In general, information fusion is used in systems to reduce some type of noise, increase accuracy, summarize information, extract useful information, support decision-making and so forth (Ribeiro et al., 2014). Thus, information fusion should comply with important critical success factors such as the ones pointed in Section 2.2. The most traditional and well-known frameworks for information fusion are based on statistical methods (e.g. Kalman filters, optimal theory, distance methods) and probabilistic techniques (e.g. Bayes theory, and Dempster-Shafer Evidence Theory (DSET)).
2.3 Data Fusion Branches
2.3.4
Low-Level Fusion versus High-Level Fusion
The distinction between low and high-level fusion processing can be made equivalently, in this context, between multi-sensor fusion and information fusion (Bellenger, 2013). Multi-sensor fusion typically applies to levels 0 and 1 of the JDL model (depicted in Section 2.5.1), whereas the term information fusion is often used to refer to levels 2, 3 and related parts of level 4 (Bellenger, 2013). The main conceptual differences have been summarized by (Waltz and Llinas, 1990), and graphically represented by (Blasch et al., 2010) in Figure 2.3.
Low-Level Processing
High-Level Processing
Assessment
•Detection of Pattern of Behavior •Association of Entities and Events •Prediction of Future Behavior •Classification of Situation Sensor 1 •Detection Sensor 2 •Detection Sensor 3 •Detection Data Association State Estimation Attribute Classification Estimated Tracks High-level Assessment On Situation Predicted States of
Targets in Track
Target Identities
Low-Level Assessment
•Behavior •Future Activities •Intent
State Estimates
Figure 2.3: Low-level processing versus high-level processing. Adapted from (Blasch et al., 2010).
As described in Section 2.3.2, multi-sensor fusion involves objects having properties, which are usually measurable. As a matter of fact, its goal is largely to infer and predict physical, kinematic properties of physical entities (see Figure 2.1) which makes that mathematical models and algo-rithms used in this purpose to be closely tied to physics and constrained by the laws of physics (Bellenger, 2013). Over the last years, these numerically based low-level algorithms have been subject of several researches from the scientific community.
On the other hand, while low-level processes support target classification, identification, and track-ing, high-level processes support situation, impact, and fusion process refinement, as stated by (Blasch et al., 2010, Bellenger, 2013). Therefore, high-level fusion processes involve several ele-ments and interactions among a wide variety of situation components. According to (Blasch et al., 2010, Bellenger, 2013), high-level processes have the following properties:
• They focus on symbolic reasoning rather than numeric reasoning;
• Reasoning within the context, where data are analyzed with respect to the evolving situation;
• Multiple types of dynamic and static domain knowledge to be processed;
• Numerous constituency-dependency relationships among objects as well as events and
ac-tivities of interest.
Comparing the two levels of data fusion, information fusion "takes the world to be a world of facts, where facts involve the application of relations between objects". In a more comprehensive man-ner, higher-levels rely on the realm of cognitive, social and organizational phenomena, which can be combined with the physical notions used by multi-sensor fusion (Bellenger, 2013).
2.4
Fusion System Architectures
Developing a data fusion system is a complex task. For instance, designing a multi-sensor data fu-sion must consider the possibility of different types of sensors working simultaneously with distinct output formats and periodicity. Such heterogeneous scenario with different levels of integration must have a well-defined communication protocol between the components of the system for proper data flow, in order to create a robust fusion architecture (Veloso et al., 2009). As stated by (Bedworth and O’Brien, 2000), an architecture includes the arrangement of the component parts, their connectivity, and the data flows between them. In most cases, multi-sensor data fusion sys-tems presents a 3 (or even 4) layer architecture: a level to deal with physical issues; a level to fuse data; and a level to present data to final user (Veloso et al., 2009).
(Esteban et al., 2005) conducted a study which presented a synthesis of architectural issues that must be taken into account to develop a multi-sensor data fusion platform. The key issues, organized by (Veloso et al., 2009), encompasses how to process the sensors distribution to form a network (in parallel or serial bus, or even a combination of both); the level of data representation needed in which data can be enriched with different levels of fusion; the possibility of including a feedback mechanism in the system which allows the control of recommendations provided by different levels; how to deal with difficulties and unforeseen situations in data fusion such as sensor failures, corrupted data and even incompatibility with different sensors; and last but not the least, the type of architecture for data fusion to be used (Ng, 2003, Castanedo, 2013). Based on the design criteria, the following types of architectures could be identified:
• Centralized architecture;
• Decentralized architecture;
• Distributed architecture;
2.4 Fusion System Architectures
The aforementioned architectures are described in detail in the following subsections.
2.4.1
Centralized Fusion Architecture
In a centralized fusion architecture, all fusion processes are executed in a central processor that receives the information (raw data) from the different input sources (Ng, 2003), as shown in Figure 2.4.
Preprocessing
Preprocessing
Preprocessing
Alignment Association Estimation
State of the object Centralized architecture S1 S2 Sn
Figure 2.4: Centralized architecture. Taken from (Castanedo, 2013).
In this schema, the sources S obtain only the observations measurements, preprocess those
measurements and then transmit them to the central processor where the data fusion process is performed. Issues as data alignment and data association together with time delays, for informa-tion transferring between sources and large amount of bandwidth, are some disadvantages that can compromise the results in the centralized scheme (Castanedo, 2013).
2.4.2
Decentralized Fusion Architecture
A decentralized fusion architecture is composed of a network of nodes where each node has its own processing capabilities and there is no single central point of data fusion (Ng, 2003, Cas-tanedo, 2013). Figure 2.5 shows this particular architecture.
Decentralized architecture Preprocessing State of the object State of the object S1 S2 Preprocessing Preprocessing Alignment Alignment Alignment Association Association Association Estimation Estimation Estimation Sn State of the object
Therefore, data fusion is performed autonomously where each node fuses its local information with the information that is received from its peers (Castanedo, 2013). The main disadvantage of this architecture consists in the communication cost which may cause scalability problems when the number of nodes is increased, with no common communication facility (Liggins et al., 2008, Ch. 14) (Ng, 2003, Castanedo, 2013). Another feature of this architecture is that nodes have no global knowledge of the network topology (Ng, 2003).
2.4.3
Distributed Fusion Architecture
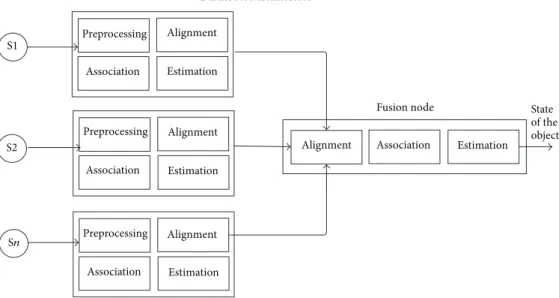
In a distributed fusion architecture, measurements from each source node are processed inde-pendently before the information is sent to the fusion node (Ng, 2003). The fusion node accounts for the information that is received from other nodes, i.e. the data association and state estimation are performed in the source node before the information is communicated to the fusion node (Ng, 2003, Castanedo, 2013), as depicted in Figure 2.6.
Distributed architecture
Fusion node State
of the object S1 S2 Preprocessing Preprocessing Preprocessing Alignment Alignment Alignment Alignment Association Association Association Association Estimation Estimation Estimation Estimation Sn
Figure 2.6: Distributed architecture. Taken from (Castanedo, 2013).
Summarizing, as in (Castanedo, 2013) "each node provides an estimation of the object state based on only their local views and this information is the input to the fusion process, which pro-vides a fused global view." Works such as (Liggins et al., 2008, Ch. 8) and (Liggins et al., 2008, Ch. 17) analyze in greater detail the subject of distributed architectures.
2.4.4
Hierarchical Fusion Architecture
pre-2.4 Fusion System Architectures
processed at local fusion processing nodes (centralized architecture), and its track results and track estimates are sent in turn to global fusion nodes to generate a common track estimate. The benefits of a hierarchical fusion are identified in (Liggins et al., 2008, Ch. 17) as "the diversity between local nodes and different sets of sensors to view the target, maintaining local storage of assigned sensor reports and track histories at the originating node, while transmitting refined track estimates." Other beneficial characteristic of these architectures, is the use of feedback, which can be used to redistributing the reduced error uncertainty estimates from the global fusion node to the local fusion nodes as in Figure 2.7. Communication problems, such as those identi-fied in Section 2.4.2, may be compensated with these type of architecture in terms of bandwitch for more quantity and quality of data flow (Liggins et al., 2008, Ch. 17).
F1 F2
F3
F1 F2
F3
S1 S2 S3 S4 S1 S2 S3 S4
Hierarchical fusion without feedback
Hierarchical fusion with feedback
Figure 2.7: Hierachical fusion architecture without and with feedback. Adapted from (Liggins et al., 2008, Ch. 17).
In Figure 2.7,Siwithi= 1, 2, 3, 4, represent the set of sensors whileF1andF2are local fusion
centers responsible for preprocessing, andF3is the global fusion center.
2.4.5
Difference Between Decentralized and Distributed Architecture
In most of the literature, the decentralized and distributed fusions are often used interchangeably, however there is a slight difference between the two terms (Ng, 2003). (Ng, 2003) essentially sets the difference in the absence of a central facility in decentralized fusion case while in the distributed case there still exists the notion of central processing. The difference between both fusion architectures can be analyzed comparing Figure 2.5 with Figure 2.6.
2.5
Fusion Models
(Bedworth and O’Brien, 2000) define a process model to be a description of a set of processes, and several models have been developed to deal with data fusion issues (Veloso et al., 2009). Considering multi-sensor data fusion cases, usually there is a module to deal with the sensors and their output (input module), other to make some preprocessing or full processing of the data and a module to output the data processed on the environment. The so called adjustments/calibrations of the sensors and system itself are normally done in a closed loop interface, common in these cases (Veloso et al., 2009).
2.5.1
JDL Model
Developed in 1985 by the United States Joint Directors of Laboratories (JDL) Data Fusion Group (Steinberg et al., 1999), the JDL data fusion model would become the most common and popu-lar conceptualization model of fusion systems. The group was intended to assist in coordinating DoD activities in data fusion, and improve communication and cooperation between development groups with the purpose of unifying research (Macii et al., 2008, Khaleghi et al., 2013, Hall and Steinberg, 2000). The result of that effort was the creation of a number of activities (Steinberg et al., 1999, White, 1991, Hall and Steinberg, 2000, Hall and Garga, 1999) such as: (1) devel-opment of a process model for data fusion (see Figure 2.8); (2) creation of a lexicon for data fusion; (3) development of engineering guidelines for building data fusion systems; (4) organiza-tion and sponsorship of the Tri-Service Data Fusion Conference from 1987 to 1992. The JDL Data Fusion Group has continued to support community efforts in data fusion, leading to the annual National Symposium on Sensor Data Fusion and the initiation of a Fusion Information Analysis Center. In the initial JDL data fusion lexicon (dated 1985), the group defined data fusion as "a process dealing with the association, correlation, and combination of data and information from single and multiple sources to achieve refined position and identity estimates, and complete and timely assessments of situations and threats, and their significance. The process is characterized by continuous refinements of its estimates and assessments, and the evaluation of the need for additional sources, or modification of the process itself, to achieve improved results." (Steinberg et al., 1999).
According to this model (see Figure 2.8), the sources of information, Source Preprocessing, used for data fusion can include both local and distributed sensors (those physically linked to other platforms), or environmental data,a priori data, and human guidance or inferences (Macii et al.,
2.5 Fusion Models
DATA FUSION DOMAIN
Sources
Human/ Computer
Interface
Database Management System
Support Database Fusion Database
Source Preprocessing Level 1 Object Refinement Level 2 Situation Refinement Level 3 Threat Refinement Level 4 Process Refinement
Figure 2.8: The JDL data fusion model. Adapted from (Steinberg et al., 1999).
Hall and Garga, 1999, Hall and Steinberg, 2000) and (Liggins et al., 2008, Ch. 1) as follows:
• Source Preprocessing: estimation and prediction of signal/object observable states on the
basis of pixel/signal level data association and characterization;
• Level 1 processing (Object Refinement): estimation and prediction of entity states on the
basis of observation-to-track association, continuous state estimation (e.g. kinematics) and discrete state estimation (e.g. object identity);
• Level 2 processing (Situation Refinement): estimation and prediction of relations among entities and events in the context of their environment (e.g. communications and perceptual influences);
• Level 3 processing (Threat Refinement): estimation and prediction of effects on situations of planned or estimated/predicted actions by the participants, to include interactions between action plans of multiple players (e.g. inferences about enemy threats, friendly and enemy vulnerabilities, and opportunities for operations);
• Level 4 processing (Process Refinement): adaptive data acquisition and processing to sup-port mission objectives (e.g. to improve accuracy of inferences, utilization of communication and computer resources).
In order to manage the entire data fusion process through control input commands of information requests, the system also must include a Human-Computer Interaction, an interface to allow a human to interact with the fusion system, as well as a Data Management unit, a lightweight database, providing access to, and management of, dynamic data fusion data (Hall and Steinberg, 2000, Macii et al., 2008).
functionality within a system" (Steinberg et al., 1999), do level 1 fusion first, then levels 2, 3 and 4. The original JDL titles for these levels appear to be focused on tactical targeting applications (e.g. threat refinement), so that the extension of these concepts to other applications is not obvious (Steinberg et al., 1999). Therefore, despite its popularity, the JDL model has many shortcomings, such as being too restrictive and especially tuned to military applications, which have been the subject of several extension proposals (Hall and Llinas, 1997, Steinberg et al., 1999, Llinas et al., 2004, Steinberg and Bowman, 2004) attempting to alleviate them. Resuming, the JDL formaliza-tion is focused on data (input/output) rather than processing (Khaleghi et al., 2013).
2.5.2
Waterfall Model
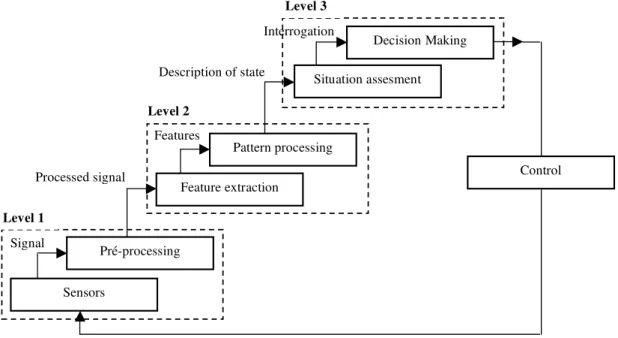
As mentioned in (Veloso et al., 2009), the Waterfall model is a hierarchical architecture where the information outputted by one module will be inputted to the next module, as depicted on Figure 2.9. The model emphasizes on the processing functions on the lower levels.
Interrogation
Description of state
Signal
Features
Situation assesment Decision Making
Pattern processing
Feature extraction
Pré-processing
Sensors
Control
Level 1
Level 2
Level 3
Processed signal
Figure 2.9: The Waterfall data fusion process model. Taken from (Veloso et al., 2009).
up-2.5 Fusion Models
dated with feedback information arriving from the decision-making module, as depicted in Figure 2.9. The main aspects of the feedback element are the re-calibration, re-configuration and data gathering aspects alerts to the multi-sensor system (Esteban et al., 2005).
The Waterfall model does not clearly state that the sources should be parallel or serial (though processing is serial), assumes centralized control, and allows for several levels of representation (Zegras et al., 2008). This model has been widely used in the UK defense data fusion community but has not been significantly adopted elsewhere (Bedworth and O’Brien, 2000).
2.5.3
Luo and Kay Model
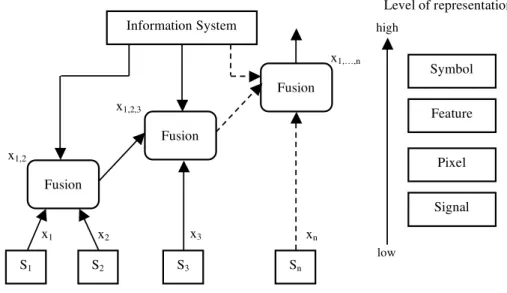
(Luo and Kay, 1988) presented a generic data fusion structure based in a hierarchical model, yet different from the Waterfall model. In this system, data from the sensors are incrementally added on different fusion centers in a hierarchical manner, thus increasing the level of representation from the raw data or signal level to more abstract symbolic representations at the symbol level (Esteban et al., 2005, Zegras et al., 2008, Veloso et al., 2009). This model has a parallel input and processing of data sources interface, which may enter the system at different stages and levels of representation, as depicted in Figure 2.10. The model is based on decentralized architecture (see Section 2.4.2) and does not assume a feedback control (Veloso et al., 2009).
Figure 8, Luo and Kay model.
Source: (Luo & Kay, 1998). x1 x2
Information System
S1 S2 S3 Sn
x3 xn
Symbol Feature Pixel Signal Fusion Fusion Fusion x1,2 x1,2,3 x1,…,n low high
Level of representation
n
Figure 2.10: Luo and Kay data fusion process model. Taken from (Veloso et al., 2009).
In Figure 2.10, as the information is combined gradually at the different fusion centers, the level of representation increases from signal level (responsible for the raw data) to more abstract symbolic representations of the data at the symbol level (Esteban et al., 2005, Veloso et al., 2009).
Table 2.1 depicts in detail a comparison of the different fusion levels classified by representation, type and model of information (Esteban et al., 2005).
Table 2.1: Characteristics of Luo and Kay Model data fusion levels. Adapted from (Esteban et al., 2005).
Characteristics Representation level Type of sensory Model of sensory of information information information
Signal level Low Multi-dimensional Random variable
signal with noise
Pixel level Low Multiple images Random process across the pixel
Feature level Medium Features extracted Non-invariant from signals/images form of features
Symbol level High Decision logic Symbol with degree from signals/images of uncertainty
2.5.4
Thomopoulos Model
In (Esteban et al., 2005, Veloso et al., 2009) works is mentioned that Thomopoulos proposed a three level model, formed by signal level fusion (where data correlation takes place); evidence level fusion (where data is combined at different levels of inference); and dynamics level fusion (where the fusion of data is done with the aid of an existing mathematical model). Depending upon the application, these levels of fusion can be implemented in a sequential manner or inter-changeably (Esteban et al., 2005). Figure 2.11 depicts the Thomopoulos Model.
Source: (Esteban et al, 2005). Signal Level
Evidence Level Sensor
Dynamics Level
Database
Figure 2.11: Thomopoulos data fusion process model. Taken from (Veloso et al., 2009).
2.5 Fusion Models
2.5.5
Intelligence Cycle
The intelligence cycle is an approach which falls in a fusion model subgroup with cyclic character (Elmenreich, 2007), being the Boyd control loop (see Section 2.5.6) an integral part.
Intelligence processing involves both information processing and information fusion as observed in (Bedworth and O’Brien, 2000). Although the information is often at a high level (as approached in Section 2.3.4), the processes for handling intelligence products are broadly applicable to data fusion in general (Bedworth and O’Brien, 2000).
Collection
Collation
Evaluation Dissemination
Figure 2.12: The UK intelligence cycle. Adapted from (Bedworth and O’Brien, 2000).
The cycle is depicted in Figure 2.12, and according to (Elmenreich, 2007, Bedworth and O’Brien, 2000) comprises four stages:
• Collection: gathering of appropriate raw intelligence data (intelligence report at a high level of abstraction), e.g. through sensors;
• Collation: associated intelligent reports are correlated and brought together;
• Evaluation: the collated intelligence reports are fused and analyzed;
• Dissemination: the fused intelligence is distributed to the users.
2.5.6
Boyd Control Loop Model
In 1987, John Boyd proposed a cycle containing four stages that was first used for modeling the military command process (Bedworth and O’Brien, 2000, Elmenreich, 2007). The Boyd control loop or OODA loop (depicted in Figure 2.13) represents the classic decision-support mechanism in military information operations (Elmenreich, 2007). Since decision-support systems for situa-tional awareness are tightly couple with fusion systems, the Boyd model has also been used for sensor fusion (Bedworth and O’Brien, 2000).
Boyd
Control
Loop
Decide
Act
Observe
Orient
Figure 2.13: The Boyd (or OODA) control loop data fusion process model. Adapted from (Bed-worth and O’Brien, 2000).
The Boyd model have some similarities between the Intelligence Cycle and JDL models, which (Bedworth and O’Brien, 2000, Elmenreich, 2007) compared the stages of those models:
• Observe: broadly comparable to the JDL source preprocessing level and part of the collec-tion stage of the intelligence cycle;
• Orient: corresponds to the levels 1, 2 and 3 of the JDL model and includes the structured
elements of collection and the collation stages of the intelligence cycle;
• Decide: comparable to level 4 of the JDL model (Process Refinement) and to the
dissemi-nation stage activities of the intelligence cycle;
• Act: has no similar in the JDL model and is the only model that explicitly closes the loop by taking account of the effect of decisions in the real world.
2.5 Fusion Models
2.5.7
Dasarathy Model
The Dasarathy fusion model is categorized in terms of the types of data/information that are processed and the types that result from the process (Liggins et al., 2008, Ch. 3). Its data flow is characterized by Input/Output (I/O) and processes (Khaleghi et al., 2013), and three main levels of abstraction during the data fusion process are identified (Bedworth and O’Brien, 2000) as:
• Decisions: symbols or belief values;
• Features: or intermediate-level information;
• Data: or more specifically sensor data.
Dasarathy states that fusion may occur both within these levels and as a means of transforming between them (Bedworth and O’Brien, 2000). In the Dasarathy fusion model there are five pos-sible categories of fusion, illustrated in Table 2.2 as types of I/O considered (Liggins et al., 2008, Ch. 3).
Table 2.2: The five levels of fusion in the Dasarathy model. Taken from (Bedworth and O’Brien, 2000).
Input Output Notation Analogues
Data Data DAI-DAO Data-level fusion
Data Features DAI-FEO Feature selection and feature extraction Features Features FEI-FEO Feature-level fusion
Features Decisions FEI-DEO Pattern recognition and pattern processing Decisions Decisions DEI-DEO Decision-level fusion
The processes are described by Dasarathy using the notations DAI-DAO, DAI-FEO, FEI-FEO,
FEI-DEO, andDEI-DEO(Bedworth and O’Brien, 2000)(Liggins et al., 2008, Ch. 3).
2.5.8
Omnibus Model
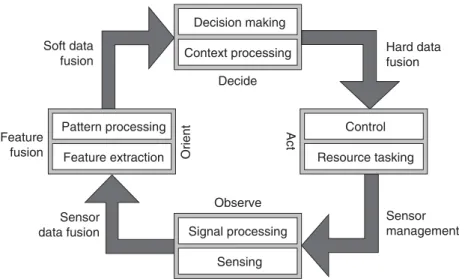
model is then easily incorporated into each of the four main process tasks of the Omnibus model (Bedworth and O’Brien, 2000).
Decision making Context processing Signal processing Sensing Pattern processing Feature extraction Control Resource tasking Orient Observe Decide Act Sensor management Sensor data fusion Hard data fusion Soft data fusion Feature fusion
Figure 2.14: The Omnibus model - a unified data fusion process model. Taken from (Liggins et al., 2008, Ch. 22).
The fusion processes are explicitly located, and has the advantage to be used multiple times in the same application recursively at two different levels of abstraction (Bedworth and O’Brien, 2000). Firstly, the model is used to characterize and structure the overall system to provide an ordered list of tasks. Secondly, the same previously subdivided structures are used to organize the functional objectives of each subtasks of the system (Bedworth and O’Brien, 2000, Elmenreich, 2007). (Bedworth and O’Brien, 2000) adds that "using this approach, a data fusion solution is categorized using a dual perspective - both by its system aim and its task objective."
Although the hierarchical separation of the sensor fusion tasks it is a great advantage of the Om-nibus model, it does not support a horizontal partitioning into modules that can be separately implemented, with distributed sensing and data processing (Elmenreich, 2007).
2.5.9
Distributed Blackboard Model
(Schoess and Castore, 1988) describe an example of a distributed blackboard data fusion model based on the confidence of the values produced by each sensor (sensors that measure the same phenomenon). An example of this model is shown in Figure 2.15 where two sensors (S1andS2)
are connected to a number of transducers (T) (Esteban et al., 2005).
transduc-2.6 Data Fusion Algorithms and Methods
uted blackboard model.
IF ((S1,T1)>(S2,T2)(C1,C2)) THEN F = (S1,T1)
ELSE F = (S2,T2)
S1
T1 ... Tn
S2
T1 ... Tn
Sensor Supervisor 1 Sensor Supervisor 2
Shared Memory
Figure 2.15: Distributed blackboard data fusion process model. Taken from (Veloso et al., 2009).
ers are used to acquire as much information as possible from the physical system under analysis (e.g. temperature, pressure, etc.) (Esteban et al., 2005, Veloso et al., 2009). The fusion algorithm produces a final value,F, which depends of the data gathered by the two sensors (Esteban et al.,
2005).
2.6
Data Fusion Algorithms and Methods
An algorithm can be defined as an effective method for solving a problem with a finite sequence of steps and must be precise, unambiguous and give the right solution in all cases. It is used for calculation, data processing, and in a wide range of applications in many fields (see Section 2.8). The necessity of developing efficient algorithms has become a key technological challenge for all kinds of ambitious and innovative data fusion applications, regardless of the fusion architecture (Sidek and Quadri, 2012).
The load on CPU, memory allocation and storage, interprocess communication and finally com-putation time, are all dependent on algorithmic complexity. Therefore, an algorithm should use simpler communication interfaces and abstraction to enhance the throughput and reduce the de-lay, and should allow real-time operation without complex global state maintenance (Sidek and Quadri, 2012).
Besides all these performance related characteristics, a data fusion algorithm must cope with the inherent "anomalies" of input data, its processing, and fuse data to produce coherent and precise outputs.
2.6.1
Fusion Algorithm Taxonomy
fusion algorithms can be roughly categorized based on one of four challenging problems of input data: data imperfection, data correlation, data inconsistency, and disparateness of data form.
Figure 2.16: Taxonomy of data fusion methodologies. Taken from (Khaleghi et al., 2013).
As discussed in Section 2.2, real-world fusion applications have to deal with several data related challenges and the taxonomy proposed by (Khaleghi et al., 2013) (see Figure 2.16) illustrates an overview of data-related challenges that are typically tackled by data fusion algorithms. The input data to the fusion system may be imperfect, correlated, inconsistent, and/or in disparate forms/modalities and each of these four main categories of challenging problems can be further subcategorized into more specific problems. However, it is important to emphasize that no single data fusion algorithm is capable of addressing all the aforementioned challenges (Khaleghi et al., 2009).
2.6.1.1 Fusion of Imperfect Data