Celso StephanI
Carlos Alberto HennII,III Maria Rita DonalisioI
I Departamento de Medicina Preventiva e Social. Faculdade de Ciências Médicas. Universidade Estadual de Campinas. Campinas, SP, Brasil
II Serviço de Atendimento e Internação Domiciliar. Secretaria Municipal de Saúde de Campinas. Campinas, SP, Brasil
III Programa de Pós-Graduação em Saúde Coletiva. Faculdade de Ciências Médicas. Universidade Estadual de Campinas. Campinas, SP, Brasil
Correspondence: Maria Rita Donalisio
R. Tessalia Vieira de Camargo, 126 – Cidade Universitária
13083-887 Campinas, SP, Brasil E-mail: [email protected] Received: 6/15/2009
Approved: 4/12/2010
Article available from: www.scielo.br/rsp
Geographic expression of
AIDS epidemic in Campinas,
Southeastern Brazil, between
1980 and 2005
ABSTRACT
OBJECTIVE: To analyze the spatial distribution of reported AIDS cases in adults and its association with living conditions in the city of Campinas, Southeastern Brazil.
METHODS: Data on AIDS cases in men (n=2,945) and women (n=1,230) aged more than 13 years and living in Campinas, recorded in the SINAN (Brazilian Information System for Notifi able Diseases), were used to map the spatial distribution of this disease and the male:female ratio. Maps were constructed for the following periods: from 1980 to 1995, from 1996 to 2000, and from 2001 to 2005. The variables included in the analysis were address, sex and age. A weighted composite index was used to study living and health conditions in the area. Patients’ home addresses were geocoded on a cartographic base, after correction and standardization according to a reference database of streets. A generalized additive model was adjusted to analyze the spatial distribution of the ratio of male:female cases in space, in the three study periods.
RESULTS: The ratio of male:female cases was higher in areas with better living conditions (central) and around the prison (northwestern), where families of prisoners and former prisoners live temporarily, while this ratio was lower in the city suburbs (southwestern).
CONCLUSIONS: The trends towards the AIDS epidemic affecting more women and poorer individuals were confi rmed by the decrease in the ratio of male:female cases in the period, particularly in vulnerable and impoverished populations. Geographic information systems and spatial data analysis can be useful for AIDS control and surveillance actions.
DESCRIPTORS: Acquired Immunodefi ciency Syndromepidemiology. Information Systems. Disease Notifi cation. Geographic Information Systems. Socioeconomic Factors.
INTRODUCTION
The fi rst cases of AIDS in Brazil were diagnosed in the cities of São Paulo and
Rio de Janeiro, in the Southeastern region, in the early 1980s.4 Considering the
natural history of this disease, it is believed that the HIV was introduced in Brazil in the 1970s, spreading throughout the country in an insidious and progressive
way, in the following decades, with different dissemination patterns.5,7 In 1985,
a Secretaria Municipal de Saúde. Coordenadoria de Vigilância e Saúde Ambiental. Índice de Condição de Vida. Campinas; 2001[cited 2009 Jan 10]. Available from: http://tabnet.saude.campinas.sp.gov.br/mapas/ICV.pdf
0 10 20 30 40 50 60
1980 1985 1990 1995 2000 2005
Incidence Coefficient per 100,000 inhabitants in males/females 0
1 2 3 4 5 6 7 8 9 10 11 12
Ratio Male/female
Coef Inc male Coef Inc female Ratio M/F
Source: Information System for Notifi able Diseases (Sinan), Campinas
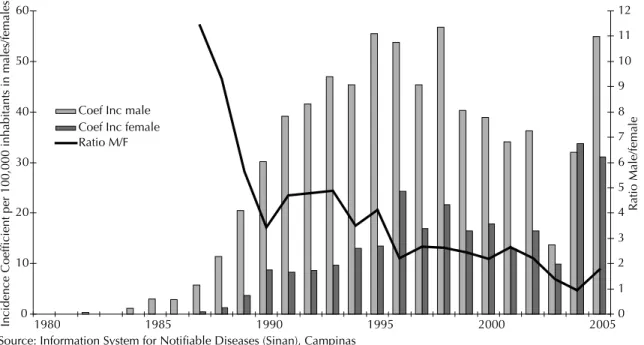
Figure 1. AIDS incidence rate per 100,000 inhabitants, according to sex. City of Campinas, Southeastern Brazil, 1980-2005.
In the onset of the HIV/AIDS epidemic, this disease was predominant in men who had sexual intercourse with other men, bisexual males, white, with a high level of education and who lived in large cities of the
Southeastern region of Brazil.11,12
After the fi rst decades, the epidemiological profi le of the disease changed, with a trend of HIV/AIDS dissemina-tion in heterosexual men, women and children of all social classes, particularly affecting marginalized and
vulnerable populations.6,9,10,13 In a few years, it became
one of the main causes of mortality in adults.7,13 The
male:female ratio of AIDS cases was 26.7:1 in 1985,
decreasing to 1.5:1 in 2008.4,11
The spatial dissemination of AIDS has been investi-gated, using geoprocessing and spatial data analysis, increasing the understanding of the dynamics of this epidemic in Brazil and enabling public health to have tools traditionally used in geography and
cartography.2,5,14 Health services have also incorporated
statistical analyses, computer programs and geographic information systems (GIS), particularly in programs of epidemiological surveillance of diseases. In this way, space began to be thoroughly analyzed, bringing important contribution to epidemiological studies and
the performance of health services.2,3
The present study aimed to analyze the spatial distribu-tion of reported AIDS cases in adults and its associa-tion with living condiassocia-tions in the city of Campinas, Southeastern Brazil.
METHODS
An ecological study on the spatial distribution of the total number of AIDS cases in individuals aged more than 13 years was performed, excluding vertical trans-mission cases, in residents of the city of Campinas, State of São Paulo, Brazil, recorded in the Epidemiological Surveillance System, between 1980 and 2005. The vari-ables identifi ed in the epidemiological report fi le of the Information System for Notifi able Diseases (Sinan) and included in the spatial analysis of cases were address and sex. Maps of the three epidemic periods (from 1980 to 1995, from 1996 to 2000 and from 2001 to 2005) were constructed, with the distribution of male:female ratios (number of cases in men divided by that of women). The time trend of AIDS incidence rates per 100,000 cases, according to sex, and that of the male:female ratio was analyzed between 1980 and 2005.
The Índice de Condições de Vida (ICV – Life Conditions Index), comprised of eight socioeconomic indicators, weighted and selected from data available in the City
of Campinas Department of Health,a was used to
low-income dwellings (slums, tenement houses and improvised dwellings), level of education of head of family, proportion of mothers younger than 20 years, coefficient of child mortality and mortality from homicide, incidence of tuberculosis and incidence of malnourishment in children younger than fi ve years. Mean values of each area of health centers are used to analyze the ICV, which could limit the identifi cation of intra-area differences.
The digitalized cartographic base of the city of Campinas was designed by the Sociedade de Abastecimento de Água e Saneamento de Campinas (City of Campinas Sanitation and Water Supply Society) in 2000 with the AutoCAD software, and it is periodically updated by the Municipal Department of Planning and the Municipal Department of Health (last updated in 2006). Using the MAPINFO software, new districts, illegal settlements, urban constructions and housing complexes were included, in addition to the updating of data of interest in the area of health. The following parameters were used to construct this cartographic base: Hayford International Ellipsoid and Universal Transverse Mercator Projection, Córrego Alegre, State of Minas Gerais, Brazil.
The location of cases on the cartographic base was performed using home addresses, through the ArcMap 9.2. software method of geocoding, after correction and standardization of data, according to the city street layout base. Addresses that did not enable the exact location of the point in the map, due to a lack of information or inaccuracy of street name, were excluded. Once geocoded, the cases located on the base had their geographic coordinates projected on the UTM SAD69.
Kelsall & Diggle8 developed a method to obtain the
spatial risk, with the adjustment of generalized additive models (GAM), including the analysis of statistically signifi cant areas. A model was adjusted for each period, where the sex variable was used as response (coded as 1 for men and 0 for women) and the pair of geographic coordinates of cases, included as a non-parametric
vari-able in a smoothing function, as predictive varivari-able.1 In
this way, the values predicted by the model represent the relative proportion between men and women suffering from this disease.
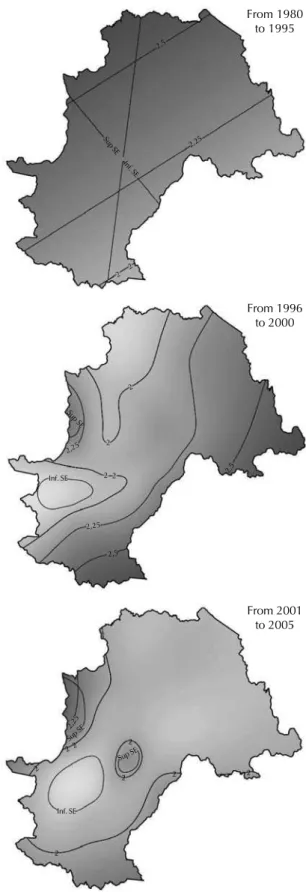
The models were calculated in the R software, version 8.2.0, using the GAM function of the mgcv package. The values predicted by the models were obtained for the coordinates of a grid of color, due to the predictive variable of the model, with the respective 95% confi -dence intervals, in which the 2.5% upper (SUP-SE lines) and lower limits (INF-SE lines) of standard error are shown. The numbers of lines in the map indicate how many times the male:female ratio is higher in that particular area, compared to the reference value of 1.
From 1980 to 1995 2,5
2 2
2,25
Sup SE
Sup SE
Sup SE Sup SE
Inf. SE
Inf. SE
2,25
2,25
2,25 2,5
2,5
2 2
2
2
2
2 2 2
2
2 2 2
Inf. SE
From 1996 to 2000
From 2001 to 2005
Note: the SUP-SE and INF-SE lines refer to the upper and lower limits of signifi cance of the values found
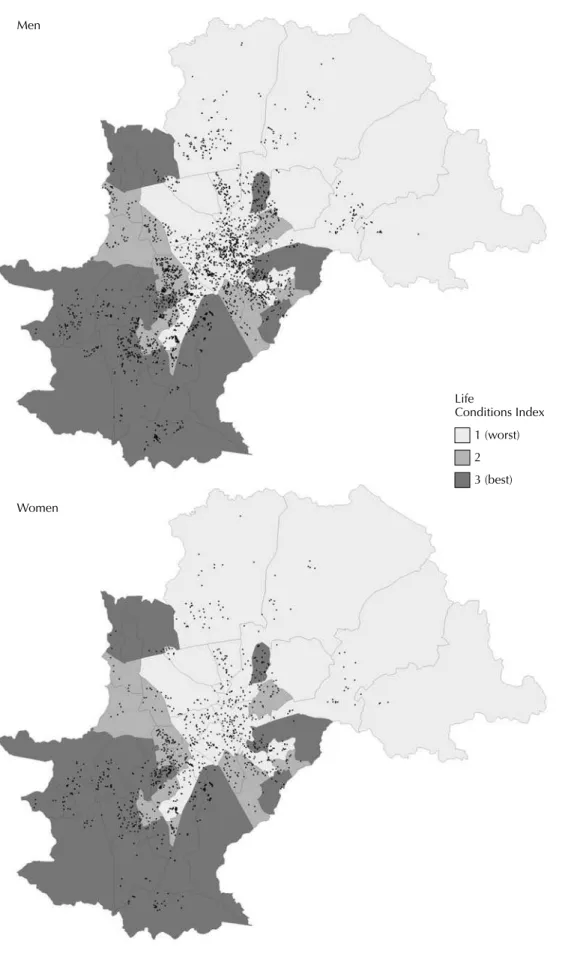
Figure 3. Maps of AIDS cases in men and women and Life Conditions Index (ICV) in areas covered by health services. City of Campinas, Southeastern Brazil, 1980-2005.
Men
Women
Life
RESULTS
A total of 7,381 AIDS cases, reported between 1980 a 2005, were recorded, of which 5,195 were in men (70.4%) and 2,186 in women (29.6%). Of these, 4,175 (56.6%) records were located in the cartographic base.
Figure 1 shows the temporal distribution of AIDS incidence rates by sex and the male:female ratio, in the period of study. A relative increase in incidence in women from 1990 on is observed.
The maps shown in Figure 2 reveal generalized linear models of spatial distribution of the male:female ratio in the three periods of study and the limits of signifi cance of estimators (SUP-SE and INF-SE). The differences throughout time indicate city locations where the male:female ratio of cases was signifi cantly higher, among which are the districts in the central and north areas of Campinas, the area surrounding the Complexo Presidiário de Hortolândia (Hortolândia Prison Complex), in the city of Hortolândia, a neighboring city of the Metropolitan Area of Campinas. The lower male:female ratio of cases was signifi cantly concen-trated in the suburbs situated in the southwestern area of the city, where living and health conditions are worse.
The spatial distribution of AIDS cases per sex and according to the ICV showed a signifi cant concentration of cases in areas with worse life conditions, groups 1 and 2, particularly with a greater proportion of women, when compared to areas with better quality of life and health belonging to the ICV 3 group (Figure 3).
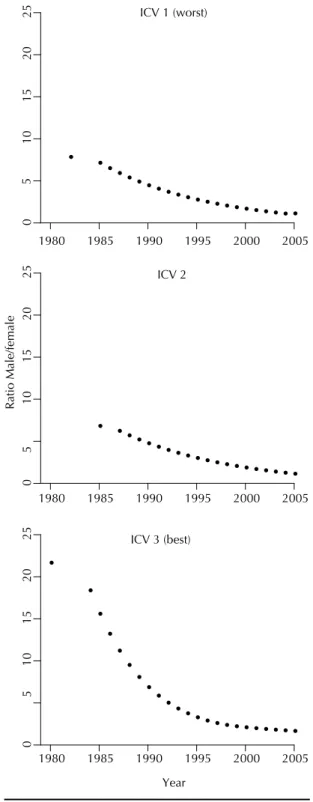
Figure 4 shows the temporal distribution of the male-female relationship in areas of the city classifi ed by the ICV, revealing different profi les of the epidemic in Campinas. This index was higher in areas with better living conditions (ICV 3) during the entire period, reaching a value almost three times higher than those found in areas with ICV 1, in the onset of the epidemic.
DISCUSSION
The maps of AIDS in Campinas show a trend towards this epidemic affecting more women and poorer individuals, with a decrease in the male:female ratio throughout time, in a heterogeneous way and in urban areas. This is a trend that has already been recorded in
other regions of Brazil in the last decades.6,7,10
Certain areas of Campinas have a higher male:female ratio than others, particularly districts situated in the central and northern areas of this city, close to the prison in Hortolândia, where former prisoners and their families have settled temporarily. The population of men infected with HIV/AIDS has a lower proportion in districts situated in the southwestern area of the city,
suburbs with low values of ICV and high criminality rate. The greater spread of HIV in women in poorer
areas has been reported in several studies.9,10,12,13,15
In addition to greater biological vulnerability to HIV infection, due to the higher prevalence of asymptom-atic sexually transmitted diseases and the higher risk
Figure 4. Temporal distribution of the male:female ratio of reported AIDS cases, according to the Life Conditions Index (ICV). City of Campinas, Southeastern Brazil, 1980–2005.
ICV 1 (worst)
0
101
52
02
5
1980 1985 1990 1995 2000 2005
ICV 2
0
101
52
02
5
1980 1985 1990 1995 2000 2005
Ratio Male/female
ICV 3 (best)
0
5
10
15
20
25
1980 1985 1990 1995 2000 2005
Year
5
of infection in sexual intercourse, there are subjective situations associated with gender inequalities that women are exposed to, especially those from lower social classes. HIV transmission in women increases in populations with lower level of education and income, with limited access to health services and policies to prevent HIV infection, apart from the variables related
to the previously mentioned gender inequality.9,14
Given the need to increase the understanding of the dynamics of production and transmission of HIV/AIDS infection, instruments traditionally used in GIS can be useful to identify areas with a greater concentration of cases, in addition to enabling the identifi cation of places with higher risk of infection, using statistical
models with greater explanatory potential.1,2,3 The use
of georeferenced points in maps allows greater accu-racy of analysis, because it is assumed that possible inner differences and inequalities in an area, divided into polygons, will not disappear. Thus, the onset of a disease is the focus, as a result of the demographic and social structure of the city and its differentiation in the country. In the present study, addresses that were not georeferenced result in loss of information, probably concentrated in the city suburbs. This could become bias of selection of cases, underestimating the occur-rences in poorer areas.
Efforts to improve the quality of information about the HIV/AIDS epidemic can be increased, leading to the development of the Epidemiological Surveillance System. The more accurate collection of addresses in the Sinan, in addition to the implementation of computer programs that enable the standardization of these addresses, correcting them and eliminating
duplicities, would facilitate data analysis and allow geoprocessing and the spatial analysis of the epidemic in the local/city dimension. Moreover, the return of such information to primary health units can result in greater involvement of local teams with prevention and care actions for populations included in the areas of their respective health centers.
Although the ecological approach enables the visual-ization of epidemic trends in the urban space and the identifi cation of places with a greater concentration of cases and risks, studies with a qualitative approach are required to enable the social and behavioral dynamics of susceptible groups to be better understood. The identifi cation of the main types of behavior towards and perceptions of the risk of AIDS and the barriers against changes in the routine interactions can certainly facili-tate the performance of municipal control programs.
In conclusion, different epidemics were visualized in the city maps. A pattern of transmission could be perceived in districts with better living and health conditions, where cases are concentrated in men, while another pattern of transmission is present in the suburbs, where the male:female ratio of cases is lower, revealing greater female susceptibility to infection. Spatial visu-alization of the male:female ratio enabled the trend towards more women being infected with HIV/AIDS to be confi rmed in the city of Campinas, particularly in the city suburbs.
1. Bailey T. Spatial Statistics Methods in Health. Cad Saude Publica. 2001;17(5):1083-98. DOI:10.1590/ S0102-311X2001000500011
2. Barcellos C, Acosta LMW, Lisboa EP, Brito MRV, Flores R. Estimativa da prevalência de HIV em gestantes por análise espacial, Porto Alegre, RS. Rev Saude Publica. 2006;40(5):928-30. DOI:10.1590/S0034-89102006005000007
3. Carvalho MS, Souza-Santos R. Análise de dados espaciais em saúde pública: métodos, problemas, perspectivas. Cad Saude Publica. 2005;21(2):361-78. DOI:10.1590/S0102-311X2005000200003
4. Castilho EA, Chequer P, Struchiner C. A epidemiologia da AIDS no Brasil. In: Parker R, Bastos C, Galvão J, Pedrosa JS, organizadores. A Aids no Brasil (1982-1992). Rio de Janeiro: Relume-Dumará; 1994. p.59-67. 5. Dias PRTP, Nobre FF. Análise dos padrões de
difusão espacial dos casos de AIDS por estados brasileiros. Cad Saude Publica. 2001;17(5):1173-87. DOI:10.1590/S0102-311X2001000500018 6. Fonseca MGR, Bastos FI, Derriço M, Andrade
CLT, Travassos C, Szwarcwald CL. Aids e grau de escolaridade no Brasil: evolução temporal de 1986 a 1996. Cad Saude Publica. 2000;16(Suppl 1):77-87. DOI:10.1590/S0102-311X2000000700007 7. Fonseca MGR, Bastos FI. Vinte e cinco anos da
epidemia de HIV e Aids no Brasil: principais achados epidemiológicos. Cad Saude Publica. 2007;23(Suppl 3):333-44. DOI:10.1590/S0102-311X2007001500002 8. Kelsall JE, Diggle PJ. Spatial variation in risk of disease:
a nonparametric binary regression approach. Apl Stat. 1998;47:559-73. DOI:10.1111/1467-9876.00128
9. Krishnan S, Dunbar MS, Minnis AM, Medlin CA, Gerdts CE, Padian NS. Poverty, gender inequalities and women’s risk of Human Immunodefi ciency Virus/AIDS. Ann N Y Acad Sci. 2008;1136:101-10. DOI:10.1196/ annals.1425.013
10. Quinn TC, Overbaugh J. HIV/AIDS in women: an expanding epidemic. Science. 2005;
308(5728):1582-3. DOI:10.1126/science.1112489
11. Rezende ELLF, Pascon ARP, Pereira GFM, Givisiez JM Sousa AIA, Arruda MR, Sakita K, Cunha ARC. Cenario Epidemiologico. Bol Epidemiol Aids DST. 2009;6(1):43-50.
12. Santos NJS, Tayra A, Silva SR, Buchalla CM, Laurenti R. A Aids no Estado de São Paulo. As mudanças no perfi l da epidemia e perspectivas da vigilância epidemiológica. Rev Bras Epidemiol. 2002;5(3):286-310. DOI:10.1590/S1415-790X2002000300007
13. Takahashi RF, Shima H, de Souza M. Mulher e Aids: perfi l de uma população infectada e refl exões sobre suas implicações sociais. Rev Latino-Am Enferm. 1998;6(5):59-65. DOI:10.1590/S0104-11691998000500008
14. Tomazelli J, Czeresnia D, Barcellos C. Distribuição dos casos de AIDS em mulheres no Rio de Janeiro, de 1982 a 1997: uma análise espacial. Cad Saude Publica. 2003;19(4):1049-61. DOI:10.1590/S0102-311X2003000400027
15. Wallace R, Wallace D. U.S. Apartheid and spread of AIDS to the suburbs: a multy-city analysis of the political economy of spatial epidemic threshold. Soc Sci Med. 1995;41(3):333-45. DOI:10.1016/0277-9536(94)00349-X
REFERENCES
Article based on the Master’s degree dissertation by CA Henn, presented to the of Faculdade de Ciências Médicas da Universidade Estadual de Campinas, in 2007.