A NEW CURRENT TRANSFORMER MODEL
Francisco das Chagas Fernandes Guerra
∗Wellington Santos Mota
∗∗DEE-UFCG – Av. Aprígio Veloso, 882 - Bodocongó CEP 58109-970 – Campina Grande PB
ABSTRACT
This paper presents a current transformer model that is use-ful on low frequency applications. To describe the iron core magnetic behaviour of the iron core, a hysteresis model is proposed, which is able to generate minor asymmetric loops and remanent flux. The effects of classic eddy current losses and anomalous losses are represented by linear and nonlin-ear resistors, respectively. The obtained results are compared with those calculated by Preisach’s model and measured in laboratory. This model may be applied in power system pro-tection studies, as it is the case of numeric correction of dis-torted secondary currents in current transformers (CT’s).
KEYWORDS: Current transformers, hysteresis, magnetic losses, digital protection.
RESUMO
This paper presents a current transformer model that is use-ful on low frequency applications. To describe the iron core magnetic behaviour of the iron core, a hysteresis model is proposed, which is able to generate minor asymmetric loops and remanent flux. The effects of classic eddy current losses and anomalous losses are represented by linear and nonli-near resistors, respectively. The obtained results are compa-red with those calculated by Preisach’s model and measucompa-red in laboratory. This model may be applied in power system protection studies, as it is the case of numeric correction of distorted secondary currents in current transformers (CT’s).
Artigo submetido em 25/04/2005 1a. Revisão em 22/06/2005; 2a. Revisão em 06/09/2005;
Aceito sob recomendação do Ed. Assoc. Prof. José Antenor Pomilio
PALAVRAS-CHAVE: Current transformers, hysteresis, mag-netic losses, digital protection.
1
INTRODUCTION
The fault currents in electric power systems present a sinu-soidal component and a DC component with exponential de-cline. The first produces a sinusoidal magnetic flux in the current transformer core. The second produces an initially increasing flux with subsequent decline. The total flux, as-sociated to the remanent flux, can produce a high saturation level in the core. This fact usually causes severe distortions in the secondary currents supplied to the protection relays. In consequence, the following problems can take place:
a. The relays can operate inadequately.
b. The relays are not sensitized due to the distortions that reduce the RMS value of the secondary current.
c. The relay operations can be delayed, for the reason mentioned in the previous item.
d. The fault locators do not show correct indication.
Those occurrences can cause thermal and electrodynamics damages (b, c), loss of coordination in the protection relays and difficulty of location of the faulted point (a, b, c, d), or loss of system stability (b, c).
properties are not represented by accurate models. The mag-netization characteristics are usually represented by simple models, using the saturation curve.
The magnetic hysteresis representation needs to be investi-gated, because it determines the values of residual flux in the CT magnetic core. Such phenomenon is more important to be taken into account in the case of non-gapped CT’s, used in schemes with automatic reclosing.
The works that consider the hysteresis effects in CT’s use models in which important nonlinear effects are not repre-sented. The model proposed by Poljak and Kolibas (1988) is not able to reproduce the real magnetization properties of the ferromagnetic materials.
In other works, studies of the CT’s transient behavior us-ing an EMTP model have been made (Conrad and Oedus-ing, 1987; Kezunovic et al, 1994; Chaudhary et al, 1994; Kang et
al, 1997). This model represents the magnetic core
nonlin-ear behavior by a hysteretic inductor (type 96), developed by Frame et al (1982), based on some modifications made in the model proposed by Talukdar and Bailey (1976). However, it was reported inaccuracies in the obtained results, when sim-ulations and field tests were compared.
Locci and Muscas (2001) presented a correction technique of the distorted secondary currents based on a model which takes into account hysteresis and eddy current effects. How-ever, the hysteresis model is not able to reproduce the prop-erties of closing and elimination of the minor loops (Telli-nen, 1998). However, the model applications were limited to steady state operation.
A correction technique was presented by Bittanti et al (2001), where the primary current is estimated from measurements of secondary distorted currents, using least square technique. The iron core was modeled without consider the magnetic properties of the material.
A hysteresis model requires data not always available. There are models that require a set of points of the DC loop as input data. However, it is not common to obtain this information. The data more easily available are the magnetic induction and field intensity, characteristics of the core material, usu-ally supplied by the manufacturer. Normusu-ally, these values are converted in magnetic flux and magnetizing current, us-ing the geometric parameters of the core and the number of turns of the windings. For power transformers, this prac-tice produces significant errors because, in the construction of the core, the sheets are cut, having insertion of unknown gap lengths. Because of this, the obtained magnetic charac-teristic is not the real characcharac-teristic (Elleuch and Poloujadoff, 1998). Fortunately, such fact does not occur in case of cur-rent transformers, which present simple geometry and
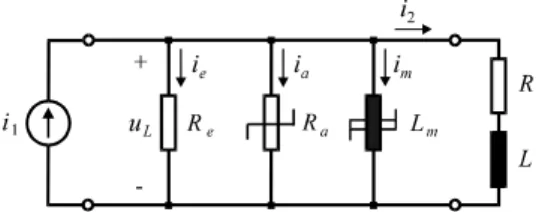
rela-Figure 1: The proposed CT equivalent circuit.
tive easiness of data obtainment. A CT core usually has a toroidal form (a ribbon made of a silicon-iron alloy, coiled in a helicoidal way). The gaps intentionally inserted have known equivalent length.
2
THE
CURRENT
TRANSFORMER
MODEL
2.1
Equivalent Electric Circuit
The proposed CT equivalent electric circuit is shown in fig-ure. 1. RandLrepresent the resistance and the inductance of the secondary (winding and load). The nonlinear induc-tor is associated to the saturation and hysteresis effects of the magnetic core. The effects of classic eddy current losses and anomalous losses are represented byRe(linear resistor)Ra
(nonlinear resistor), respectively.
2.2
Hysteresis Modeling
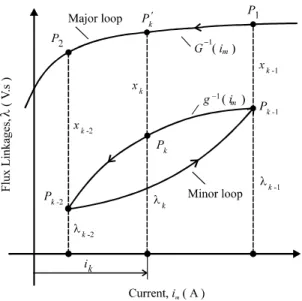
The proposed model starts from the Talukdar and Bailey work (Talukdar and Bailey, 1976). A minor loop between the pointsPk−1andPk−2and a part of the descending branch of
the major DC hysteresis loop are shown in figure 2.xkis the
vertical distance from a pointPk, on descending trajectory
of the minor loop, to the pointPk’, on descending trajectory
of the major loop. It is supposed thatxkvaries as follows:
xk =xk−2+ (xk−1−xk−2)
λ
k−λk−2 λk−1−λk−2
1+β|λk/λs|
(1)
xk−1 and xk−2 are the vertical distances from Pk−1 and Pk−2 (turning points) to the descending branch of the
ma-jor hysteresis loop;λk,λk−1andλk−2are the values of flux
linkages in the pointsPk,Pk−1andPk−2; ß is a parameter
that depends on the core material;λsis the value of the flux
linkages when the magnetic core starts to saturate.
The descending branch of the major loop is fitted by the func-tionim=G(λ). For the pointsPkandPk’, it follows that:
Figure 2: Asymmetric hysteresis loops.
The ß parameter establishes different slopes for the magnetic trajectories. The best value of ß is obtained from compar-isons of magnetic paths generated by equation (1) and equa-tion (2) with paths obtained by laboratory measurements.
Similar way is applied to the generation of ascending paths inside the major loop, considering the ascending branch.
The closing and elimination rules of the minor loops are re-produced by a stack that registers the magnetic history of the material. Initially, the stack is assumed empty. When the magnetizing trajectory passes a reversal point, this point is placed on the upper position of the stack. If the abso-lute value of the last calculatedλexceeds the absolute value of the last but one value kept in the stack, a minor loop is closed, and the coordinates of the two last reversal points are removed from the stack; so, the minor loop does not have any influence in the future magnetic state of the material.
In order to represent the major hysteresis loop, the following function may be used:
im=a.tan
λ b
±c (3)
The constantsa,bandcare determined from the major hys-teresis loop, using curve fitting routines.
In order to approximate the initial magnetization curve in the first quadrant, the following equation is used:
im=a.tan
λ
b
+c 1−e−αλ
(4)
The parameterαreproduces the portion of the curve closest
to the origin (Rayleigh region).
When the core reaches high saturation levels, equation (3) and equation (4) may be inaccurate. A way to improve the fitting is to use sequences of points of the initial magneti-zation curve and the major hysteresis loop. A value of im
corresponding to an intermediate value ofλis obtained us-ing a search routine in an ordinate table (Press et al, 1986) and linear interpolation. In this case, it is not necessary to determine a value forα.
2.3
Core Losses Modeling
For a flux densityB = Bmsin2πft, the total specific
mag-netic losses (W/kg), per cycle, is (Fiorillo and Novikov, 1990):
p f =
ph
f + 19.7392KeB 2
mf+ 8.7634KaBm3/2f 1/2
(5)
f is the frequency and ph is the specific hysteresis losses
(W/kg).KeandKaare, respectively, the constants of classic
eddy current losses and anomalous losses.
Ke,Ka and the specific hysteresis losses for cycle,Ph/f,
are determined by a fitting routine, from a set of points of the curveP/f versusf, obtained in laboratory, using a variable frequency source, with the peak induction value sustained in the nominal value of operation.
The inductionBin the core can be written as follows:
dB(t)
dt =
uL(t)
N S (6)
N is the number of turns of the secondary winding andS is the cross-section area of iron core.
The instantaneous eddy current losses and anomalous losses in the magnetic core in figure 1 are given, respectively, for the expressions (Zhu et al, 1993):
Pe(t) =Ke
dB(t)
dt
2
dSl (7)
Pa(t) =Ka
dB(t)
dt
3/2
dSl (8)
The parameterdis the density of the magnetic material andl
is the mean magnetic path length. Replacing equation (6) in equation (7), results:
Pe(t) =Ke u2
L(t)
N2Sdl (9)
Considering that
Re= u 2 L(t) Pe(t)
the resistance of classic parasitic losses is:
Re= N2S Kedl
(11)
Replacing equation (6) in equation (8), gives:
Pa(t) =Ka| uL(t)|
3/2
N3/2S1/2dl (12)
The resistance of anomalous losses is:
Ra(t) =u 2 L(t) Pa(t)
(13)
From equation (12) and equation (13), results:
Ra(t) =K p
|uL(t)| (14)
K=
√
N3S Kadl
(15)
2.4
Circuit Equations
For the circuit in figure 1, it follows that:
dλ(t)
dt =uL(t) (16)
Ldi2(t)
dt +Ri2(t) =uL(t) (17)
i2(t) +im(t) +ia(t) + uL(t)
Re
=i1(t) (18)
uL(t) =K p
|uL(t)|ia(t) (19) im(t) =g[λ(t)] (20)
Equation (20) describes the proposed hysteresis model. Inte-grating equations (16) and (17), it is obtained:
λ(t)−λ(0) =
Z t
0
uL(t)dt (21)
L[i2(t)−i2(0)] +R
Z t
0
i2(t)dt=
Z t
0
uL(t)dt (22)
Using the trapezoidal integration rule, the discretized equa-tions for the circuit are:
λ(τ)−λ(0) =A1+ h
2[uL(τ) +uL(τ−h)] (23)
L[i2(τ)−i2(0)] +R
A2+h2[i2(τ) +i2(τ−h)]
=A2+h2[uL(τ) +uL(τ−h)]
(24)
i2(τ) +im(τ) +ia(τ) +uL(τ) Re
=i1(τ) (25)
uL(τ) =K p
|uL(τ)|ia(τ) (26) im(τ) =g[λ(τ)] (27)
0 . 0
0 00.04 00.0800.02100.061 0
. 0 0
0 . 0 1
0 . 0 2
0 . 0 3
0 . 0 4
Mag
ne
t
i
c
Lo
s
s
e
s
,
p
/
f
(
J
/
kg
)
F r e q u e n c y , f ( H z )
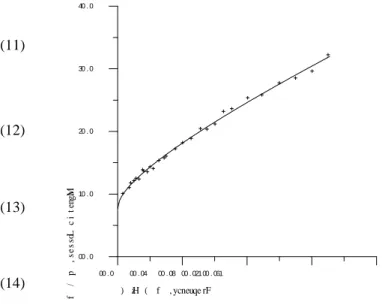
Figure 3: Magnetic losses as a function of frequency.
The constantsA1andA2are given by:
A1=
Z τ−h
0
uL(τ)dτ (28)
A2=
Z τ−h
0
i2(τ)dτ (29)
The nonlinear system is solved by using the Newton-Raphson method, considering a time steph= 1µs.
3
RESULTS
A toroidal core was used in the laboratory measurements. It was made of a grain-oriented silicon-iron alloy, with the following data: mean diameter, 0.125 m; cross-section area, 0.001 m2; lamination thickness, 0.3 mm; stacking factor,
0.96; weight, 3 kg; number of turns in primary and secondary windings, 60; windings resistance, 0.2Ω.
The measured curve of magnetic losses as a function of fre-quency, in the range 0-130 Hz, is presented in figure 3, for a peak value inductionBm= 1.5 T.
The parameters of equation (5) were determined using a fit-ting routine based on Levenberg-Marquardt’s method (Press
et al, 1986). The results are:ph/f= 7.734x10⁻³J / kg,Ke
= 2.076x10⁻⁶,K
a= 6.590x10⁻⁵.
The measured and calculated hysteresis loops are shown in figure 4 (flux linkages versus excitation current,i=im+ie
+ia), forBm= 1.76 T andβ= 0.3.
-4 . 0
0 00.2- 00.0 00.2 00.4 -0 . 2 0 -0 . 1 0 0 . 0 0 0 . 1 0 0 . 2 0 6 0 H z , m e a s u r e d 6 0 H z , c a l c u l a t e d D C , m e a s u r e d C u r r e n t , i ( A ) Fl ux Li nk ag es , ( V. s )
Figure 4: Hysteresis loops;Bm= 1.76T,β = 1.7.
0 . 0
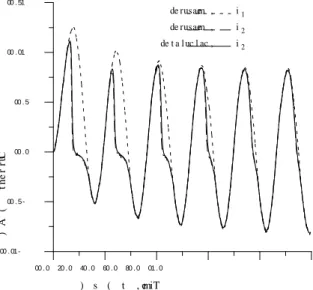
0 20.0 40.0 60.0 80.0 01.0 -1 0 . 0 0 -5 . 0 0 0 . 0 0 5 . 0 0 1 0 . 0 0 1 5 . 0 0 T i m e , t ( s ) Cu r r e nt ( A ) i , m e a s u r e d i , m e a s u r e d i , c a l c u l a t e d 1 2 2
Figure 5: Currents; burden: 2.40 +j0.10Ω.
excitation and burden. The excitation was increased to satu-rate the core, and after gradually decreased, in such way that the residual flux was made equal to zero.
The fault inception angle,θ, was set for 0oby a synchronous switch (a triac controlled by an electronic circuit).
The proposed CT model was compared with another model in which the hysteresis is represented by using the Preisach’s theory. For this purpose, a new routine was carried out, in such way that equation (27) was replaced byλ (τ ) = g′[ im (τ )], according to the formulation presented by Naidu
(1990).
0 . 0
0 20.040.060.080.0 01.0 -1 0 . 0 0 -5 . 0 0 0 . 0 0 5 . 0 0 1 0 . 0 0 1 5 . 0 0 T i m e , t ( s ) Cu r r en t ( A ) i , m e a s u r e d i , m e a s u r e d i , c a l c u l a t e d 1 2 2
Figure 6: Currents; burden: 1.52 +j1.70Ω.
Simulations were performed considering a fault at the receiv-ing end of a hypothetic transmission line with lumped RL se-ries parameters. The transmission line impedance was 1.44 +j14.4Ω. At the sending end, it was considered a 120 V, 60 Hz voltage source. In all cases,λ(0) = 0.
Hysteresis minor loops are shown in figure 7, for an impedance burden Z = 0.25 + j 0.15Ω. Three intervals of time were considered: first closing, dead time and reclosing, each of them corresponding to 2 cycles in 60 Hz, with fault inception angleθ= 0o.
The flux linkages and the windings currents waveforms are shown in figure 8 and figure 9, for a burden Z = 1.0 +j0.5Ω. It was considered closing (3.5 cycles), dead time (5 cycles) and reclosing (5 cycles), with fault inception anglesθ1= (first
closing) andθ2= 0o(reclosing).
In order to evaluate the influence of the residual flux in the core, the fault inception angle in the reclosing period, θ2,
was changed to 180o. The results are shown in figure 10 and figure 11.
At the beginning of the reclosing period, the flux imposed by the excitation increases with same polarity than the residual flux in the core. Therefore, a higher level of saturation is reached and the distortion in the secondary current is more pronounced than those indicated in figure 9 (in this case, the flux imposed by the excitation increases with opposed polar-ity than the residual flux). It was observed a good agreement of the results obtained by application of the two models.
-2 . 0
0 00.0 00.2 00.4 00.6 0 . 0 0 0 . 0 4 0 . 0 8 0 . 1 2 C u r r e n t , i ( A ) Fl ux Li nk a ge s , ( V. s ) P r e i s a c h ' s m o d e l P r o p o s e d m o d e l
Figure 7: Hysteresis minor loops; Z = 0.25 +j0.15Ω.
0 . 0
0 50.0 01.0 51.0 02.052.0 -0 . 2 0 -0 . 1 0 0 . 0 0 0 . 1 0 0 . 2 0 T i m e , t ( s ) Fl ux Li nk ag es , ( V. s ) P r o p o s e d m o d e l P r e i s a c h ' s m o d e l
Figure 8: Flux linkages;θ1=θ2= 0o, Z = 1.00 +j0.50Ω.
obtained by another way,i2∗, is calculated as follows:
δ= 100.i ∗ 2−i2 KfIr
(30)
Where,Ir is the rated secondary current (1 A);Kf is the
overcurrent factor (20, according to international standards). The deviationδis taken as a percentage ofKfIrbecause the
CT performance must be evaluated in fault conditions.
The maximum deviations δmax occurred in the analyzed
cases are summarized in table 1.
0 . 0
0 50.001.0 51.002.0 52.0 -2 0 . 0 0 -1 0 . 0 0 0 . 0 0 1 0 . 0 0 2 0 . 0 0 T i m e , t ( s ) Cu r r e nt ( A ) i1 i , p r o p o s e d m o d e l 2 i , P r e i s a c h ' s m o d e l 2
Figure 9: Currents;θ1=θ2= 0o, Z = 1.00+j0.50Ω.
0 . 0
0 50.0 01.0 51.0 02.0 52.0 0 . 0 0 0 . 0 4 0 . 0 8 0 . 1 2 T i m e , t ( s ) Fl ux Li nk a ge s , ( V. s ) P r o p o s e d m o d e l P r e i s a c h ' s m o d e l
Figure 10: Flux linkages; θ1=0o, θ2 =180o, Z =1.00 +j
0.50Ω.
Table 1: Maximum secondary current deviations
Figure Comparison CT burden θ1(θ2) δmax
(Ω) (o
) (%)
Figure 5 Proposed model vs 2.40 +j0.10 0 3.1
Experimental
Figure 6 Proposed model vs 1.52 +j1.70 0 0.8
Experimental
Figure 9 Proposed model vs 1.00 +j0.50 0, (0) 0.7
Preisach’s model
Figure 11 Proposed model vs 1.00 +j0.50 0, (180) 0.9
0 . 0
0 50.0 01.051.0 02.052.0 -2 0 . 0 0 -1 0 . 0 0 0 . 0 0 1 0 . 0 0 2 0 . 0 0 T i m e , t ( s ) Cu r r e nt ( A ) i1 i , p r o p o s e d m o d e l 2 i , P r e i s a c h ' s m o d e l 2
Figure 11: Currents;θ1= 0o,θ2= 180o, Z = 1.00 +j0.50
Ω.
0 . 0
0 50.0 01.051.002.0 52.0 0 . 0 0 1 0 0 . 0 0 2 0 0 . 0 0 3 0 0 . 0 0 4 0 0 . 0 0 T i m e , t ( s ) Re s i s t an ce , R ( ) a
Figure 12: Anomalous losses resistance;θ10o,θ2= 180o. Z
= 1.00 +j0.50Ω.
For the last case, the variation of the anomalous loss resis-tance with the time is shown in figure 12.
The results obtained through the proposed model were com-pared with those obtained using an easy model, in which the saturation curve is used to model the non-linear inductance. The total magnetic losses are represented by a linear resis-tance (191.8Ω), determined from measurements of the losses with variable applied voltage. Although theλ-imcurve is
singular, the iron core has a hysteretic behavior if the total
0 . 0
0 40.0 80.0 21.0 61.0 -2 0 . 0 0 -1 0 . 0 0 0 . 0 0 1 0 . 0 0 2 0 . 0 0 3 0 . 0 0 Cu r r en t , i ( A ) 2 T i m e , t ( s ) S a t u r a t i o n c u r v e P r o p o s e d m o d e l
Figure 13: Currents;θ1= 0o,θ2= 0o, Z = 0.40 +j0.15Ω.
0 . 0
0 40.0 80.0 21.0 61.0 -2 0 . 0 0 -1 0 . 0 0 0 . 0 0 1 0 . 0 0 2 0 . 0 0 Cu r r en t , i ( A ) 2 T i m e , t ( s ) S a t u r a t i o n c u r v e P r o p o s e d m o d e l
Figure 14: Currents;θ= 0o,θ
2= 0o, Z = 2.25 +j0.15Ω.
excitation current is taken into account.
It was considered three intervals of time: first closing (3 cy-cles, θ1= 0o), dead time (2 cycles) and reclosing (4 cycles, θ2= 0o). figure 13 and figure 14 illustrate the differences
be-tween the secondary currents, considering a burden of 0.40 +
j0.15Ωand 2.25 +j0.15Ω, respectively.
if compared with the large excursions in the saturated region.
4
CONCLUSION
A new current transformer model was presented, which in-cludes the representation of the hysteresis and the dynamic losses in the core. The results obtained with the proposed hysteresis model are very close to the measurements, as well as to the Preisach’s model. The model has a simple formula-tion, with easy understanding and implementation. The num-ber of calculations is less than the Preisach model, because only simple algebraic equations are involved.
The graphical comparisons of the proposed hysteresis model with the model in which the saturation curve is used show that a more detailed iron core representation is necessary when moderate saturation levels are reached.
This method is valid for any toroidal non-gapped iron core CT, regardless on size and rating. Moreover, it is suitable for multiple current transformers connected to the same bur-den. For applications in current transformers with complex magnetic cores, it is necessary additional developments.
The frequency limits of this model are the same ones estab-lished by standards like ANSI and IEC (25 up to 400 Hz). For high frequency applications, it is necessary to include the distributed capacitances in an appropriate way.
Due the simplicity, the authors believe that this method may be used in other available tools for current transformers mod-eling, like EMTP and EMTDC.
The magnetic core model presented here is also useful for other purposes, such as studies of ferroresonance and inrush currents in power transformers.
ACNOWLEDGMENT
The authors would like to thank Prof. Damásio Fernandes Júnior of Universidade Federal de Campina Grande for his stimulating interest in this work and his suggestions.
REFERENCES
Bittanti, S., F. A. Cuzzola, F. Lorito & G. Poncia (2001). Compensation of nonlinearities in the current transformer for the reconstruction of the primary current. IEEE
Trans-actions on Control Systems Technology, Vol.9, no4, pp. 565-573.
Chaudhary, A. K. S., K. Tam & A. G. Phadke (1994). Protec-tion system representaProtec-tion in the Electromagnetic Tran-sients Program. IEEE Transactions on Power Delivery,
Vol. 9, no2, pp. 700-708.
Conrad, T. & D. Oeding (1987). A method to correct the distorted secondary currents of current transformers.
Pro-ceedings of PSCC, Vol. 2, no3, pp. 311-315.
Elleuch, M. & M. Poloujadoff, (1998). New transformer model including joint air gaps and lamination anisotropy.
IEEE Transactions on Magnetics, Vol.34, no5, pp. 3701-3711.
Fiorillo, F. & A. Novikov (1990) An improved approach to power losses in magnetic laminations under non-sinusoidal induction waveform. IEEE Transactions on
Magnetics, Vol 26, no5, pp. 2904-2910.
Frame, J. R.; N. Mohan & T. Liu (1982). Hysteresis model-ing in an electromagnetic transients program, IEEE
Trans-actions on Power Apparatus and Systems, Vol. 101, no9, pp. 3403-3412.
Kang, Y. C, J. K. Park, S. H. Kang, A. T. Johns & R. K. Ag-garwal (1997). An algorithm for compensating secondary currents of current transformers, IEEE Transactions on
Power Delivery, Vol. 12, no1, pp. 116-124.
Kezunovic, M., C. W. Fromen & F. Philips (1994). Exper-imental evaluation of EMTP-based current transformer models for protective relay transient study. IEEE
Trans-actions on Power Delivery, Vol.9, no1, pp. 405-412.
Locci, N. L. & C. Muscas (2001). Hysteresis and eddy cur-rents compensation in current transformers, IEEE
Trans-actions on Power Delivery, Vol.16, no2, pp. 154-159.
Naidu, S. R. (1990). Simulation of the hysteresis phe-nomenon using Preisach’s theory. IEE Proceedings, Vol. 137(A), no2, pp.73-79.
Poljak, M. & M. Kolibas (1988). Computation of current transformer transient performance. IEEE Transactions on
Power Delivery, Vol. 3, no4, pp. 1816-1822.
Press, W. H., B. P. Flannery, S. A. Tewkolsky and W. T. Wet-terling (1986). Numerical Recipes – The Art of Scientific
Computing. Cambridge University Press.
Talukdar, S. R. & J. R. Bailey (1976). Hysteresis model for system studies. IEEE Transactions on Power Apparatus
and Systems, Vol.95, no4, pp. 1429-1434.
Tellinen, J. (1998). The simple scalar model for magnetic hysteresis. IEEE Transactions on Magnetics, Vol.34, no 4, pp. 2200-2206.