Based on DArT Markers
Paweł Milczarski1., Hanna Bolibok-Bra˛goszewska2
*., Beata Mys´ko´w1
, Stefan Stojałowski1, Katarzyna Heller-Uszyn´ska3, Magdalena Go´ralska1, Piotr Bra˛goszewski4, Grzegorz Uszyn´ski3, Andrzej Kilian3,
Monika Rakoczy-Trojanowska2
1Department of Plant Genetics, Breeding and Biotechnology, West-Pomeranian University of Technology, Szczecin, Poland,2Department of Plant Genetics, Breeding and Biotechnology, Warsaw University of Life Sciences, Warsaw, Poland,3Diversity Arrays Technology P/L, Canberra, Australia,4Laboratory of Mitochondrial Biogenesis, International Institute of Molecular and Cell Biology, Warsaw, Poland
Abstract
Background:Rye (Secale cereale L.) is an economically important crop, exhibiting unique features such as outstanding resistance to biotic and abiotic stresses and high nutrient use efficiency. This species presents a challenge to geneticists and breeders due to its large genome containing a high proportion of repetitive sequences, self incompatibility, severe inbreeding depression and tissue culture recalcitrance. The genomic resources currently available for rye are underdeveloped in comparison with other crops of similar economic importance. The aim of this study was to create a highly saturated, multilocus linkage map of rye via consensus mapping, based on Diversity Arrays Technology (DArT) markers.
Methodology/Principal Findings:Recombinant inbred lines (RILs) from 5 populations (564 in total) were genotyped using DArT markers and subjected to linkage analysis using Join Map 4.0 and Multipoint Consensus 2.2 software. A consensus map was constructed using a total of 9703 segregating markers. The average chromosome map length ranged from 199.9 cM (2R) to 251.4 cM (4R) and the average map density was 1.1 cM. The integrated map comprised 4048 loci with the number of markers per chromosome ranging from 454 for 7R to 805 for 4R. In comparison with previously published studies on rye, this represents an eight-fold increase in the number of loci placed on a consensus map and a more than two-fold increase in the number of genetically mapped DArT markers.
Conclusions/Significance: Through the careful choice of marker type, mapping populations and the use of software packages implementing powerful algorithms for map order optimization, we produced a valuable resource for rye and triticale genomics and breeding, which provides an excellent starting point for more in-depth studies on rye genome organization.
Citation:Milczarski P, Bolibok-Bra˛goszewska H, Mys´ko´w B, Stojałowski S, Heller-Uszyn´ska K, et al. (2011) A High Density Consensus Map of Rye (Secale cerealeL.) Based on DArT Markers. PLoS ONE 6(12): e28495. doi:10.1371/journal.pone.0028495
Editor:Samuel P. Hazen, University of Massachusetts Amherst, United States of America ReceivedJuly 13, 2011;AcceptedNovember 9, 2011;PublishedDecember 6, 2011
Copyright:ß2011 Milczarski et al. This is an open-access article distributed under the terms of the Creative Commons Attribution License, which permits unrestricted use, distribution, and reproduction in any medium, provided the original author and source are credited.
Funding:This work has been financially supported by the Ministry of Science and Higher Education [http://www.nauka.gov.pl/home/] grant NN 302361833. The funders had no role in study design, data collection and analysis, decision to publish, or preparation of the manuscript.
Competing Interests:Employees of DArT P/L co-authoring this paper (AK, KH-U and GU) may benefit financially from this work. This does not alter the authors’ adherence to all the PLoS ONE policies on sharing data and materials.
* E-mail: [email protected]
.These authors contributed equally to this work.
Introduction
Rye (Secale cereale L.) is the second most important cereal in Europe, where it is cultivated on 5.8 million hectares [http:// faostat.fao.org]. The species is relatively high yielding under environmental conditions in which other crops perform poorly even with low chemical inputs, such as fertilizers and pesticides, enabling ecologically and economically sound cultivation [1]. Rye also plays an important role as a source of alien genes for wheat (Triticum aestivum L.): the 1BL.1RS or 1AL.1RS translocation is present in hundreds of wheat cultivars [2]. In addition, rye is a donor of the R genome to triticale (X Triticosecale Wittmack), a synthetic wheat-rye hybrid that occupies a significant niche in European agriculture.
molecular mapping in rye, but integrated maps have only been presented by Stojałowski et al. [18] for the 6R chromosome and by Gustafson et al. [19] for all seven chromosomes from five populations.
Overall, the progress in genetic linkage mapping of rye has lagged behind that of other cereals. This is due to several factors including (i) an enormous genome (1C = 7917 Mbp [20]) contain-ing a large proportion of repetitive sequences, (ii) inbreedcontain-ing depression which has hampered the development of large recombinant inbred line (RIL) populations, (iii) tissue culture recalcitrance which has prohibited the efficient generation of doubled haploid (DH) populations, and (iv) the absence of a high throughput genotyping technology producing numerous polymor-phic markers.
Diversity Arrays Technology (DArT) is a microarray-based genotyping method in which whole-genome fingerprints are generated by scoring the presence or absence of genomic DNA loci [21]. DArT alleviates a number of the limitations of gel-based marker technologies by enabling the simultaneous scoring of several thousand loci in a single assay in a largely automatic, highly reproducible and cost-effective manner. Moreover, unlike the majority of the existing Single Nucleotide Polymorphism (SNP) genotyping platforms, DArT does not rely on DNA sequence information [21–22]. DArT markers have been developed and successfully applied to genetic analyses in a number of plant species [22], including wheat [23], barley [24] rye [25], and triticale [26–28].
The development of an 11,520-clone DArT array for rye enabled the creation of a high-density map of the rye cross L3186
L9 containing over 1000 loci [25]. With an average density of one marker every 2.7 centiMorgans (cM), this was the most saturated genetic map of the rye genome, containing exclusively transferable markers, and the first created using a microarray based technology. This study also revealed several thousand DArT markers differentiating the parents of other crosses used in rye genetic mapping. The availability of numerous markers segregat-ing in multiple populations is a prerequisite for the construction of integrated consensus linkage maps, which are invaluable for obtaining more complete genome coverage and a better understanding of its structure, precise comparison of quantitative trait loci (QTL) locations, and also anchoring of a physical map.
Our aim in this study was to create a saturated consensus linkage map of rye based on DArT marker data from five RIL mapping populations: L3186L9, 5416Ot1-3, Ds26RXL10,
S1206S76 and 54162020. We constructed an integrated map containing 4048 loci, which represents an eight-fold increase in the number of loci placed on a consensus map and a more than two-fold increase in the number of genetically mapped DArT markers compared with previously published studies on rye [19,25].
Materials and Methods
Mapping populations
Five RIL mapping populations, originating from 9 parental lines, were used in this study. Information on the origin and pedigree of the parental inbred lines is given in Table 1. Subsets of the parental lines were previously included in studies of rye genetic diversity that indicated a high level of polymorphism between the parents of individual populations [25,29–31]. The parental lines also exhibited contrasting phenotypes with respect to several traits (Table 2). The L318 6 L9 (H) population was used previously by Bolibok– Bra˛goszewska et al. [25] for the construction of a high density DArT-based map, which also included several SSR anchor markers. The RIL mapping population L was developed from the F2progeny of the cross Ds26RXL10 used by Devos et al. [3] for
the construction of a linkage map of rye with RFLP markers, which was later saturated with PCR-based markers [11]. This mapping population is considered a reference for linkage mapping studies in rye. F2-based maps were also created using PCR-based markers for
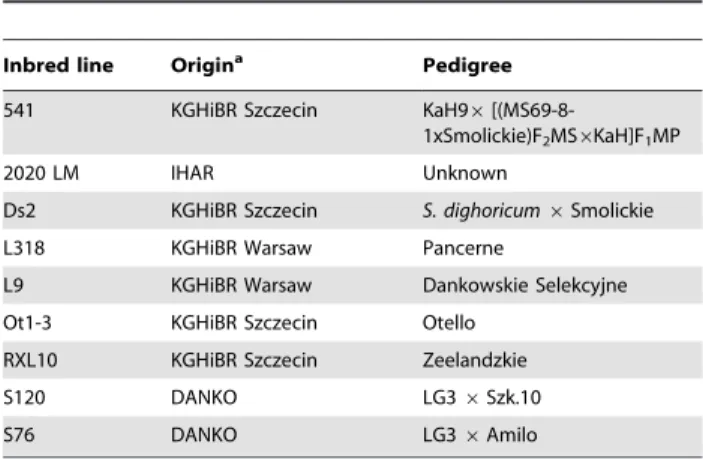
Table 1.Origin and pedigree for parental lines of RIL populations.
Inbred line Origina Pedigree
541 KGHiBR Szczecin KaH96
[(MS69-8-1xSmolickie)F2MS6KaH]F1MP
2020 LM IHAR Unknown
Ds2 KGHiBR Szczecin S. dighoricum6Smolickie
L318 KGHiBR Warsaw Pancerne
L9 KGHiBR Warsaw Dankowskie Selekcyjne
Ot1-3 KGHiBR Szczecin Otello
RXL10 KGHiBR Szczecin Zeelandzkie
S120 DANKO LG36Szk.10
S76 DANKO LG36Amilo
aOrigin: DANKO – DANKO Plant Breeding Ltd, Choryn, Poland; IHAR – Plant Breeding and Acclimatization Institute – National Research Institute, Radzikow, Poland; KGHiBR Szczecin – Department of Plant Genetics, Breeding and Biotechnology, West-Pomeranian University of Technology, Szczecin, Poland; KGHiBR Warsaw – Departament of Plant Genetics, Breeding and Biotechnology, Warsaw University of Life Sciences, Warsaw, Poland.
doi:10.1371/journal.pone.0028495.t001
Table 2.Characteristics of RIL mapping populations.
Population Code Size Traits segregating Reference
L3186L9 H 82 yield components [13]
heading date
grain characteristics
tissue culture response
5416Ot1-3 K 144 yield components [33]
heading date
grain characteristics
restoration of male fertility in CMS-C
a-amylase activity
preharvest sprouting
Ds26RXL10 L 103 yield components [33]
heading date
grain characteristics
a-amylase activity
preharvest sprouting
plant height
S1206S76 M 143 heading date [59]
a-amylase activity
preharvest sprouting
54162020 LM S 92 heading date [60]
plant height
restoration of male fertility in CMS-C
the crosses 541 6 OT1-3 (K) and S120 6S76 (M) [14,32].
Additionally, for the crosses K and L, low-density maps based on RILs were constructed using selected markers from the respective F2
maps [33]. No existing linkage data was available for the population 54162020 LM (S).
Genotyping
DNA extraction. Genomic DNA was extracted from around 100 mg of tissue from 2-week-old leaves using a DNeasy Plant Mini Kit (Qiagen) for populations K and L, and a GenEluteTM Plant Genomic DNA Miniprep Kit (Sigma) for populations M and S.
DArT markers. DArT genotyping of RILs was performed as described previously by Bolibok-Bra˛goszewska et al. [25]. Genomic representations of individual RILs were prepared using the complexity reduction method involving digestion with endonucleases PstI and TaqI, labeled with Cy3 or Cy5 by random priming and hybridized with the rye genotyping array 2.0, consisting of 11,520 probes and described in detail elsewhere [25]. Each slide was hybridized with two separate representations, labeled with Cy3 and Cy5, respectively. Images of microarrays were acquired using a confocal laser scanner (Tecan LS300, Gro¨dig, Salzburg, Austria). Polymorphic markers were identified and scored with dedicated software (DArTsoft version 7.3, Diversity Arrays Technology P/L, Yarralumla, Australia, http:// www.diversityarrays.com/software.html). The quality of the DArT markers was evaluated based on two parameters computed by DArTsoft: (i) the Q value (an ANOVA-based quality parameter indicating how well two clusters – present ‘‘1’’ vs. absent ‘‘0’’ – are separated in the set of genomic representations, with high Q values denoting reliable markers), and (ii) the call rate (the percentage of DNA samples with defined ‘0’ or ‘1’allele calls). Only markers with Q.80% and a call rate of at least 90% were used in subsequent analyses, i.e. mapping and the calculation of a pair-wise genetic similarity (GS) matrix for the parental lines based on Jaccard’s coefficient [34] with the help of NTSYS-pc, Version 2.1. [35]. The values of GS for each possible pair of the parental lines were visualized using Circos [36].
In the case of population H, the data set used for consensus mapping and map integration contained segregations of DArT markers that were placed on a previously published map of the cross [25].
PCR-based markers. Several types of PCR-based markers were used to genotype: (i) SSR markers were analyzed in populations K and L according to Milczarski et al. [14], while for genotyping in populations M and S the protocol described by Stojałowski et al. [18] was used, and segregations of SSRs in population H were determined in an earlier study [25]; (ii) SCAR marker assays were performed as described by Stojałowski et al. [37]; (iii) STS marker genotyping was performed using the procedure of Milczarski et al. [14]; (iv) an Inter Simple Sequence Repeat (ISSR) marker in the population M, and (v) RAPD markers in populations K, L and M were analyzed according to Masojc´ et al. [9]. Information concerning the previously published PCR-based markers used for genotyping in this study is summarized in Table S1. The sequences of all other primers are available from the authors upon request.
Marker nomenclature. DArT marker names were automatically generated by a DArT Laboratory Information Management System with the letters‘rPt’added before the clone number. For all marker types, the prefix ‘X’was included in the name, as proposed by Schlegel and Korzun [38].
Construction of individual maps
Individual genetic maps of the five rye RIL mapping populations were constructed using JoinMap 4.0 [39]. Prior to
map construction, all marker segregations were subjected to the Chi2 test using the ‘locus genotype frequencies’ feature of Join Map 4.0, and severely distorted markers, deviating from the expected segregation ratio at the probability level p,0.001 (p,0.0005 in the case of population H), were excluded from further analyses. Linkage groups were separated using the independence LOD score$3.0. PCR-based markers with known chromosomal locations (listed in Table S1) were used to assign linkage groups to chromosomes. The order of markers within linkage groups was established with the maximum likelihood (ML) mapping algorithm and the Kosambi mapping function was used to calculate the cM values. In the process of constructing maps of individual crosses, the maps of populations H, L and K were first prepared using loci from preexisting linkage maps of these crosses to act as frameworks for saturation with DArTs. Then the information from the three newly created maps was used for assigning linkage groups to chromosomes in the remaining two maps: S and M.
Consensus mapping
The segregation data and the marker orders established for individual populations using JoinMap 4.0 (input maps) were entered into the Multipoint Consensus 2.2 software package [40]. Assigning markers to linkage groups was repeated, this time using a recombination frequency threshold value of 0.2. Multilocus ordering combined with iterative re-sampling was performed for each data set to evaluate the stability of marker orders in the individual maps. For a correctly ordered map, the distance from a marker to its adjacent neighbor, then to the next neighbor, and so on, will grow monotonically, and a deviation from monotony indicates the presence of problematic markers. Unstable neigh-borhood markers were detected by the jackknife re-sampling procedure. The ‘control of monotony’ function on a hard threshold level (1.4) was used to remove problematic markers and improve the quality of the map. The general intention of the ‘control of monotony’ is to achieve maximal map stability with minimal loss of markers. Next, a consistent order (consensus order) of shared markers (i.e. markers occurring in the individual maps of at least two populations) for each linkage group was identified by the software for subsequent use in the construction of the consensus maps. In cases where two or more shared markers were co-segregating, only the first marker in such groups, named the main shared marker, was included in the consensus order. In consensus mapping, the ‘global analysis’ option was used with a heuristic algorithm ‘full frame’ for a global discrete optimization. These analyses resulted in two types of genetic map: the consensus maps of five populations and the integrated map. The consensus maps consisted of all shared markers plus unique markers (i.e. specific for an individual population), and included estimated distances between loci (in cM), which were derived from the recombination ratio distances using the Kosambi mapping function. The integrated map included shared markers and unique markers without specifying the distances between them. The consensus maps were visualized using the software MapChart [41], while the graphical presentation of the integrated map was obtained using the software Graphviz [http://www.graphviz.org].
Results
Construction of individual maps
revealed that the parental lines differed from each other to a similar extent. In pairs of the parental lines, the Jaccard’s similarity coefficient values ranged from 0.35 (S) to 0.46 (M) with an average of 0.41, while the number of segregating DArT markers in common between pairs of mapping populations ranged from 392 for H and L to 681 for K and S (Table 3). The mean value of Jaccard’s coefficient for all 36 possible genotype pairs was 0.43 and it ranged from 0.35 to 0.50 for the pair L318 and S76 (Figure 1). The number of segregations available for the construction of individual maps varied from 1689 for cross M to 2281 for cross S (Table 4), with 4403 DArT markers segregating in at least one population. Severely distorted segregation occurred in the case of 667 markers (6.9%) and these were excluded from subsequent analyses. Inspection of the linkage groups obtained using JoinMap 4.0 revealed 72 multilocus DArT markers (1.6% of markers segregating in at least one population) mapping to different chromosomes in different populations (172 segregations in total), which were then removed from the data sets. At this stage of the analyses 8303 markers were placed in linkage groups constituting
the input maps, from 1352 for population M to 1942 for population S. The remaining 561 unlinked markers were not retained for consensus mapping. The numbers of markers at subsequent stages of mapping are shown in Table 4. The excluded markers are listed in Table S3.
Consensus mapping
After assigning markers to chromosomes and control of monotony, 447 problematic markers causing neighborhood instabilities (on average 12.7 markers per chromosome per population) were identified and removed. As a consequence of removing these markers, a proportion of the remaining markers became no longer linked at the adopted threshold recombination fraction value. These markers were also excluded from subsequent analyses. The markers not assigned to any linkage group at the recombination fraction value of 0.2 constituted 3.9% of the 8303 markers entered into Multipoint Consensus 2.2 (Table 4, Table S3). In total, 7531 marker segregations were used for the construction of consensus maps. This number included 2058 shared markers, with 34 markers segregating in all 5 populations (Table 5). As a result of recalculations of the individual genetic maps, a consensus was achieved, i.e. a consistent order of markers on a given chromosome in all 5 populations. The obtained maps with the changed, consistent order of markers were highly similar to the initial maps of the individual populations. The total length of the consensus map, based on the average length of the chromosome component maps was 1593.0 cM, with an average density of 1.1 cM (Table 6). Graphical representations of the consensus map are shown in Figures 2, 3, 4, 5. Tables S4, S5, S6, S7, S8, S9, S10 contain detailed data on markers from individual chromosomes, from 1R to 7R.
Chromosome 1R. Altogether, 931 marker segregations were used to create the chromosome 1R consensus map. A total of 275 markers segregated in more than one population, 199 of these were in common for two populations, and only 3 markers (XrPt400138, XrPt505839 and XrPt506506) were mapped in all 5 populations (Table 5, Figure 2, Table S4). The highest number of markers (229) was placed on the 1R map in population S, and the lowest (146), in population M (Table 4). The average map length was 215.5 cM, with a mean distance between loci of 1.2 cM (Table 6). Markers were not evenly distributed along the chromosome, with marker clustering apparent in certain regions. Three gaps, with distances between neighboring markers larger than 20 cM, were also present (1RS, populations H, K and S).
Chromosome 2R. The number of markers placed on the 2R consensus map (Figure 2) ranged from 112 (K) to 241 (H), with the total number of segregations used for consensus mapping of this chromosome equal to 913 (Table 6). Of the 242 shared markers, 139 segregated in two populations and none was common to all 5 maps (Table 5). The lengths of the 2R maps were similar for H, K, L and M, and ranged from 210 to 226 cM. In the case of population S, the map was shorter by almost half (Table 4, Table S5), but at the same time it was the densest of the five maps. One large gap (20 to 34 cM, depending on the population) was observed in the middle of the long arm of the 2R maps of the four remaining populations. The mean distance between loci was 1.2 cM.
Chromosome 3R. In total, 1026 segregations were used for consensus mapping of chromosome 3R. This number included 254 shared markers with 10 of these segregating in all populations (Table 3, Table S6). The smallest number of markers was placed on the 3R maps of populations M (172) and L (179), and the largest (262), in population S (Table 6). The linkage map lengths exceeded 200 cM and ranged from 221.4 (S) to 259.2 (H), with the
Figure 1. Genetic similarity of the parental lines. Genetic similarity (%) for all 36 possible line pairs is indicated by the ribbon color.
doi:10.1371/journal.pone.0028495.g001
Table 3.Genetic similarity coefficients for parental lines (diagonal) and number of common markers between population pairs (above the diagonal).
H K L M S
H 0.45 445 392 472 523
K 0.38 419 417 681
L 0.40 492 474
M 0.46 543
S 0.35
exception of population M, where the map spanned 175.4 cM. The average density of the individual maps was 1.1 cM, and only in the case of the population S was the mean distance between loci below 1 cM. Gaps larger than 20 cM were observed on the long chromosome arm in four populations: K, L, M and S (Figure 3, Table S6). It was found that in spite of the consensus analysis, several markers were not mapped to corresponding locations on the component maps. Such a situation occurred when shared markers co-segregated in one population, while in another population they occupied different map positions. One example of this was marker XrPt509013, which co-localized with markers XrPt402217, XrPt347125 and XrPt347301 in the component map of population K, whereas all four markers were mapped to different locations in the H population.
Chromosome 4R. Consensus mapping of chromosome 4R involved the highest number of segregations (1563) and also the highest number of shared markers (482), with 301 and 139 markers being in common for two and three populations, respectively (Table 5). Interestingly, among this large number of markers, only one (XrPt506073) segregated in all populations. The number of markers in the component maps exceeded 300 and ranged from 307 (K) to 358 (S), with the exception of population L, where the genetic map contained 258 loci. All of the component maps spanned over 200 cM, with the H map exceeding 300 cM (Table 6). Markers were distributed very evenly and only one gap was observed, in the distal region of the long chromosome arm, in the case of population K (Figure 3, Table S7). The average
interval length (0.8 cM) was the lowest among the seven chromosomes. Similarly to chromosome 3R, there were several inconsistencies in the placement of markers on genetic maps of different populations, e.g. markers Xscsz728L950 and XrPt401071 co-localized on the S map, while in the M map they were separated by approximately 30 cM.
Chromosome 5R. The total number of segregations used for consensus mapping of chromosome 5R was 900. Of the 237 shared markers, the majority were in common for 2 or 3 populations (151 and 68, respectively) with one marker (XrPt505721) segregating in all populations (Table 5). The individual maps varied noticeably in length. The longest was that of the population H (348.7 cM), while for population M the map spanned only 127.9 cM (Table 6). The mean distance between loci was 1.2 cM and ranged from 0.8 cM (S) to 1.6 cM (H). However, the distribution of markers was not uniform. Clustering of markers and a higher number of gaps than on the other chromosomes were observed. Two large gaps (over 30 cM) were found in corresponding positions of the 5RS maps in populations H and K. Moreover, a gap in 5RS was apparent in the case of population M (Figure 4, Table S8). A discrepancy in the map location of marker XrPt349332 was observed: in population H it was placed at the end of the long arm, while in the K map it was also located on the long arm, but closer to the middle of the chromosome.
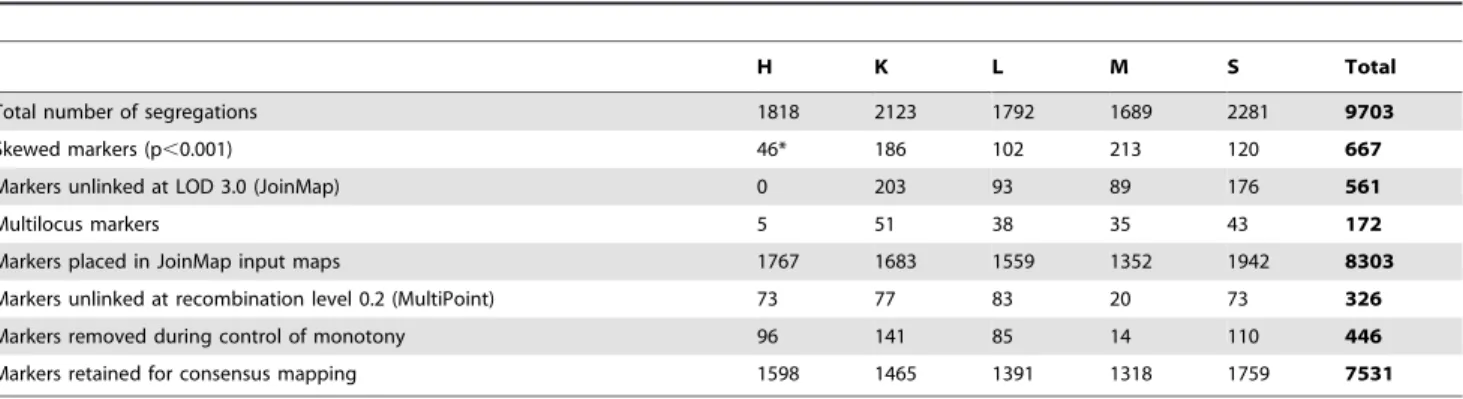
Chromosome 6R. For the construction of the 6R consensus map, 1340 marker segregations were used. Among the 318 shared Table 4.Summary of marker data at subsequent stages of mapping in individual populations.
H K L M S Total
Total number of segregations 1818 2123 1792 1689 2281 9703
Skewed markers (p,0.001) 46* 186 102 213 120 667
Markers unlinked at LOD 3.0 (JoinMap) 0 203 93 89 176 561
Multilocus markers 5 51 38 35 43 172
Markers placed in JoinMap input maps 1767 1683 1559 1352 1942 8303
Markers unlinked at recombination level 0.2 (MultiPoint) 73 77 83 20 73 326
Markers removed during control of monotony 96 141 85 14 110 446
Markers retained for consensus mapping 1598 1465 1391 1318 1759 7531
*p,0.0005.
doi:10.1371/journal.pone.0028495.t004
Table 5.Summary of mapped markers including shared and unique markers.
Chromosome
Shared markers
observed in n populations All sharedmarkers Main sharedmarkers Uniquemarkers DArTmarkers Allmarkers
n = 2 n = 3 n = 4 n = 5
1R 199 61 12 3 275 200 243 495 518
2R 139 79 24 0 242 173 247 469 489
3R 124 76 44 10 254 170 248 488 502
4R 301 139 41 1 482 291 323 788 805
5R 151 68 17 1 237 146 317 536 554
6R 162 89 51 16 318 194 408 709 726
7R 149 67 31 3 250 150 204 423 454
Total 1225 579 220 34 2058 1324 1990 3908 4048
markers (Table 5), 16 were segregating in all populations (Table S9) – the highest number observed in this study. The number of markers placed in component maps ranged from 211 (K) to 353 (S) (Table 4). The average map span was 240.2 cM (from 182.9 cM for population M to 270.1 cM for population K), with a high average map density (0.9 cM). In the case of the component maps, this value ranged from 0.7 cM (M and S) to 1.3 cM (K).The distribution of markers along the 6R maps was rather uniform. Only two gaps were observed on the short arm in the map of population K (Figure 4, Table S9).
Chromosome 7R. The 7R consensus map was built using the lowest number of segregations (858). The number of unique segregations was also the lowest (204). On the other hand, the number of shared markers was moderate (250) and included 3 markers (XrPt390749, XrPt402327, XrPt400252) in common for all populations (Table 5). Component maps contained between 129 (M) and 224 (K) markers and spanned 236.5 cM on average (from approximately 174.0 cM for populations H and M, to 302.5 cM for population K), which is comparable with the average map lengths of the other chromosomes (Table 6). Consequently, the mean distance between loci (1.4 cM) was the highest in the case of 7R. Distribution of markers along the 7R genetic maps was not uniform. Marker clusters, as well as four large (one in the 7RL maps of K and M, and two in the 7RS map of population M) and several small gaps (in the case of populations L and S) were apparent (Figure 5, Table S10).
Segregation distortion
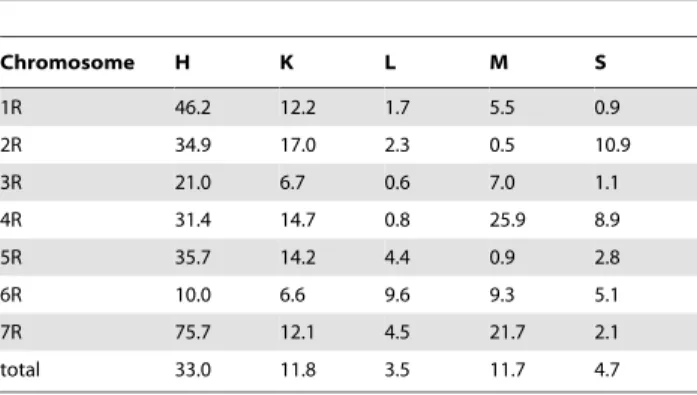
Of the 7531 segregations included in the consensus map, deviation from the expected ratio (p,0.01) was observed for 985 (13.1%). For the component maps, the proportion of distorted markers varied from 3.5% (L) to 33.0% (H), whereas for individual chromosomes these values ranged from 0.6% for 3R in population L to 75.7% for 7R in population H (Table 7). The pattern of distribution of distorted markers among individual chromosomes in the component maps was not uniform. For example, in population H, the second highest percentage of distorted markers was observed in the 1R map, whereas in population S, the percentage of skewed segregations was the lowest for 1R. Similarly, in population L, the highest percentage of distorted markers was observed for 6R, while in populations H and K, the 6R maps were characterized by the lowest percentage of skewed markers.
Markers with segregation distortion at the 1% level are indicated in Tables S4, S5, S6, S7, S8, S9, S10 by an asterisk. In general, skewed markers were not distributed evenly along the Table 6.Characteristics of component maps after consensus
analysis. Population and chromosome Number of markers used for consensus mapping Map length [cM] Mean distance between markers [cM] Chromosome 1R
H1R 173 208.7 1.2
K1R 205 282.4 1.4
L1R 178 204.9 1.2
M1R 146 182.6 1.3
S1R 229 198.9 0.9
Mean 215.5 1.2
Chromosome 2R
H2R 241 221.6 0.9
K2R 112 210.2 1.9
L2R 216 226.1 1.1
M2R 188 218.8 1.2
S2R 156 122.7 0.8
Mean 199.9 1.2
Chromosome 3R
H3R 219 259.2 1.2
K3R 194 238.1 1.2
L3R 179 232.0 1.3
M3R 172 175.4 1.0
S3R 262 221.4 0.9
Mean 225.2 1.1
Chromosome 4R
H4R 331 307.7 0.9
K4R 307 275.4 0.9
L4R 258 216.8 0.8
M4R 309 216.6 0.7
S4R 358 240.7 0.7
Mean 251.4 0.8
Chromosome 5R
H5R 224 348.7 1.6
K5R 212 296.7 1.4
L5R 135 181.2 1.3
M5R 117 127.9 1.1
S5R 212 167.2 0.8
Mean 224.3 1.2
Chromosome 6R
H6R 270 264.2 1.0
K6R 211 270.1 1.3
L6R 249 250.4 1.0
M6R 257 182.9 0.7
S6R 353 233.5 0.7
Mean 240.2 0.9
Chromosome 7R
H7R 140 173.9 1.2
K7R 224 302.5 1.4
L7R 176 281.4 1.6
Population and chromosome Number of markers used for consensus mapping Map length [cM] Mean distance between markers [cM]
M7R 129 250.5 1.9
S7R 189 174.0 0.9
Mean 236.5 1.4
chromosome length; on the contrary, chromosome regions with a high number of distorted markers were easily recognized.
Integrated map
The integrated map based on data from five component maps consisted of 4048 markers, with the number of markers per chromosome varying from 454 for 7R to 805 for 4R. Unique markers, which segregated in a single population, constituted almost half of the mapped loci (1990), with the number per chromosome ranging from 204 (7R) to 408 (6R). The integrated map comprised 2058 markers (the main shared markers) segregating in more than one population, which corresponded to 1324 unique map locations. Their number varied from 146 for chromosome 5R to 291 for chromosome 4R. Graphical representations of the integrated maps for the individual chromosomes are shown in Figures S1, S2, S3, S4, S5, S6, S7, where the main shared markers and the unique markers are shown in brown and gray, respectively. Lists of all shared and unique markers located on the integrated maps of individual chromo-somes are given in Tables S4, S5, S6, S7, S8, S9, S10.
Comparisons of the component maps and the integrated map (marker number and map lengths)
A comparison of the number of markers placed on individual chromosomes and the chromosome map lengths (Figure 6, Table 8) showed that, while marker numbers were moderately or even highly correlated for the majority of the population pairs, with correlation coefficient values of above 0.7 (and even reaching up to 0.94 for the population pair L and M), there were also cases
of very poor correlation (e.g. population pair K and L, with a correlation coefficient value of 0.27). Map lengths were generally not correlated between populations, with the exception of populations L and M, where the correlation coefficient value was 0.63. Similarly, a lack of correlation (correlation coefficient of 0.37) was observed between the total number of markers placed on the individual chromosomes of the integrated map constructed in this study and the physical rye chromosome lengths reported by Schlegel et al. [42].
Discussion
The basic prerequisites for linkage map construction are (i) a suitable mapping population, (ii) a technology generating a sufficient number of markers, and (iii) powerful mapping software.
Mapping populations
So far, rye linkage maps have been predominantly constructed based on F2populations [3,5,7–9,11,14,32], with the exceptions
of, e.g. the maps created by Bolibok-Bragoszewska et al. [25], and Hackauf et al. [15], where RILs and a BC1population were used,
respectively.
Self-incompatibility and severe inbreeding depression, com-bined with the lack of an efficient methodology for DH production, have hampered the development of mapping populations in rye. In the present study, RIL mapping populations were utilized. Due to the high level of homozygosity in these populations, they may be propagated, thus offering the possibility of repeated sampling in different vegetation periods and at multiple locations. However, the number of genotypes in
Figure 2. Consensus maps of chromosomes 1R and 2R.Shared and unique markers are shown in red and black, respectively. Common loci are joined by black lines. The chromosomes are oriented with the short arm at the top. The ruler shows the distance in centimorgans (cM) from the top of each chromosome. The approximate centromere locations are shown in blue.
individual populations was slightly lower than theoretically required to achieve precise mapping which is about 200 individuals [43]. It is known that the use of a population with an insufficient number of genotypes results in incorrect ordering of loci and fragmentation of the linkage groups [43]. On the other hand, the crucial advantage of using RILs lies in the multiple rounds of meiosis that occur before homozygosity is achieved, which gives a greater probability of recombination between closely linked genes and increases the power of testing differences between genotypic classes [44,45].
The low values of genetic similarity coefficients observed for parental pairs and all possible pairs of lines used in this study demonstrated that they represent a large part of rye genomic diversity. This confirms that the choice of populations was appropriate and provides a high probability of finding polymor-phic markers for any given chromosome region. As a result, the integrated map has good genome coverage. Clear differences in the genome structure of the individual populations, that are beneficial for the construction of an integrated map, were revealed by the values of the correlation coefficients obtained for the number of markers per chromosome and chromosome map lengths, and especially by the lack of correlation for the chromosome map lengths. On the other hand, some common genetic basis between populations is necessary for effective bridging of component maps [28], which is based on markers co-segregating in more than one population. From this point of
view, the inclusion of two populations with a common parent (K and S) facilitated consensus mapping. This is demonstrated by the fact that the highest number of common DArT markers was observed for this population pair (Table 3).
Marker choice
DArT markers that detect polymorphisms mainly due to single base-pair changes (SNPs) at restriction enzyme recognition sites, were the predominant marker type used for map construction in this study. SNP polymorphisms account for ,90% of genetic
variation in any organism and are uniformly distributed throughout a genome [22]. The frequency of SNPs in the rye transcriptome is estimated to be 1 SNP per 52–58 bp [46–47]. However, due to the dearth of sequence information available for rye, SNP-specific detection assays were limited to 12 Cleaved Amplified Polymorphic Sequence (CAPS) markers [46].
A major advantage of DArT technology is the possibility of genotyping thousands of markers in a fast and cost-effective manner without relying on sequence information. Furthermore, DArT is currently the only accessible method of generating polymorphic and sequence-specific markers in sufficient numbers to enable the construction of a high-density genetic map of rye. The number of SSR markers, which have been widely applied for this purpose in, e.g. barley [48] and maize [49], is limited to,400
in rye [10,12,20,50], and other SNP genotyping platforms are still not available for this crop.
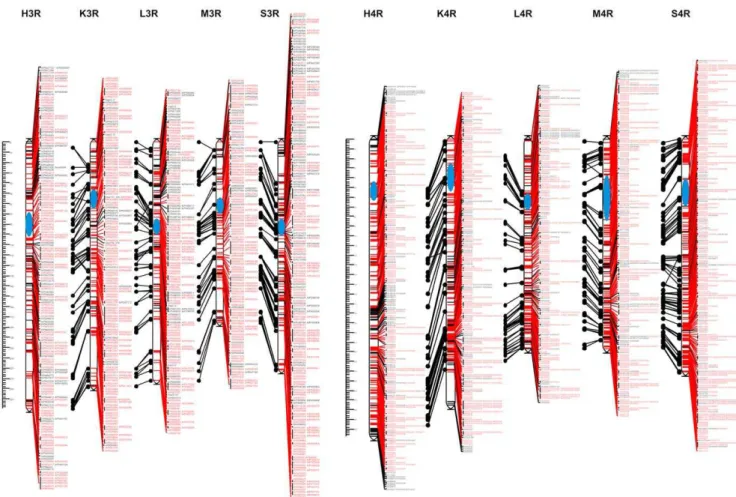
Figure 3. Consensus maps of chromosomes 3R and 4R.Shared and unique markers are shown in red and black, respectively. Common loci are joined by black lines. The chromosomes are oriented with the short arm at the top. The ruler shows the distance in centimorgans (cM) from the top of each chromosome. The approximate centromere locations are shown in blue.
The construction of a consensus map is not possible without common markers representing each chromosome. Genotyping of all populations using the same genotyping array, consisting of 11,520 clones, ensured the identification of a sufficient number of markers segregating in more than one population and facilitated the construction of maps with a consistent locus order on a given chromosome. In this study, DArT markers constituted 99.9% of shared markers, whereas only 25 PCR-based markers segregated in more than one population. However, the non-DArT markers, previously mapped in RIL population H and F2progenies of K
and L crosses [14,25], were helpful in assigning linkage groups to individual rye chromosomes and establishing chromosome arm orientation.
Mapping procedure
Consensus map construction using the Multipoint Consensus 2.2 software package relies on creating a correct order of shared markers within a linkage group. In the opinion of the program creators, the optimal locus order is of greater importance than the establishment of estimated distances between markers [40], and this is clearly visible when map construction is the starting point for map-based cloning efforts. The algorithms implemented in Multipoint Consensus 2.2 [40] were applied here to optimize the map orders during the construction of the presented maps.
To achieve a correct outcome of linkage group construction, high quality genotyping data and mapping algorithms ensuring a suitable stability of resulting map are required. The optimization of a multilocus map requires the resolution of complications originating from high sampling variation of recombination rates, missing data, scoring errors and non-monotonic changes in
recombination [40]. Solving the problems resulting from the quality of segregation data is not trivial, especially when the number of markers with significantly skewed segregations is high. In the case of the consensus map presented here, severely distorted segregations (p,0.001) were excluded from data sets. An exception in terms of the threshold level (p,0.0005 instead of p,0.001) was made in the case of population H, since distorted markers were not removed during the construction of the previously published map of this cross: the first DArT-based map of rye [25]. Moreover, the level of segregation distortion was generally higher in this population than in the four other populations utilized in this study (Table 7) [25]. Nevertheless, the excluded skewed markers constituted of only about 7% of the total number of markers. Similar to the present study, severely distorted markers (p,0.001) were excluded prior to linkage analyses in triticale by Alheit et al. [28].
Further problems may be caused by markers interfering with map stability by deviation from the expected increase in recombination rates between a marker and its immediate neighbors. To identify such markers, the ‘control of monotony’ function was used. In the present study, these markers constituted only a small fraction of the data set and were excluded from subsequent analyses.
Locus order and marker distribution
In most cases, the positions of non-DArT anchor markers on the consensus map were in good agreement with their locations on the respective source maps (F2or RIL). The order of shared markers
was also generally consistent between component maps. Minor inconsistencies in map positions were restricted to the same
Figure 4. Consensus maps of chromosomes 5R and 6R.Shared and unique markers are shown in red and black, respectively. Common loci are joined by black lines. The chromosomes are oriented with the short arm at the top. The ruler shows the distance in centimorgans (cM) from the top of each chromosome. The approximate centromere locations are shown in blue. For 5R the centromere locations are not shown due to lack of indicative markers.
chromosome arms. Situations where a marker was mapped to different chromosome arms in separate component maps were very rare. Minor discrepancies in marker locations are not unusual in consensus maps [28,51–52], and were also observed in the previously published consensus map of rye [19]. Such discrepan-cies could reflect real differences in genome organization, but they may also be caused by a dependency of the estimated gene orders on sample size or by differences in local recombination frequencies between populations [28,51].
Seventy-two DArT markers (1.8%) were found on multiple chromosomes of different populations. Because DArT is a hybridization-based assay, these markers effectively identify multiple genomic regions sharing sequence homology and the polymorphic region can be different in separate crosses [21]. Multicopy DArT markers were observed with a similar frequency
in triticale [28], sorghum [51] and barley [52] (1.8%, 1.4% and 1.8%, respectively).
Despite utilizing several methods of map optimization, regions containing recombination gaps were observed in the constructed map, mostly in the distal regions of the chromosomes. The locations of recombination gaps were remarkably similar in the separate populations for all chromosomes except 4R. The previously published rye consensus map [19], based on five F2
populations, which included 501 loci of various types (e.g. RFLP, RAPD, SSR), also contained recombination gaps in the terminal parts of chromosomes 1RS, 1RL, 3RS, 4RL, 5RL and 6RS. In general, the occurrence of recombination gaps is a common feature of all available rye maps, including the densest published so far, an AFLP-based map produced by Bednarek et al. [11], and the DArT-based map of Bolibok-Bra˛goszewska et al. [25].
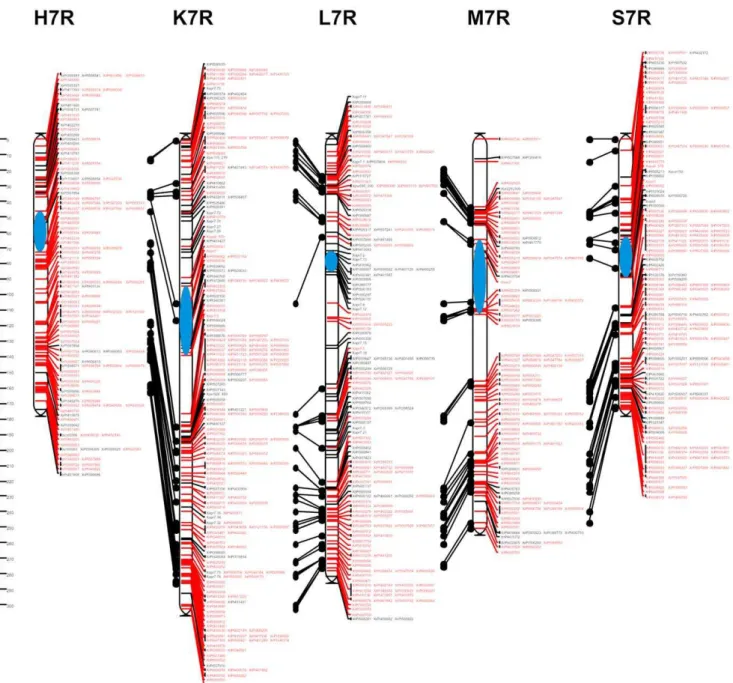
Figure 5. Consensus map of chromosome 7R.Shared and unique markers are shown in red and black, respectively. Common loci are joined by black lines. The chromosome is oriented with the short arm at the top. The ruler shows the distance in centimorgans (cM) from the top of each chromosome. The approximate centromere locations are shown in blue.
Unfortunately, the precise comparison of gap locations in different rye populations is not possible in many cases due to the low number of common markers. The existence of recombination gaps in similar locations in the component rye maps presented here could be the result of DArT marker limitations in detecting polymorphism in certain genome regions. However, at least some of the gaps (e.g. those present on the short arm of 1R and 6R) are located in the same regions as gaps identified in the consensus map of Gustafson et al. [19], which was constructed using other types of markers. This suggests that rather than indicating a DArT-specific limitation, these gaps are actually conserved in the rye genome and reflect regions with a higher than average frequency of recombination (recombination hot spots). Alternatively, these recombination gaps may represent genome fractions with similar ancestry, as proposed by Mace et al. [51] and van Os et al. [53], Table 7.Percentage of distorted markers (p,0.01) in
component maps.
Chromosome H K L M S
1R 46.2 12.2 1.7 5.5 0.9
2R 34.9 17.0 2.3 0.5 10.9
3R 21.0 6.7 0.6 7.0 1.1
4R 31.4 14.7 0.8 25.9 8.9
5R 35.7 14.2 4.4 0.9 2.8
6R 10.0 6.6 9.6 9.3 5.1
7R 75.7 12.1 4.5 21.7 2.1
total 33.0 11.8 3.5 11.7 4.7
doi:10.1371/journal.pone.0028495.t007
Figure 6. Comparisons of the component maps.A. Marker number per chromosome in individual populations. B. Chromosome map lengths in individual populations.
who observed large recombination gaps in a consensus map of sorghum and an ultra-dense map of potato, respectively.
Segregation distortion
Segregation distortion is a common phenomenon in rye [5,7– 8,15–17] and other plants such as triticale [27–28], maize [49], sorghum [51] and potato [53]. Because different stringency levels were applied for the removal of severely distorted markers prior to linkage mapping in this study (for the reasons outlined above), it is not possible to directly compare the proportion of skewed markers present in the component maps between population H and the other 4 populations. Nevertheless, it was noticeable that individual chromosomes within a component map varied in the proportion of distorted markers they contain (e.g. from 0.5% for 2R to 25.9% for 4R in the case of the component maps for population M). Moreover, the chromosomes with the highest or the lowest percentage of distorted markers were different in the separate populations. Large differences in the percentage of distorted markers present on individual chromosomes (from 0 to 100%) were also observed in triticale by Alheit et al.[28], who attributed this to the different ways of producing the individual mapping populations used in their study (five DH populations and one F2
population). All the populations employed in the present study were RILs and all the component maps were produced using the same methods and mostly with the same marker type. Therefore, the differences in the distribution of distorted markers may be attributed to (i) the different allelic composition of the parents of the individual component populations in the respective chromo-somal regions, i.e. alleles with a more or less equal influence on survival rate in both parents vs. alleles with a stronger negative or positive influence on the survival rate in one of the parents, and (ii) to differences in the number of individuals between the separate mapping populations. The latter explanation is especially relevant for population H, which was the smallest population used in this study and, hence, the most likely to be characterized by a non-random representation of alleles.
Integrated map
The integrated rye map reported here, containing 4048 loci (3908 DArTs), represents the largest collection of molecular markers currently available for rye genome analyses. Due to the use of multiple mapping populations, a more than two-fold increase in the number of genetically mapped markers was achieved in comparison with the first DArT-based map of rye
[25]. Moreover, in comparison with the previously published rye consensus map [19], our integrated rye map comprises 8-times more loci. In the present study, we employed sequence-specific, transferable DArT markers, assayed in a largely automated manner using a microarray-based technology and that were easily accessible through a genotyping service. Therefore, the presented map constitutes a valuable resource for rye and triticale geneticists and breeders, and is a significant step forward for rye genomics.
One interesting feature of the constructed integrated map is the lack of correlation between the number of markers and the physical length of the rye chromosomes. This phenomenon is consistent with the strategy used to generate rye DArT markers. The genome complexity reduction method used for the develop-ment of the rye genotyping panel and for the genotyping assay, involved digestion with the restriction endonuclease PstI. This enzyme is CpNpG methylation-sensitive and therefore is often used to target single- and low-copy DNA/transcriptionally or biologically active euchromatic DNA, since most repetitive sequences are completely methylated at this site [54–55]. Such an approach is especially well suited for analyzing the rye genome because of its very high proportion of repetitive sequences: 92% [20]. Previously,PstI was used in rye research to create single- and low-copy genomic DNA libraries for the development of SSR markers [50]. In cucumber, a higher correlation was observed between the number of markers and euchromatic chromosome length than between marker number and pachytene chromosome length for a map constructed with SSR markers derived from non-repetitive genome sequences [56]. Unfortunately, to our knowl-edge, there are no published reports describing euchromatic chromosome length in rye. Nevertheless, cytogenetic observations have shown that euchromatin is not proportionally distributed among the chromosomes of rye, as four (1R, 2R, 3R and 7R) have large blocks of heterochromatin at the telomeres of both arms, while the remaining three chromosomes (4R, 5R, 6R) have heterochromatic blocks at the telomeres of the short arms. In addition, blocks of interstitial heterochromatin are present on every chromosome [44,57].
Potential applications
The presented maps are suitable for exploitation in a range of genomic, biotechnological and breeding applications. The very high density map may serve as a reference in rye linkage mapping, facilitating the construction of genetic maps for newly developed populations. The map could also accelerate association mapping in rye by facilitating the estimation of linkage disequilibrium, as well as the detection of QTLs via traditional interval mapping. The high map saturation will be highly advantageous during BAC clone anchoring based on the use of DArT arrays, as described for wheat by Paux et al. [58]. Our results are also likely to accelerate research on triticale, an intergeneric hybrid between wheat and rye. The usefulness of DArT-based rye genomic resources for analyses of this crop was recently demonstrated by Badea et al. [26], Tyrka et al. [27] and Alheit et al. [28]. The unique value of the presented integrated map would significantly increase once the sequencing of DArT clones from the rye genotyping panel is completed [http://www.diversityarrays.com/faq.html#n67]. Nevertheless, in situ hybridization experiments involving mapped DArT clones are advisable in order to align certain map features with the physical organization of rye chromosomes.
Conclusion
A highly saturated integrated map of rye containing over 4000 loci and a consensus map with a highly consistent locus order, constructed using a suitable marker type, mapping populations Table 8.Correlation coefficient values for marker number per
chromosome (upper values) and chromosome map length (lower values) of the component maps.
K L M S
H 0.37 *0.72 ***0.87 *0.71
0.35 20.53 **20.77 0.22
K 0.27 0.47 *0.70
0.35 20.09 0.10
L ***0.94 *0.67
0.63 20.01
M **0.82
20.09
and a software package implementing powerful algorithms for map order optimization, represent valuable resources for rye and triticale genomics and breeding, and are an excellent starting point for more in-depth studies on rye genome organization.
Supporting Information
Figure S1 Integrated linkage map of rye chromosome 1R. The main shared and unique markers are shown in brown and gray, respectively.
(TIF)
Figure S2 Integrated linkage map of rye chromosome 2R. The main shared and unique markers are shown in brown and gray, respectively.
(TIF)
Figure S3 Integrated linkage map of rye chromosome 3R. The main shared and unique markers are shown in brown and gray, respectively.
(TIF)
Figure S4 Integrated linkage map of rye chromosome 4R. The main shared and unique markers are shown in brown and gray, respectively.
(TIF)
Figure S5 Integrated linkage map of rye chromosome 5R. The main shared and unique markers are shown in brown and gray, respectively.
(TIF)
Figure S6 Integrated linkage map of rye chromosome 6R. The main shared and unique markers are shown in brown and gray, respectively.
(TIF)
Figure S7 Integrated linkage map of rye chromosome 7R. The main shared and unique markers are shown in brown and gray, respectively.
(TIF)
Table S1 List of PCR-based markers used for genotyp-ing.
(XLS)
Table S2 DArT marker segregations for five RIL populations
(XLS)
Table S3 Lists of markers excluded during map construction.
(XLS)
Table S4 Consensus map of chromosome 1R and orders of shared and unique markers within the 1R integrated map.
(XLS)
Table S5 Consensus map of chromosome 2R and orders of shared and unique markers within the 2R integrated map.
(XLS)
Table S6 Consensus map of chromosome 3R and orders of shared and unique markers within the 3R integrated map.
(XLS)
Table S7 Consensus map of chromosome 4R and orders of shared and unique markers within the 4R integrated map.
(XLS)
Table S8 Consensus map of chromosome 5R and orders of shared and unique markers within the 5R integrated map.
(XLS)
Table S9 Consensus map of chromosome 6R and orders of shared and unique markers within the 6R integrated map.
(XLS)
Table S10 Consensus map of chromosome 7R and orders of shared and unique markers within the 7R integrated map.
(XLS)
Acknowledgments
We are grateful to Prof A.J. Łukaszewski (University of California, Riverside, USA) for valuable comments and suggestions and to Dr. Eric Huttner (Diversity Arrays Technology P/L) for critical reading of the manuscript. We also thank Diversity Arrays Technology P/L team members for their friendly support during the execution of this project.
Author Contributions
Conceived and designed the experiments: MR-T AK. Performed the experiments: HB-B KH-U PM BM SS MG. Analyzed the data: PM HB-B BM SS KH-U GU AK MR-T. Contributed reagents/materials/analysis tools: AK PM GU HB-B BM SS PB MR-T. Wrote the paper: HB-B PM.
References
1. Madej LJ (1996) Worldwide trends in rye growing and breeding. Vortr Pflanzenzu¨cht 35: 1–6.
2. Baum M, Appels R (1991) The cytogenetic and molecular architecture of chromosome 1R-one of the most widely utilized sources of alien chromatin in wheat varieties. Chromosoma 101: 1–10.
3. Devos KM, Atkinson MD, Chinoy CN, Francis HA, Harcourt RL, et al. (1993) Chromosomal rearrangements in the rye genome relative to that of wheat. Theor Appl Genet 85: 673–680.
4. Philipp U, Wehling P, Wricke G (1994) A linkage map of rye. Theor Appl Genet 88: 243–248.
5. Senft P, Wricke G (1996) An extended genetic map of rye (Secale cerealeL.). Plant Breed 115: 508–510.
6. Loarce Y, Hueros G, Ferrer E (1996) A molecular linkage map of rye. Theor Appl Genet 93: 1112–1118.
7. Korzun V, Malyshev S, Voylokov AV, Bo¨rner A (2001) A genetic map of rye (Secale cerealeL.) combining RFLP, isozyme, protein, microsatellite and gene loci. Theor Appl Genet 102: 709–717.
8. Ma XF, Wanous MK, Houchins K, Rodriguez Milla MA, Goicoechea PG, et al. (2001) Molecular linkage mapping in rye (Secale cerealeL). Theor Appl Genet 102: 517–523.
9. Masojc´ P, Mys´ko´w B, Milczarski P (2001) Extending a RFLP-based genetic map of rye using random amplified polymorphic DNA (RAPD) and isozyme markers. Theor Appl Genet 102: 1273–1279.
10. Hackauf B, Wehling P (2002) Identification of microsatellite polymorphism in an expressed portion of the rye genome. Plant Breed 121: 17–25.
11. Bednarek PT, Masojc´ P, Lewandowska R, Mys´ko´w B (2003) Saturating rye genomic map with amplified fragment length polymorphism (AFLP) and random amplified polymorphic DNA (RAPD) markers. J Appl Genet 44: 21–33. 12. Khlestkina EK, Than MHM, Pestsova EG, Ro¨der MS, Malyshev SV, et al. (2004) Mapping of 99 new microsatellite-derived loci in rye (Secale cerealeL.) including 39 expressed sequence tags. Theor Appl Genet 109: 725–732. 13. Bolibok H, Gruszczyn´ska A, Hromada-Judycka A, Rakoczy-Trojanowska M
14. Milczarski P, Banek-Tabor A, Lebiecka K, Stojałowski S, Mys´ko´w B, et al. (2007) New genetic map of rye composed of PCR-based molecular markers and its alignment with the reference map of the DS2 x RXL10 intercross. J Appl Genet 48: 11–24.
15. Hackauf B, Rudd S, van der Voort JR, Miedaner T, Wehling P (2009) Comparative mapping of DNA sequences in rye (Secale cerealeL.) in relation to the rice genome. Theor Appl Genet 118: 371–384.
16. Tenhola-Roininen T, Kalendar R, Schulman AH, Tanhuanpa¨a¨ P (2011) A doubled haploid rye linkage map with a QTL affectinga-amylase activity. J Appl Genet 52: 299–304.
17. Bo¨rner A, Korzun V (1998) A consensus linkage map of rye (Secale cerealeL.) including 374 RFLPs, 24 isozymes and 15 gene loci. Theor Appl Genet 97: 1279–1288.
18. Stojałowski S, Mysko´w B, Milczarski P, Masojc´ P (2009) A consensus map of chromosome 6R in rye (Secale cerealeL.). Cell Mol Biol Lett 14: 190–198. 19. Gustafson JP, Ma X-F, Korzun V, Snape JW (2009) A consensus map of rye
integrating mapping data from five mapping populations. Theor Appl Genet 118: 793–800.
20. Bartosˇ J, Paux E, Kofler E, Havra´nkova´ M, Kopecky´ D, et al. (2008) A first survey of the rye (Secale cereale) genome composition through BAC end sequencing of the short arm of chromosme 1R. BMC Plant Biology 8: 95. 21. Jaccoud D, Peng K, Feinstein D, Kilian A (2001) Diversity arrays: a solid state
technology for sequence independent genotyping. Nucleic Acids Res 29: e25. 22. Gupta PK, Rustgi S, Mir RR (2008) Array-based high-throughput DNA
markers for crop improvement. Heredity 101: 5–18.
23. Akbari M, Wenzl P, Caig V, Carling J, Xia L, et al. (2006) Diversity arrays technology (DArT) for high-throughput profiling of the hexaploid wheat genome. Theor Appl Genet 113: 1409–1420.
24. Wenzl P, Carling J, Kudrna D, Jaccoud D, Huttner E, et al. (2004) Diversity arrays technology (DArT) for whole-genome profiling of barley. Proc Natl Acad Sci USA 101: 9915–9920.
25. Bolibok-Bra˛goszewska H, Heller-Uszyn´ska K, Wenzl P, Uszyn´ski G, Kilian A, et al. (2009) DArT markers for the rye genome - genetic diversity and mapping. BMC Genomics 10: 578.
26. Badea A, Eudes F, Salmon D, Tuvesson S, Vrolijk A, et al. (2011) Development and assessment of DArT markers in triticale. Theor Appl Genet 122: 1547–1560.
27. Tyrka M, Bednarek PT, Kilian A, We˛dzony M, Hura T, et al. (2011) Genetic map of triticale compiling DArT, SSR, and AFLP markers. Genome 54: 391–401.
28. Alheit KV, Reif JC, Maurer HP, Hahn V, Weissmann EA, et al. (2011) Detection of segregation distortion loci in triticale (x Triticosecale Wittmack) based on a high-density DArT marker consensus genetic linkage map. BMC Genomics 12: 380.
29. Mys´ko´w B, Masojc´ P, Banek-Tabor A, Szołkowski A (2001) Genetic diversity of inbred rye lines evaluated by RAPD analysis. J Appl Genet 42: 1–14. 30. Bolibok H, Rakoczy-Trojanowska M, Hromada A, Pietrzykowski R (2005)
Efficiency of different PCR-based marker systems in assessing genetic diversity among winter rye (Secale cerealeL.) inbred lines. Euphytica 146: 109–116. 31. Bolibok-Bra˛goszewska H, Zabierzewska N, Hromada-Judycka A, Krzewska L
(2011) SSAP markers based on a novelTy1-copialike element are a powerful tool for the assessment of genetic diversity in rye (Secale cerealeL.) inbred lines. Cereal Res Comm. In press.
32. Milczarski P (2010) Identification and comparative mapping of QTLs controlling selected quantitative traits in two mapping populations of rye (Secale cerealeL). (in polish). Szczecin: West-Pomeranian University of Technology in Szczecin. 86 p.
33. Mys´ko´w B, Stojałowski S, Milczarski P, Masojc´ P (2010) Mapping of sequence-specific markers and loci controlling preharvest sprouting and alpha-amylase activity in rye (Secale cerealeL.) on the genetic map of an F2 (S120 x S76) population. J Appl Genet 51: 283–287.
34. Jaccard P (1908) Nouvelles recherches sur la distribution florale. Bull Soc Vaudoise Sc Nat 44: 223–270.
35. Rohlf FJ (2000) NTSYS-pc: numerical taxonomy and multivariate system. Version 2.1. Exeter Software: Setauket, NY.
36. Krzywinski M, Schein J, Birol I, Connors J, Gascoyne R, et al. (2009) Circos: an information aesthetic for comparative genomics. Genome Res 19: 1639–1645. 37. Stojałowski S, Jaciubek M, Masojc´ P (2005) Rye SCAR markers for male fertility
restoration in the P cytoplasm are also applicable to marker-assisted selection in the C cytoplasm. J Appl Genet 26: 371–373.
38. Schlegel R, Korzun V (2008) Genes, markers and linkage data of rye (Secale cerealeL.), 7th updated inventory, http://www.rye-gene-map.de/.
39. Van Ooijen JW (2006) JoinMapH4, Software for the calculation of genetic linkage maps in experimental populations. Kyazma B.V. Wageningen, Nether-lands.
40. Korol A, Mester D, Frenkel Z, Ronin Y (2009) Methods for genetic analysis in the Triticeae. In: Feuillet C, Muehlbauer GJ, eds. Genetics and genomics of the
Triticeae. New York: Springer Science+Business Media. pp 163–199. 41. Voorrips RE (2002) MapChart: Software for the graphical presentation of
linkage maps and QTLs. J Hered 93: 77–78.
42. Schlegel R, Melz G, Nestrowicz R (1987) A universal reference karyotype in rye
Secale cerealeL Theor Appl Genet 74: 820–826.
43. Ferreira A, da Silva MF, da Costa e Silva L, Cruz CD (2006) Estimating the effects of population size and type on the accuracy of genetic maps. Genet Mol Biol 29: 187–192.
44. Schiantarelli E, De la Pena A, Candela M (2001) Use of recombinant inbred lines (RILs) to identify, locate and map major genes and quantitative trait loci involved within vitroregeneration ability inArabidopsis thaliana. Theor Appl Genet 102: 335–341.
45. Xu Y (2010) Populations in genetics and breeding. In: Xu Y, ed. Molecular plant breeeding CABI. pp 113–150.
46. Varshney RK, Beier U, Khlestkina EK, Kota R, Korzun V, et al. (2007) Single nucleotide polymorphisms in rye (Secale cereale L.): discovery, frequency, and applications for genome mapping and diversity studies. Theor Appl Genet 114: 1105–1116.
47. Li Y, Haseneyer G, Scho¨n CC, Ankerst D, Korzun V, et al. (2011) High levels of nucleotide diversity and fast decline of linkage disequilibrium in rye (Secale cereale
L.) genes involved in frost response. BMC Plant Biology 11: 6.
48. Varshney RK, Marcel TC, Ramsay L, Russell J, Ro¨der MS, et al. (2007) A high density barley microsatellite consensus map with 775 SSR loci. Theor Appl Genet 114: 1091–1103.
49. Sharopova N, McMullen MD, Schultz L, Schroeder S, Sanchez-Villeda H, et al. (2002) Development and mapping of SSR markers for maize. Plant Mol Biol 48: 463–481.
50. Saal B, Wricke G (1999) Development of simple sequence repeat markers in rye (Secale cerealeL.). Genome 42: 964–972.
51. Mace ES, Rami J-F, Bouchet S, Klein P, Klein RR, et al. (2009) A consensus genetic map of sorghum that integrates multiple component maps and high-throughput Diversity Array Technology (DArT) markers. BMC Plant Biology 9: 13.
52. Wenzl P, Haobing L, Carling J, Zhou M, Raman H, et al. (2006) A high-density consensus map of barley linking DArT markers to SSR, RFLP and STS loci and agriculture traits. BMC Genomics 7: 206.
53. van Os H, Andrzejewski S, Bakker E, Barrena I, Bryan GJ, et al. (2006) Construction of a 10,000-marker ultradense genetic recombination map of potato: providing a framework for accelerated gene isolation and a genomewide physical map. Genetics 173: 1075–1087.
54. Isidore E, van Os H, Andrzejewski S, Bakker J, Barrena I, et al. (2003) Toward a marker-dense meiotic map of the potato genome: lessons from linkage group I Genetics 165: 2107–2116.
55. Areshchenkova T, Ganal MW (2002) Comparative analysis of polymorphism and chromosomal location of tomato microsatellite markers isolated from different sources. Theor Appl Genet 104: 229–235.
56. Ren Y, Zhang Z, Liu J, Staub JE, Han Y, et al. (2009) An integrated genetic and cytogenetic map of the cucumber genome. PLoS One 4(6): e5795.
57. Lukaszewski AJ, Wozna J, Apolinarska B, Naganowska B (1982) The DNA content of the individual chromosomes of rye. Theor Appl Genet 62: 145–148. 58. Paux E, Sourdille P, Salse J, Saintenac C, Choulet F, et al. (2008) A physical map of the 1-gigabase bread wheat chromosome 3B. Science 322: 101–104. 59. Mys´ko´w B, Stojałowski S, Łan´ A, Bolibok-Bra˛goszewska H,
Rakoczy-Trojanowska M, et al. (2011) Detection of QTL fora-amylase activity on high-density genetic map of rye and comparing their localization to loci controlling preharvest sprouting and earliness. Mol BreedDOI 10.1007/s11032-011-9627-1.