Proceedings
ISBN 978-989-8780-07-2
25
th
APDR Congress
26
th
APDR Congress
ISBN 978-989-8780-07-2
Welcome to the 26
th
APDR Congress, July 4-5, 2019, Aveiro
APDR and the Local Organising Committee wish you a pleasant and inspiring
participation!
Table of Contents
TABLE OF CONTENTS ... 1
PROGRAMME OVERVIEW ... 2
OVERVIEW PARALLEL SESSIONS ... 3
THEMES ... 4
Umbrella Theme ... 4
General Themes ... 4
Special Sessions’ Themes ... 5
COMMITTEES ... 6
ORGANIZATION ... 6
CONGRESS VENUE ... 7
How to arrive at the University of Aveiro ... 7
DAY BY DAY PROGRAMME ... 8
Wednesday, 3 July 2019 ...9
Thursday, 4 July 2019 ... 10
Friday, 5 July 2019 ... 18
ABSTRACTS AND PAPERS ... 24
Parallel Sessions (1) ... 25
Parallel Sessions (2) ... 98
Parallel Sessions (3) ... 416
Parallel Sessions (4) ... 748
26
th
APDR Congress
ISBN 978-989-8780-07-2
1071
01195 - SOIL EROSION CHANGES IN PORTUGAL THROUGH THE
SEDIMENT DELIVERY RATIO MODEL
Susana M. Marques
1, João C. David
2, Felipe S. Campos
3, Pedro Cabral
41 Nova Information Management School (Nova IMS), Universidade Nova de Lisboa, Campus de Campolide, 1070-312 Lisboa, Portugal, [email protected]
2 Nova Information Management School (Nova IMS), Universidade Nova de Lisboa, Campus de Campolide, 1070-312 Lisboa, Portugal, [email protected]
3 Nova Information Management School (Nova IMS), Universidade Nova de Lisboa, Campus de Campolide, 1070-312 Lisboa, Portugal, [email protected]
4 Nova Information Management School (Nova IMS), Universidade Nova de Lisboa, Campus de Campolide, 1070-312 Lisboa, Portugal, [email protected]
Abstract. Soils provide relevant ecosystem functions, important to the preservation of mankind. However, soil
degradation, and particularly soil erosion, is endangering the maintenance and existence of these services. This study aims to analyze the spatiotemporal distribution of soil erosion by understanding the spatial patterns of the sediment retention in mainland Portugal with the support of Corine Land Cover maps from 1990 to 2018. Results highlight the sediment retention levels across administrative boundaries, showing which districts are more susceptible to soil erosion processes. Results further indicate that Coimbra, Leiria and Braga, are facing high levels of potential soil erosion. These findings can be useful to support strategies for more efficient landscape planning regarding soil erosion negative consequences mitigation.
Keywords. Sediment delivery ratio, USLE, Corine Land Cover, soil erosion, sediment retention
1. INTRODUCTION
Soils perform a range of key ecosystem functions, including the preservation of past human activities, the production of food, the storage of organic matter, water and nutrients, or the provision of a habitat for a huge variety of organisms (Webster, 2005). Any degradation in the quality of the soil resource through erosion can have an impact on the ability of soils to perform this range of functions (Webster, 2005). Soil erosion is the most widespread form of soil degradation worldwide (Panagos et al., 2014). In fact, soil erosion by water has become one of the greatest global threats to the environment (Navarro-Hevia et al., 2016). As a result, soil condition, water quality, species habitats and the provision of ecosystem services are negatively affected, and their preservation may be compromise (Teng et al., 2018). Hence, it is necessary to quantify the impacts of soil erosion by water and to develop effective measures for soil and water conservation (Teng et al., 2018).
Due to the difficulty to measure soil erosion at large geographical scales, soil erosion models are suitable tools for regional and national estimations (Panagos et al., 2014). Additionally, the high heterogeneity of soil erosion causal factors combined with often poor data availability is an obstacle for the application of complex soil erosion models (Panagos et al., 2014).
Many studies have been made for Portuguese regions for soil erosion due to several factors, for example (Nunes, et. al., 2010) studied the effect of land abandonment, near the River Côa, in soil erosion and land degradation; (Figueiredo da Silva, et. al., 2009) studied nutrient retention in sediments and vegetation in Ria de Aveiro; (Martins, et. al., 2019), more recently, studied the effects of gully erosion in steep regions in the northern territory of Portugal. Albeit these and other studies have been made, in different regions of Portugal, a study at a national scale was not found, to explain the effect of sediment retention on soil erosion in the entire territory.
This study aims to analyze the spatiotemporal distribution of soil erosion by understanding the spatial patterns of the sediment retention in mainland Portugal with Corine Land Cover between 1990 and 2018. Specifically, we aim to: (i) estimate the soil loss at pixel level, and report variations at district level, and to (ii) estimate sediment retention at pixel level, and report variations at district level. The results will provide a unique view on soil erosion and sediment retention in Portugal and may provide relevant information useful to design effective planning policies aiming to mitigate this phenomenon. The study uses a sediment delivery ratio model to determine the behaviour of sediment retention in all Portuguese territory. Although the model has some limitations, it is important to know which areas cause more concern, so that better territorial policies can be applied.
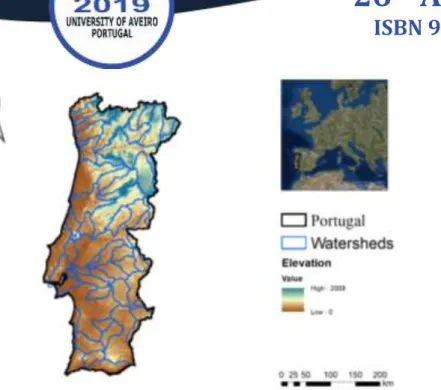
2. STUDY AREA
This study focuses on mainland Portugal (Figure 1). The country has a total area of 89102,14 km2, with 18 districts
(DGT251).
26
th
APDR Congress
ISBN 978-989-8780-07-2
Figure 1. Study area – National map, showing elevation (m) and the Portuguese hydrological basins
3. MATERIALS AND METHODS
The current soil erosion by water was estimated using InVEST 3.6.0 software, from Natural Capital Project (Sharp et al., 2018). The InVEST models are “ready-to-use” models, i.e. after the user collect and pre-process the input required data, the model runs in a simple interface and delivers the expected outputs (Sharp et al., 2018). The SDR model is based on the concept of hydrological connectivity requiring a minimal number of parameters, uses globally available data, and is spatially explicit (Sharp et al., 2018).
This SDR model uses the RUSLE252 method, where the factors are derived from different rasters provided from different
sources, in order to determine the annual soil loss (Sharp et al., 2018). The RUSLE is an extension of the original USLE253
with improvements in determining the factors controlling erosion (Renard et al., 1997; Wischmeier and Smith, 1978). This is an empirical model commonly used to estimate soil loss potential by water from hill-slopes across large areas of land, it was statistically derived from a large empirical database generated from erosion plots measured in the 1970s in the United States (Wischmeier and Smith, 1978). It estimates the annual soil loss that is due to erosion using a factor-based approach with rainfall, soil erodibility, slope length, slope steepness and cover management and conservation practices as inputs (Teng et al., 2016).
Both the USLE and the RUSLE equations are written as follows (Winchell et al., 2008) (1):
𝐴 = 𝑅 ∙ 𝐾 ∙ 𝐿 ∙ 𝑆 ∙ 𝐶 ∙ 𝑃 (1)
where A is the soil loss (t ha–1 y–1); R is the rainfall erosivity factor (MJ mm ha–1 h–1 y–1); K is the soil erodibility factor (t
ha h [ha MJ mm]–1); L is the slope length factor; S is the slope steepness factor; C is the cover management factor; and P
is the supporting practice factor, the L and S terms of the equation are often lumped together as “LS” and referred to as the topographic factor (Winchell et al., 2008).
The software used to pre-process and analyse all the geographical data was the ArcMap 10.4.1 for desktop, from ESRI (2011). All the input data had the ETRS_1989_UTM_Zone29N coordinate system.
3.1 Data
Table 1 shows the data used as input for the SDR model in InVEST.
Table 23. Data sources for the data used as inputs for the SDR InVEST model
Data Source Website
Digital Elevation Model (DEM) USGS http://earthexplorer.usgs.gov/
Rainfall Erosivity Index (R) JRC-ESDACa https://esdac.jrc.ec.europa.eu/content/global-rainfall-erosivity
Soil Erodibility (K) JRC-ESDAC https://esdac.jrc.ec.europa.eu/content/soil-erodibility-k-factor-high-resolution-dataset-europe
Land Use/Land Cover DGT http://www.dgterritorio.pt/
Pb and Cc coefficients (*)
https://esdac.jrc.ec.europa.eu/content/support-practices-factor-p-factor-eu
https://esdac.jrc.ec.europa.eu/content/cover-management-factor-c-factor-eu
Watersheds SNIGd http://snig.dgterritorio.pt/
252 Revised Universal Soil Loss Equation 253 Universal Soil Loss Equation
26
th
APDR Congress
ISBN 978-989-8780-07-2
1073
Biophysical table Created by analyst - a Joint Research Centre - European Soil Data Centre (ESDAC)b Support practice factor c Cover-management factor
d Sistema Nacional de Informação Geográfica
(*) Panagos, Borrelli, Meusburger, Alewell, et al., 2015; Panagos, Borrelli, Meusburger, Zanden, et al., 2015
Relevant parameters used in SDR include the definition of the threshold flow accumulation value which represents the number of upstream cells that must flow into a cell before it is considered part of a stream; two calibration parameters, kb and IC0, which determine the degree of connection from patches of land to the stream and percentage of soil loss that
actually reaches the stream; and the SDRmax, which is the maximum SDR that a pixel can reach, in function of the soil
texture. The default values were used, as indicated in the InVEST user guide for this model (Sharp et al., 2018).
3.1.1 Digital elevation model (DEM)
The digital elevation model (DEM) was the Advanced Spaceborne Thermal Emission and Reflection Radiometer (ASTER). This dataset has a spatial resolution of 30m. Several rasters in Geotiff format were extracted from EarthExplorer. Then, a mosaic dataset was created in ArcMap and clipped to the study area with the help of the raster geoprocessing tools in ArcGIS.
3.1.2 Rainfall Erosivity Index (R)
The rainfall erosivity index is an indicator of the ability of water to detach and transport soil particles; thus erosion is sensitive to the intensity and duration of rainfall (Teng et al., 2016). This index was provided by GloREDa, the Global Rainfall Erosivity Database, from the Joint Research Centre - European Soil Data Centre (ESDAC). GloREDa contains erosivity values estimated as R-factors from 3,625 stations distributed in 63 countries worldwide. This is the result of an extensive data collection of high temporal resolution rainfall data from the maximum possible number of countries in order to have a representative sample across different climatic and geographic gradient. It has three components: a) the Rainfall Erosivity database at European Scale (REDES); b) 1,865 stations from 23 countries outside Europe; and c) 85 stations collected from a literature review - As such, it is the most comprehensive global database including the largest possible number of stations with high temporal resolution rainfall data (Panagos et al. 2017).
3.1.3 Soil Erodibility (K)
The soil erodibility factor, K, is a lumped parameter that represents an integrated average annual value of the soil profile reaction to the processes of soil detachment and transport by raindrop impact and surface flow (Renard et al., 1997). Consequently, K-factor is best obtained from direct measurements on natural plots (Panagos, et al., 2012). However, this is a difficult task on a national or continental scale. To overcome this problem, measured K factor values have been related to soil properties. Panagos et al., (2012) estimated soil erodibility, at European level, based on attributes (texture, organic carbon) which were available from the Land Use/Cover Area frame Survey (LUCAS254) topsoil data, using the original
nomograph of Wischmeier, et al., (1971). Inverse distance weighting (IDW) was used to interpolate erodibility to a map with a grid-cell resolution of 10 km (Panagos et al., 2014).
3.1.4 Land Use/Land Cover
The land use/land cover products used in this project, were the Corine Land Cover (CLC) maps from Euroean Environmental Agency (EEA). CLC is a thematic land use/land cover cartography, available for the years 1990, 2000, 2006, 2012, and 2018, produced by the Directorate-General for the Territorial Development Portugal (DGT) for a project coordinated by the European Environmental Agency (EEA). It consists of an inventory of land cover in 44 classes, it uses a Minimum Mapping Unit (MMU) of 25 hectares (ha) for areal phenomena and a minimum width of 100 m for linear phenomena (DGT255). The CLC for 2018 is still being revised, as such, is a provisory cartographic product (EEA).
3.1.5 Calibration coefficients P and C
The cover-management factor (C-factor) is used within both the USLE and the RUSLE to reflect the effect of cropping and management practices on erosion rates. That is the mostly used factor to compare the relative impacts of management options on conservation plans, indicating how the conservation plan will affect the average annual soil loss and how that potential soil loss will be distributed in time during construction activities, crop rotations, or other management schemes (Renard et al., 1997). The study made by Panagos, et al. (2015), where the authors made an estimation for C-factor values at a European level, was the starting point to estimate the C-factor values, for the different land use/cover of the present study.
The support practices factor (P-factor) accounts for control practices that reduce the erosion potential of runoff by their influence on drainage patterns, runoff concentration, runoff velocity and hydraulic forces exerted by the runoff on the
254 https://ec.europa.eu/eurostat/web/lucas 255 http://www.dgterritorio.pt/dados_abertos/clc/
26
th
APDR Congress
ISBN 978-989-8780-07-2
soil surface. It is an expression of the overall effects of supporting conservation practices – such as contour farming, strip cropping, terracing, and subsurface drainage – on soil loss at a particular site, as those practices principally affect water erosion by modifying the flow pattern, grade, or direction of surface runoff and by reducing the volume and rate of runoff (Renard et al., 1997). The value of P-factor decreases by adopting these supporting conservation practices as they reduce runoff volume and velocity and encourage the deposition of sediment on the hill slope surface. The lower the P-factor value, the better the practice is for controlling soil erosion (Panagos, et al. 2015). Considering Panagos et al., (2015) the P-factor used for Portugal is 0.9178, for every CLC class.
3.1.6 Watersheds
The polygons of the watersheds were provided by the Portuguese Geographical Information National System (SNIG). This is the national spatial data infrastructure that allows the recording and the search of geographic data and services by both public and private entities. The original dataset is in GML256 format but was later converted to shapefile with GIS
software.
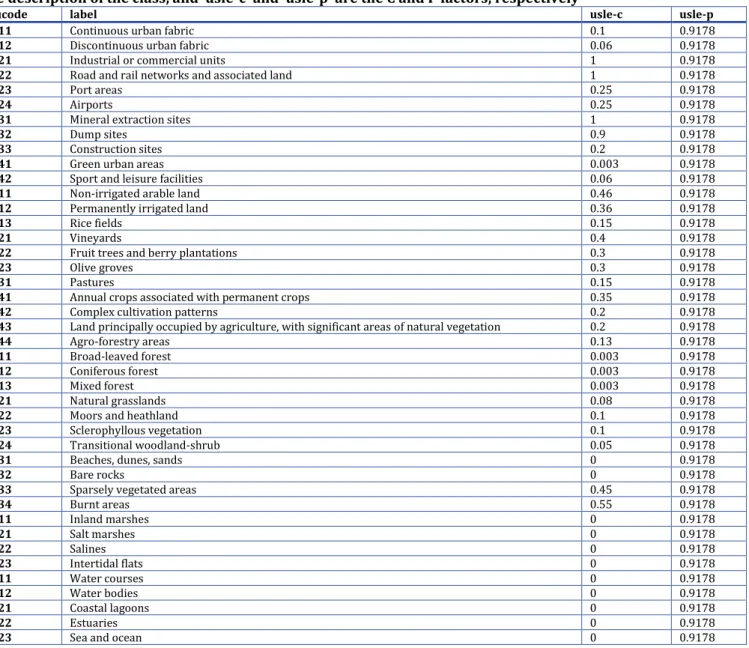
3.1.7 Biophysical table
The biophysical table (Table 2) was constructed using the CLC classes, and the C and P factors, as mentioned in a previous section, by reviewing studies from the literature (Panagos et al. 2015a; Panagos et al. 2015b), and also by adapting some values (for water bodies, for example) from the biophysical table from the Natural Capital Project sample data. The biophysical table is shown in table 2, were the C-factor is represented by the usle-c field, and the P-factor is represented by the usle-p field. The lucode field, represents the CLC-code for each class.
Table 2. Biophysical table used in the SDR model, where ‘lucode’ is the CLC code for each land use class, ‘label’ is the description of the class, and ‘usle-c’ and ‘usle-p’ are the C and P factors, respectively
lucode label usle-c usle-p
111 Continuous urban fabric 0.1 0.9178
112 Discontinuous urban fabric 0.06 0.9178
121 Industrial or commercial units 1 0.9178
122 Road and rail networks and associated land 1 0.9178
123 Port areas 0.25 0.9178
124 Airports 0.25 0.9178
131 Mineral extraction sites 1 0.9178
132 Dump sites 0.9 0.9178
133 Construction sites 0.2 0.9178
141 Green urban areas 0.003 0.9178
142 Sport and leisure facilities 0.06 0.9178
211 Non-irrigated arable land 0.46 0.9178
212 Permanently irrigated land 0.36 0.9178
213 Rice fields 0.15 0.9178
221 Vineyards 0.4 0.9178
222 Fruit trees and berry plantations 0.3 0.9178
223 Olive groves 0.3 0.9178
231 Pastures 0.15 0.9178
241 Annual crops associated with permanent crops 0.35 0.9178
242 Complex cultivation patterns 0.2 0.9178
243 Land principally occupied by agriculture, with significant areas of natural vegetation 0.2 0.9178
244 Agro-forestry areas 0.13 0.9178
311 Broad-leaved forest 0.003 0.9178
312 Coniferous forest 0.003 0.9178
313 Mixed forest 0.003 0.9178
321 Natural grasslands 0.08 0.9178
322 Moors and heathland 0.1 0.9178
323 Sclerophyllous vegetation 0.1 0.9178
324 Transitional woodland-shrub 0.05 0.9178
331 Beaches, dunes, sands 0 0.9178
332 Bare rocks 0 0.9178
333 Sparsely vegetated areas 0.45 0.9178
334 Burnt areas 0.55 0.9178 411 Inland marshes 0 0.9178 421 Salt marshes 0 0.9178 422 Salines 0 0.9178 423 Intertidal flats 0 0.9178 511 Water courses 0 0.9178 512 Water bodies 0 0.9178 521 Coastal lagoons 0 0.9178 522 Estuaries 0 0.9178
523 Sea and ocean 0 0.9178
26
th
APDR Congress
ISBN 978-989-8780-07-2
1075
3.1.8 Threshold flow accumulation, k
b, IC
0and SDR
maxThe threshold flow accumulation represents the number of upstream cells that must flow into a cell before it is considered part of a stream, which is used to classify streams from the DEM. IC0 and kb are two calibration parameters that determine
the shape of the relationship between hydrologic connectivity and the sediment delivery ratio. The SDRmax is the
maximum SDR that a pixel can reach. The values for the SDR model are presented in table 3.
Table 3. Values used for the threshold flow accumulation, kb, IC0 and SDRmax parameters.
Parameters Value
Threshold flow accumulation 1000
kb 2
IC0 0.5
SDRmax 0.8
4. RESULTS AND DISCUSSION
The The SDR model was computed for five time moments, corresponding to the years of the available CLC maps: 1990, 2000, 2006, 2012, and 2018. Next, is presented one outcome of the modeling process: the sediment retention output, which shows the sediment retention by the watersheds.
4.1 Sediment retention
Along the 28 years’ time period, the sediment retention stays constant throughout the country. Figure 2 shows the output of the SDR model, regarding this phenomenon for the most recent year, 2018.
Figure 2. Sediment retention for 2018 – SDR output
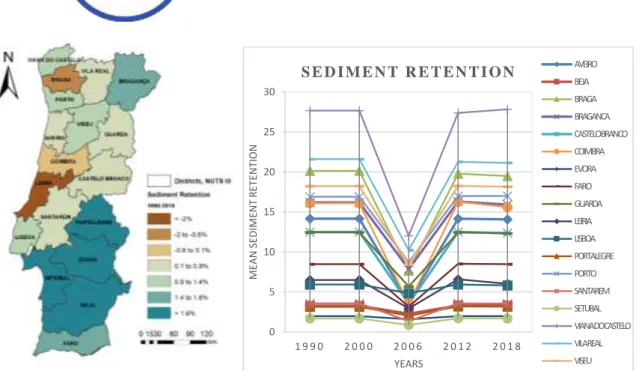
To better understand the outputs obtained, a zonal statistical analysis was carried out per administrative boundary, to determine which districts have a higher percentage of sediment retention over the 28 years’ time period. Therefore, the zonal statistics tool from ArcGIS ArcToolbox was used, combined with the raster calculator tool, which calculated the difference (%) between years 1990 and 2018. After the classification in natural breaks and a graphical analysis, the results are shown in Figure 3.
In Figure 3, the values for sediment retention are basically the same throughout the years, except for the period between 2000 and 2012. During this time, there is a decrease in sediment retention between 2000 and 2006, and an increase between 2006 and 2012, for some districts, while others were constant in the 28 years’ time window. The map shows high percentage in the Alentejo and Setúbal area, with values above 1,6%. There are three districts that present negative values for sediment retention, Coimbra with values between -0,6% and 0,1%, Braga with values between -2 % and -0,6%, and the District with the lowest level of sediment retention is Leiria, with values lower than -2%.
These negative values of sediment retention can be a sign of soil loss, due to soil erosion. This erosion can be explained by extreme phenomena that has occurred over the years, i.e. in this time period there were important forest fires, especially in 2017, where, according to EFFIS257, around 563 674 ha of burnt area were recorded in Portugal, more than
the previous 6 years altogether (Jesus et al., 2018). Forest fires tend to erode the soil, making it easier to the soil to be lost in the stream’s runoff (Ferreira, et al., 2008). During the 2000-2006 time period, there an abrupt decrease in sediment retention. According with the report of the European Environmental Agency (EEA, 2010) in 2004/05 was the year that has suffered one of the worst droughts recorded in the Iberian Peninsula, with only half of the average precipitation, causing the considerable decrease of the rivers flow. Still, according with the EEA report, in 2003 and 2005, there were great fires, that were followed by drought. These phenomena can explain why the sediment retention has an irregular behaviour during the 2000-2012 time window.
26
th
APDR Congress
ISBN 978-989-8780-07-2
Figure 3. Sediment retention SDR output analysis. Left: map with raster calculator analysis; Right: chart with the zonal statistics analysis, per district
5. CONCLUSION
This study assessed the change in sediment retention, in mainland Portugal. This allowed to evaluate the effects of changing land use on the Portuguese hydrological basins, and what is the impact on the soil. The overall results present lower sediment retention in the districts of Leiria, Coimbra and Braga, this is due the soil loss that these regions suffered over the years. Soil loss is closely related to rainfall partly through the detaching power of raindrops striking the soil surface and partly through the contribution of rain to runoff, this applies particularly to erosion by overland flow and rills, for which intensity is generally considered to be the most important rainfall characteristic (Webster, 2005). Related to sediment retention, as already mentioned, during the 2000-2012 time frame, there are some districts that present an abrupt decrease and then an increase, so, to understand this behaviour, a further analysis should be done to assess what kind of phenomena occurred over the years. The sediment delivery ratio model has some limitations to determine the different sources of soil erosion (e.g., landslides or gully erosion are not represented in the model), and these can have a significant impact in areas of land change, such as roads or agricultural lands (Sharp et al., 2018). The SDR model is also sensitive to kb and IC0 parameters, which are not physically based. A sensitivity analysis is recommended in the InVEST
user guide (Sharp et al., 2018). This could have been applied to investigate how the confidence intervals in input parameters affect the study conclusions. Other issue that might have affected the results, can be the quality of the CLC of 2018. Therefore, observing the sediment retention outcome for the different years, it was found that three districts in Portugal exhibited soil erosion, namely Coimbra, Leiria and Braga.
Acknowledgements
This research was supported by the project ASEBIO – Assessment of Ecosystem Services and Biodiversity in Portugal, Portuguese Science Foundation, PTDC/CTA-AMB/28438/2017 (http://asebio.novaims.unl.pt/).
REFERENCES
EEA, E. E. A. (2010). Mapping the impacts of natural hazards and technological accidents in Europe. An overview of the last decade. Technical report No 13/2010. https://doi.org/10.2800/62638
Esri. (2011). ArcGIS Desktop: Release 10. Redlands. USA.
Ferreira, A. J. D., Coelho, C. O. A., Ritsema, C. J., Boulet, A. K., & Keizer, J. J. (2008). Soil and water degradation processes in burned areas: Lessons learned from a nested approach. Catena, 74(3), 273–285. https://doi.org/10.1016/j.catena.2008.05.007
Figueiredo da Silva, J., Duck, R. W., & Catarino, J. B. (2009). Nutrient retention in the sediments and the submerged aquatic vegetation of the coastal lagoon of the Ria de Aveiro, Portugal. Journal of Sea Research. https://doi.org/10.1016/j.seares.2009.06.007 Jesus, S.-M.-A., Tracy, D., Roberto, B., Giorgio, L., Alfredo, B., Daniele, D. R., Fabio, L. (2018). Advance EFFIS report on Forest Fires in
Europe, Middle East and North Africa 2017.
Martins, B., Meira Castro, A. C., Ferreira, C., Lourenço, L., & Nunes, A. (2019). Gullies mitigation and control measures: A case study of the Seirós gullies (North of Portugal). Physics and Chemistry of the Earth. https://doi.org/10.1016/j.pce.2018.09.006
Navarro-Hevia, J., Lima-Farias, T. R., de Araújo, J. C., Osorio-Peláez, C., & Pando, V. (2016). Soil Erosion in Steep Road Cut Slopes in Palencia (Spain). Land Degradation and Development. https://doi.org/10.1002/ldr.2459
Nunes, A. N., Coelho, C. O. A., De Almeida, A. C., & Figueiredo, A. (2010). Soil erosion and hydrological response to land abandonment in a central inland area of Portugal. Land Degradation and Development. https://doi.org/10.1002/ldr.973
0 5 10 15 20 25 30 1 9 9 0 2 0 0 0 2 0 0 6 2 0 1 2 2 0 1 8 ME A N SE D IM EN T R ET EN TIO N YEARS S E D I M E N T R E T E N T I O N AVEIRO BEJA BRAGA BRAGANCA CASTELO BRANCO COIMBRA EVORA FARO GUARDA LEIRIA LISBOA PORTALEGRE PORTO SANTAREM SETUBAL VIANA DO CASTELO VILA REAL VISEU
26
th
APDR Congress
ISBN 978-989-8780-07-2
1077
Panagos, P., Meusburger, K., Alewell, C., & Montanarella, L. (2012). Soil erodibility estimation using LUCAS point survey data of Europe. Environmental Modelling & Software, 30, 143–145. https://doi.org/10.1016/J.ENVSOFT.2011.11.002
Panagos, Panos, Borrelli, P., Meusburger, K., Alewell, C., Lugato, E., & Montanarella, L. (2015). Land Use Policy Estimating the soil
erosion cover-management factor at the European scale. Land Use Policy, 48, 38–50.
https://doi.org/10.1016/j.landusepol.2015.05.021
Panagos, Panos, Borrelli, P., Meusburger, K., Yu, B., Klik, A., Lim, K. J., … Chattopadhyay, N. (2017). Global rainfall erosivity assessment based on high-temporal resolution rainfall records, (February), 1–12. https://doi.org/10.1038/s41598-017-04282-8
Panagos, Panos, Borrelli, P., Meusburger, K., Zanden, E. H. Van Der, Poesen, J., & Alewell, C. (2015). ScienceDirect Modelling the effect of support practices ( P -factor ) on the reduction of soil erosion by water at European scale. Environmental Science and Policy, 51, 23–34. https://doi.org/10.1016/j.envsci.2015.03.012
Panagos, Panos, Meusburger, K., Ballabio, C., Borrelli, P., & Alewell, C. (2014). Science of the Total Environment Soil erodibility in Europe : A high-resolution dataset based on LUCAS. Science of the Total Environment, The, 479–480, 189–200. https://doi.org/10.1016/j.scitotenv.2014.02.010
Renard, K. G., Foster, G. R., Weesies, G. A., McCool, D. K., & Yoder, D. C. (1997). Predicting soil erosion by water: a guide to conservation planning with the Revised Universal Soil Loss Equation (RUSLE). USDA Agriculture Handbook, 703, 404. https://doi.org/DC0-16-048938-5 65–100.
Sharp, E. R., Chaplin-kramer, R., Wood, S., Guerry, A., Tallis, H., Ricketts, T., … Invest, J. (2018). InVEST User ’ s Guide.
Teng, H., Liang, Z., Chen, S., Liu, Y., Viscarra Rossel, R. A., Chappell, A., … Shi, Z. (2018). Current and future assessments of soil erosion by water on the Tibetan Plateau based on RUSLE and CMIP5 climate models. Science of The Total Environment, 635, 673–686. https://doi.org/10.1016/J.SCITOTENV.2018.04.146
Teng, H., Viscarra Rossel, R. A., Shi, Z., Behrens, T., Chappell, A., & Bui, E. (2016). Assimilating satellite imagery and visible–near infrared spectroscopy to model and map soil loss by water erosion in Australia. Environmental Modelling & Software, 77, 156–167. https://doi.org/10.1016/J.ENVSOFT.2015.11.024
Webster, R. (2005). Morgan, R.P.C. Soil Erosion and Conservation, 3rd edition. Blackwell Publishing, Oxford, 2005. x + 304 pp. f29.95, paperback. ISBN 1-4051-1781-8. European Journal of Soil Science, 56(5), 686–686. https://doi.org/10.1111/j.1365-2389.2005.0756f.x
Winchell, M. F., Jackson, S. H., Wadley, A. M., & Srinivasan, R. (2008). Extension and validation of a geographic information system-based method for calculating the Revised Universal Soil Loss Equation length-slope factor for erosion risk assessments in large watersheds. Journal of Soil and Water Conservation, 63(3), 105–111. https://doi.org/10.2489/63.3.105
Wischmeier, W. H., Johnson, C. B., & Cross, B. V. (1971). Soil erodibility nomograph for farmland and construction sites. Journal of Soil and Water Conservation1.
Wischmeier, W. H., & Smith, D. D. (1978). Predicting rainfall erosion losses. A guide to conservation planning. Transactions of the American Geophysical Union. https://doi.org/10.1029/TR039i002p00285