www.ccarevista.ufc.br ISSN 1806-6690
Sediment delivery ratio in a small semi-arid watershed under
conditions of low connectivity
1Razão de aporte de sedimentos em pequena bacia hidrográfica semiárida em
condições de baixa conectividade
Julio Cesar Neves dos Santos2*, Eunice Maia de Andrade3, Pedro Henrique Augusto Medeiros4, Helba Araújo de
Queiroz Palácio4 and José Ribeiro de Araújo Neto4
ABSTRACT - The semi-arid region in the northeast of Brazil is characterised by rains of high intensity and short duration, with the processes of erosion being aggravated by an inappropriate land-use model. In this region, the lack of measured data for runoff and sediment yield increases the need to apply hydro-sedimentological models in estimating erosion, requiring knowledge of the actual sediment delivery ratio for the region. The aim of this study therefore, was to map soil erosion, making use of the Universal Soil Loss Equation (USLE), in the Iguatu Experimental Watershed (IEW). The mean annual sediment delivery ratio (SDR), and the SDR for individual events, was calculated from hydro-sedimentological measurements, contributing to an understanding of the processes of sediment propagation in the Brazilian semi-arid region, allowing identification of areas susceptible to water erosion. The IEW has an area of 16.74 km2 and is equipped with sensors
for the continuous measurement of rainfall, flow and sediment yield. The mean annual SDR for the IEW was 0.37%. The SDR for individual rainfall events ranged from 0.08 to 1.67%, with an average of 0.68%. Among the main variables that influence the SDR for individual events is the magnitude of rainfall depth and antecedent soil moisture that can be better represented by the total antecedent precipitation of the previous 15 days. According to maps of soil loss, only 6.27% of the watershed presented losses beyond tolerable limits.
Key words: Sediment yield. Soil erosion. USLE. SDR.
RESUMO - O semiárido do Nordeste brasileiro é caracterizado por chuvas de alta intensidade e curta duração e os processos erosivos são agravados pelo inadequado modelo de uso do solo. Nessa região, a carência de dados medidos de escoamento e produção de sedimento aumenta a necessidade de aplicação de modelos hidrossedimentológicos para a estimativa da erosão, necessitando o conhecimento da real taxa de aporte de sedimentos para a região. Neste sentido, o objetivo deste estudo é mapear a erosão do solo com uso da Equação Universal de Perda de Solo (USLE) na Bacia Experimental de Iguatu (BEI) e calcular a razão de aporte de sedimentos (SDR-Sediment Delivery Ratio) média anual e por eventos individuais a partir de medidas
hidrossedimentológicas, contribuindo para o entendimento dos processos de propagação de sedimentos no semiárido brasileiro, o que permite a identificação de áreas susceptíveis à erosão hídrica. A BEI apresenta uma área de 16,74 km2 e foi equipada com
sensores para mensurações contínuas de precipitação, vazão e produção de sedimentos. O SDR médio anual para a BEI foi de 0,37%. Os SDR para eventos pluviométricos individuais variaram de 0,08 a 1,67%, com média de 0,68%. Entre as principais variáveis que influenciaram o SDR para eventos individuais está a magnitude da altura pluviométrica e a umidade antecedente do solo, que pode ser melhor representada pela precipitação total antecedente dos últimos 15 dias. De acordo com os mapas de perda de solo, apenas 6,27% da bacia apresentou perdas muito além dos limites toleráveis.
Palavras-chave:Produção de sedimentos. Erosão do solo. USLE. SDR.
DOI: 10.5935/1806-6690.20170006 *Autor para correspondência
1Recebido para publicação em 09/09/2015; aprovado em 21/03/2016
Parte da Tese de Doutorado do primeiro autor apresentada à Universidade Federal do Ceará
2Instituto Federal do Triângulo Mineiro/IFTM, Fazenda Sobradinho, S/N, Caixa Postal:592, Uberlândia-MG, 38.400-974, Brasil, juliocesarnds@
yahoo.com.br
3Departamento de Engenharia Agrícola, Centro de Ciências Agrárias, Universidade Federal do Ceará, Fortaleza-CE, Brasil, [email protected] 4Instituto Federal de Educação, Ciência e Tecnologia do Ceará/IFCE, Fortaleza-ce, Brasil, [email protected], [email protected],
INTRODUCTION
Soil erosion is currently one of the most serious environmental problems in the world, since it seriously endangers the environment, agriculture and water resources, and reduces the storage capacity of reservoirs
(ALEXAKIS et al., 2013; PRASANNAKUMAR et
al., 2012; RAHMAN et al., 2009; ZHOU; WU, 2008).
Erosion is a major cause of land degradation; it is therefore necessary to establish conservation measures and ensure the development of a sustainable management of soil
resources (RAHMANet al., 2009).
Determination of the spatial distribution of soil loss is important to identify those areas prone to erosion, and develop plans for the administration of specific locations which are at high risk of erosion
(IRVEM et al., 2007). The mapping and assessment
of erosion risk, as well as spatial and quantitative information on soil erosion, contribute significantly to administration, soil management and conservation, and
erosion control in watersheds (ALEXAKISet al., 2013;
PRASANNAKUMARet al.,2012).
Erosion simulation models, especially distributed models, are useful for evaluating different land use strategies and improving land administration in
watersheds (BESKOWet al., 2009). The most commonly
adopted empirical models are the Universal Soil Loss Equation (USLE) (WISCHMEIER; SMITH, 1978) and its derivatives, such as the Revised Universal Soil Loss Equation (RUSLE).
Soil erosion models, such as the USLE (WISCHMEIER; SMITH, 1978) only estimate gross erosion rates on the scale of an agricultural plot or lot. Erosion rates estimated by USLE are therefore higher than those measured at the outflow of a watershed. To consider the effect of sediment deposition throughout its trajectory
(BRACKEN; CROKE, 2007; FRYIRSet al., 2007), the
concept of a Sediment Delivery Ratio (SDR) has been widely employed, defined as the fraction of gross erosion transported from a given area in a given time interval to
the outflow of the watershed (LUet al., 2006).
Studies, such as that of Santos et al. (2014) who,
studying small basins inserted in the Iguatu Experimental Watershed in the State of Ceará, calibrated and validated the C factor in the USLE and the energy term coefficients in the Modified Universal Soil Loss Equation (MUSLE), for ground cover of native caatinga, thinned caatinga and
grass (Andropogon gayanus Kunt / after slash and burn)
in the semi-arid region. However, studies of the Brazilian semi-arid region and, more precisely, of the Caatinga biome, which examine and quantify the actual sediment delivery ratio (SDR) are rare. By using the USLE model,
such studies can help in identifying the actual rate of sediment transported to a given reservoir, as well as in the precise mapping of the most productive areas of sediment, aiding the work of soil conservation.
The aim of this study therefore was to map soil erosion in the Iguatu Experimental Watershed (IEW) using the USLE model, and determine the mean annual sediment delivery ratio (SDR), as well as the SDR for individual hydrological events, contributing to an understanding of the processes of sediment propagation in the semi-arid region of Brazil, which would allow the identification of areas susceptible to water erosion.
MATERIAL AND METHODS
Study area
The Iguatu Experimental Watershed (IEW) is located in the semi-arid region of Ceará, inserted in the basin of the Upper Jaguaribe in the town of Iguatu, at 6°23’36’’ to 6°23’57’’ S and 39°15’15’’ to 39°15’30’’ W. The climate in the region, according to the Köppen climate classification, is type BSw’h’, hot semi-arid. The Thornthwaite aridity index is 0.44, classified as semi-arid. Mean historical rainfall for the town of Iguatu is 864 ± 304 mm, of which 85% is concentrated in the period from January to May, and around 30% is recorded during March
(SANTOSet al., 2014).
The IEW has an area of 16.74 km2, with an average
slope of 9%. To measure surface runoff, the control section in the outflow of the watershed consists of a spillway equipped with a pressure-transducer type level sensor connected to a datalogger with an acquisition interval of 5 min, allowing generation of the hydrographs and the total runoff depth.
To quantify sediment yield, a turbidity and sediment sensor (turbidimeter) with an acquisition interval of 15 min was installed near the level sensor. Samples of water and sediment were collected by the equal-width increment method for calibration of the turbidimeter. The study period covered the rainy seasons of 2013 and 2014, with 61 natural rainfall events being recorded, and runoff occurring in eight of these events.
Universal Soil Loss Equation (USLE)
To estimate erosion potential in the IEW, the Universal Soil Loss Equation (USLE) was used (Wischmeier and Smith, 1978), expressed by Equation 1.
where: A is mean annual soil loss, t ha-1 yr-1; R is the
rainfall erosivity factor, MJ mm ha-1 h-1; K is the soil
erodibility factor, t h MJ-1 mm-1; L is the topographic
factor expressing slope length, dimensionless; S is the topographic factor expressing slope steepness, dimensionless; C is the factor for land use and management, dimensionless; and P is the factor for conservation practices, dimensionless.
Erosivity index (R)
For each monitored rainfall event, the intensities
(I, mm h-1), and the maximum intensity over 30 minutes
(I30, mm h-1) were calculated. The kinetic energy (KE)
associated with rainfall, MJ ha-1 mm-1, was obtained by
Equation 2, proposed by Wischmeier and Smith (1978)
modified by Fosteret al.(1981).
KE = 0.119 + 0.0873 Log I (2)
where: KE is the kinetic energy of the rainfall, in MJ
ha-1 mm-1; I is the rainfall intensity in mm h-1. The
values obtained by equation 2 were used to calculate the erosivity index, EI30, from Equation 3.
EI30 = KE x I30max x P (3)
where: EI30 is the erosivity index, represented as the R
factor, in MJ mm ha-1 h-1; I30max is the mean maximum
intensity of the rainfall over 30 minutes, in mm h-1; P is
the rainfall depth in mm.
Soil erodibility index (K)
The soils of the watershed are Podzolic Luvisols (24.25%), Vertisols (45.63%), a Fluvic Neosol (13.06%) and a Lithic Neosol (17.05%) (SiBCS) (Figure 1). The class of soils with the greatest occurrence in the watershed was the Vertisols (45.63%); these soils are characteristic of expansive clays, with high rates of infiltration when dry (especially in the cracks), and low rates when wet. The map of soil and erodibility (K factor) (Figure 1) was developed, based on published values from studies in
the IEW (SANTOSet al., 2014), and from other works
on the same types of soil in the watershed under study (RIBEIRO; ALVES, 2008).
Topographic factor (LS)
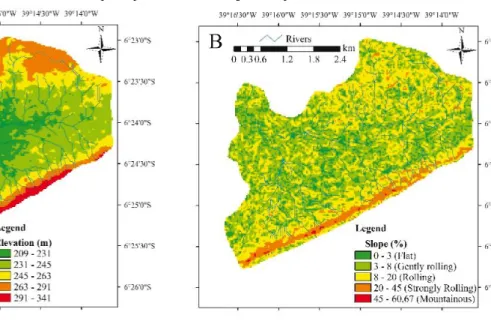
To estimate the topographic factors (L and S), a digital terrain elevation model was used (Figure 2A) with a resolution of 30 m, prepared with images from the Shuttle Radar Topography Mission (SRTM). The LS factor was calculated by combining the products of the L and S factors. The factor for slope length (L) was calculated for each pixel of the grid, as per Equation 4, suggested by Desmet and Govers (1996):
(4)
where: U is the area of flow contribution to the cell (m²); D is the cell size (m); x is a correction factor for cell orientation (equal to 1 when the flow exits through one of the four sides, and equal to 1.41 when the flow exits through a corner). The m parameter is a function of the average slope of the pixel (s) (Figure 2B):
m = 0.5; s > 5%
m = 0.4; 3% > s > 5%
m = 0.3; 1% > s > 3%
m = 0.2; s < 1%
The slope factor (S) was calculated from the
slope map (d, m m-1) as per equation 5 from Williams
and Arnold (1997):
S = (65.41 d2+ 4.56 d + 0.065) (5)
Ground cover and soil management factor (C)
For classification and generation of the ground cover and land use map, a Landsat 5, TM sensor image of 18 October 2008 from orbit/point 217/64 was used. The image was classified by supervised classification algorithm, using the ENVI 4.2 software, defining five classes in the watershed: water, new caatinga, fallow caatinga, bare soil and pasture.
Figure 2 - Digital terrain elevation model (B) and slope map (%) (B), for the Iguatu Experimental Watershed (IEW)
Figure 3 - Land use and C factor map, for the Iguatu Experimental
Watershed (IEW)
The C factor is related to land use and indicates soil erosion vulnerability. The C factor map (Figure 3) was developed based on published values from studies in the
IEW (SANTOS et al., 2014), and from other studies of
similar ground cover (ALBUQUERQUEet al., 2005).
Conservation practices factor (P)
The P factor is the ratio between soil loss from a soil cultivated under a determined conservation practice,
and the corresponding loss cultivated further downhill
(PANDEYet al., 2007). In the present study, following
the procedure adopted by Beskowet al.(2009), a value of
1.0 was assigned to the P factor over the entire area, since there were no erosion control practices in the watershed under study.
Sediment delivery ratio (SDR)
The annual sediment delivery ratio (SDR), and those for runoff-generating rainfall events, were calculated from the ratio between sediment yield, measured at the outflow of the watershed, and gross soil loss from erosion, estimated by the Universal Soil Loss Equation (USLE), as per equation (6):
(6)
where: SY is sediment yield that actually left the
watershed (t ha-1), and A is the soil loss per unit of area
(t ha-1) estimated by the USLE.
RESULTS AND DISCUSSION
Estimated gross erosion for the IEW using the USLE
The IEW presents a K factor greater than 0.03 t h
MJ-1 mm-1 for 75.75% of its area (Figure 1), indicating
a high susceptibility to water erosion (BESKOW et
al., 2009). Typic Carbonatic Ebanic Vertisols, rich in
expansive clays, represent 45.6% of the watershed
measured in the field by Santoset al.(2014) at
erosion-plot scale in the study area (IEW).
With the exception of the dividers to the south of the watershed, most of the watershed has an LS value of less than four, which shows a moderate vulnerability
to erosion (BESKOW et al., 2009; RAHMAN et al.,
2009). This result is due to the distribution of slopes in the watershed (Figure 2B), where only 14% of the area has slopes greater than 15%, the terrain being classified as from rolling (steep) to mountainous (very steep)
(ALEXAKISet al., 2013).
The watershed also displays ground cover with a high degree of preservation (Figure 3), where 59.12% is covered with new caatinga and 12.82% covered with fallow, dense caatinga, giving a total of 71.94% of the
watershed, and representing an area of 12.04 km2. The
remaining classes were pasture, representing 21.38% of the watershed, followed by bare soil with 6.27%, and water (artificial surface reservoirs) with 0.41%.
According to simulations using the USLE (Figure 4), assuming the constant maintenance of plant cover during the study period (2013-2014) (Factor C - Figure 3), soil loss varied spatially in the IEW from
0 to 890 t ha-1 yr-1 for 2013, and 0 to 1,498 t ha-1 yr-1
for 2014. These results corroborate those reported by
Lopes et al. (2011) and Silva et al. (2014), working
in watersheds in the semi-arid region of northeastern Brazil.
In 2013 (Figure 4A), the R factor was 4,480 MJ
mm ha-1 h-1, increasing in 2014 (Figure 4B) to 7,536
MJ mm ha-1 h-1. The higher erosivity index in 2014
Figure 4 - Maps showing the rate of soil loss (t ha-1 yr-1) for 2013 (A) and 2014 (B), for the Iguatu Experimental Watershed (IEW)
increased the area of the watershed, with soil losses in
excess of 20 t ha-1 yr-1 (Figure 4B), going from 8.3%
in 2013 to 14.3% of the watershed in 2014. These areas which are more susceptible to erosion (Figure 4) are mainly located in zones with slopes greater than 20% (Figure 2B), and with soils classified as Lithic Neosols (Figure 1), to the south of the watershed. The combination of soils of high erodibility with high slopes, together with elevated indices of erosivity, results in a large breakdown of sediment, requiring only flow energy for its transport.
The red shading on the maps, for soil losses
exceeding 100 t ha-1 yr-1 (Figure 4A and B), are associated
with areas of high slopes (>20%), and areas of bare soil (6.27% of the watershed), where overgrazing is practised (grazing with a greater number of animals than the capacity of the area), degrading the soil and leaving it susceptible to the processes of erosion. Erosion in these areas is further aggravated by soils of high erosion potential: the Vertisols and the Fluvic Neosol (Figure 1) (RIBEIRO; ALVES,
2008; SANTOSet al., 2014).
Around 88.2% of the area of the IEW was
classified as being at low risk of erosion (BESKOWet
al., 2009; PRASANNAKUMARet al., 2012), less than
5 t ha-1 yr-1, even in 2014, with 93.3% of the watershed
showing soil losses of less than 10 t ha-1 yr-1. These
results are similar to those obtained by Lopes et al.
(2011), working in the Varjota River watershed in the semi-arid region of the State of Ceará, where they found 74% of the watershed with a mean annual soil loss of
Table 1 - Annual values for rainfall, erosivity, observed sediment yield (SY), gross erosion estimated by the USLE, and SDR, for the Iguatu Experimental Watershed (IEW)
Year Rainfall (mm) EI30 (MJ mm ha-1 h-1) Runoff (mm) Observed SY (t ha-1 yr-1) Estimated erosion (t ha-1 yr-1) SDR (%)
2013 639 4.480 71.79 0.095 19.81 0.48
2014 772 7.536 79.37 0.086 33.32 0.26
Mean 706 6.008 75.58 0.090 26.56 0.37
Annual sediment delivery ratio (SDR) and by event, for the IEW
The mean annual value for the SDR was 0.37%, showing that for the years under study, 2013 and 2014, only 0.48% and 0.26% respectively of the soil loss in the watershed (estimated using the USLE model) were transported and exported beyond the outflow of the watershed (Table 1). However, it is worth noting that for the years being studied, the mean annual rainfall was below the historical average (864 mm), and may therefore indicate conditions of low hydrological connectivity when compared to years with above average and temporally well-distributed rainfall (BRACKEN
et al.,2013; FRYIRSet al., 2007; FRYIRS, 2013).
Other factors which contribute to the low mean SDR are the larger slopes in regions close to the dividers of the watershed (Figure 2B), followed by the areas of low slopes throughout the watershed and near the outflow, which favour deposition of disaggregated sediment, reducing the rate of
sedimentyield and, as a consequence, the sediment delivery
ratio (MEDEIROS et al., 2014). De Vente et al. (2008),
studying 61 watersheds in the semi-arid region of Spain, with
areas ranging from 29 to 13,246 km2, found an SDR varying
between 0.3% and 55.5%. Zhou and Wu (2008) found SDR values ranging from 0.1% to 37% in sub-basins from the Chaobaihe River to the Miyun Reservoir in
China. In Brazil, studies such as that of Beskow et al.
(2009), also found lower annual values for the SDR, with a mean value of 1.62% for the Rio Grande Watershed, in
the State of Minas Gerais, with an area of 6,273 km2.
It should be noted that the low values for annual SDR of the IEW (Table 1) may be associated with annual rainfall below the historical average, since in the years under study, events with high return periods and high hydrological connectivity, capable of transporting large amounts of sediment, may not have occurred. Medeiros and Araujo (2014), in a study with nested basins, also in the watershed of the Upper Jaguaribe, showed that 10% of the most critical rainfall events were responsible for 88% and 98% of sediment yield for the Aiuaba (12 km²) and
Benguê (900 km2) watersheds respectively. According to
those authors, in rainfall events of small depth (short return period), the sediment is mobilised but not transported to the outflow. Whereas rainfall events of great depth find much
available sediment, which is transported under conditions
of high connectivity. According to Fryirs et al. (2007),
except for the occurrence of extreme events, lowlands and terraces along the floodplain are not connected, and maintain their ability for buffering (stopping or weakening runoff and sediment). In general, sediment derived upstream, i.e. areas of high slope at the dividers of the IEW (Figure 4A and B), can be deposited on the surfaces of the flood plains, and during high magnitude events the connectivity between landscape units is increased, thereby maximising the “area of effective influence”, which can generate more energy for the runoff and a greater production of sediments
in the watershed (FRYIRSet al., 2007).
Annual values for sediment yield (Table 1) were
low compared to those found by Beskow et al. (2009)
and Alexakis et al. (2013). However, Silvaet al. (2014)
obtained similar results while studying the Tapacurá Watershed in the State of Pernambuco, Brazil, with an area
of 470 km2 and a hot and humid tropical climate, showing
annual sediment yield ranging from 0.01 to 0.17 t ha-1 yr-1,
and SDR values which varied around 8%.
The characteristics of shallow soils and intermittent runoff in the IEW promote sediment deposition throughout the watershed. The low value for SDR in the watershed may also be linked to the low slopes, as more than 50% of the watershed has slopes of less than 8%. The different elevations display large zones where transport energy is dissipated, possibly causing sediment deposition throughout the watershed. Another point that contributes to dissipation of the energy for sediment transport is the vegetation, as caatinga is found in 71.94% of the IEW (fallow or in a state of development) (Figure 3). According to
Bracken and Croke (2007) and Santos et al. (2011)
bands of vegetation act as barriers to sediment transport, favouring infiltration into the soil as a result of the increase in organic matter and the reduction in soil density that increase hydraulic conductivity. The vegetation also works to dissipate runoff energy, resulting in greater opportunity time for the processes
of infiltration and sediment deposition (SANTOS et
al., 2011). Runoff and sediment connectivity along the
slopes and in the watershed decrease as the plant cover
Another factor in the reduction of the SDR is
the presence of surface reservoirs (LU et al., 2006).
For Bracken and Croke (2007) and Fryirset al.(2007)
these structures inhibit or limit the movement of sediment along the canals, acting to break hydrological and sedimentological connectivity. In the IEW there are four small reservoirs, giving a total basin of 6.86 ha, the largest being of 4.5 ha. These reservoirs act as structures for breaking connectivity, retaining a portion of the disaggregated sediment and reducing transport capacity to the outflow of the watershed.
SDR values for individual runoff-generating events ranged from 0.08% to 1.67%, with an average of 0.68% (Table 2). These low values demonstrate the high capacity of the watershed for the retention of disaggregated sediment. Analysing the two events that generated runoff in 2013 (9 May and 10 May), it can be seen that the first event, even with precipitation and erosivity at 238% and 581% higher than the second event respectively, displayed a lower SDR, with a value of 0.53% (Table 2). This behaviour can be explained by
the break in hydrological connectivity (BRACKENet
al., 2013; FRYIRSet al., 2007; FRYIRS, 2013) with
the event of 9 May. In this first event, the soil had low antecedent moisture, and small surface reservoirs were dry, causing breaks in the connectivity of the
system (FRYIRSet al., 2007) and generating sediment
deposition throughout the watershed. The event of 9 May 2013, with 162 mm, a 70-year return period (using an historical series of 39 years, with the annual maximum values adjusted for the Gumbel distribution), and large erosivity, was able to break down large amounts of sediment, forming banks throughout the watershed, but due to poor connectivity was not able to transport them
downstream from the watershed (BRACKEN et al.,
2013; FRYIRS et al., 2007). Subsequent events, such
Table 2 - Values by hydrological event for rainfall, erosivity (EI30), runoff, observed sediment yield (SY), gross erosion estimated by the USLE, and SDR, for the Iguatu Experimental Watershed (IEW)
Event Rainfall (mm) EI30 (MJ mm ha-1 h-1) Runoff (mm) Observed SY Estimated erosion SDR (%)
(t ha-1 ano-1) (t ha-1 ano-1)
09/May/2013 162.0 2868.9 43.53 0.067 12.683 0.53%
10/May/2013 48.0 421.4 28.27 0.028 1.863 1.48%
06/Mar/2014 58.1 284.9 2.05 0.001 1.260 0.08%
12/Mar/2014 44.3 449.0 7.92 0.013 1.985 0.64%
16/Mar/2014 33.0 125.0 3.26 0.001 0.553 0.22%
04/Apr/2014 69.3 1902.5 15.43 0.019 8.411 0.22%
07/Apr/2014 33.9 191.1 7.74 0.005 0.845 0.58%
12/Apr/2014 72.0 645.3 42.97 0.048 2.853 1.67%
as on 10 May 2013, even with less precipitation and erosivity, were able to transport earlier disaggregated and available sediment, thereby increasing sediment yield and the SDR (MEDEIROS; ARAUJO, 2014), processes which are not considered in empirical erosion
models, such as the USLE (RAHMANet al., 2009).
The low SDR values for the eight events monitored (Table 2) show that for the period studied, events of high hydrological connectivity may not have occurred in the IEW. The connectivity of the watershed may therefore be maximised when these (extreme) events occur for soil containing high antecedent moisture, together with full, small surface reservoirs (increasing the hydrologically-connected contribution area in the watershed). It is therefore emphasised that future extreme events, under favourable conditions of antecedent moisture, may display greater values for SDR, depending on the magnitude of the rainfall event and on the other variables related to hydrological connectivity in the watershed (such as soil moisture, development stage of the vegetation and storage in the reservoirs, among others).
Among the variables that influence the SDR throughout the events, is the antecedent moisture of the soils in the watershed. Several studies emphasise the influence of antecedent moisture and the temporal structure of precipitation on the generation of runoff (BRACKEN
et al., 2008; JAMES; ROULET, 2007; MEDEIROS
et al., 2010; MEDEIROS et al., 2014; MEDEIROS;
ARAUJO, 2014; SANTOSet al., 2011). Monitoring soil
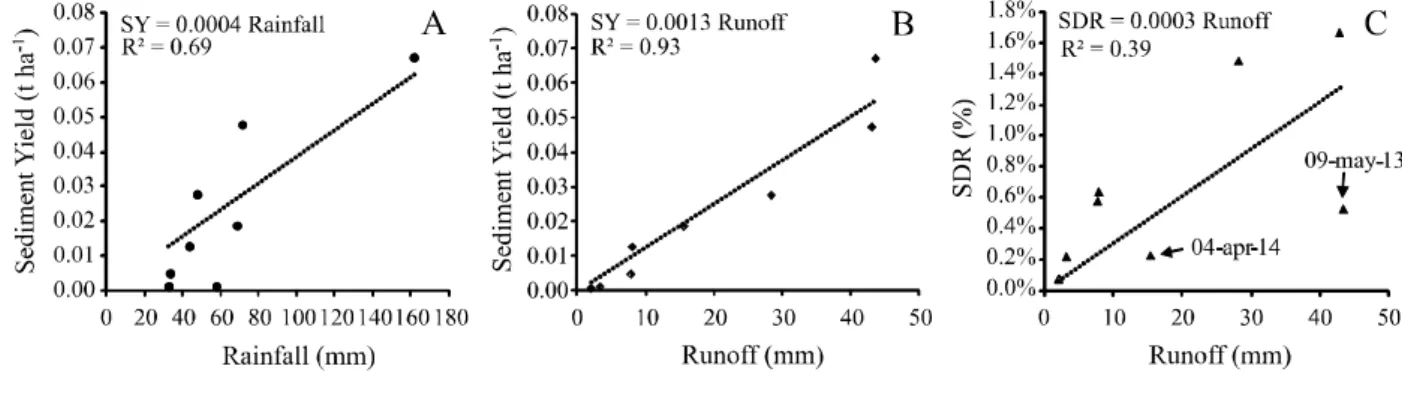
Figure 6 - Relationships between sediment yield and rainfall (A); sediment yield and runoff (B); SDR and runoff (C), for the Iguatu Experimental Watershed (IEW)
SDR. The best correlation between SDR and antecedent precipitation was for 15 days; this is therefore the best parameter to represent the effect of antecedent moisture in the IEW.
Analysing individual events further, a good correlation is found in the IEW between sediment yield and
rainfall (Figure 6A), with a coefficient of determination R2
of 0.69, indicating a positive increase in sediment input with rainfall magnitude. For the relationship between sediment yield and runoff (Figure 6B), an excellent coefficient of
determination was achieved, R2 = 0.93. High correlations
of this nature indicate conditions of sediment yield limited by the transport capacity of the events. Sediment yield in the area is therefore related to the transport capacity of the flow if there is disaggregated sediment available
for transport. For authors like Medeiros et al. (2010),
sediment yield in the semi-arid region of Brazil is limited by the conditions of transport, and not by the availability of eroded material. However, it should be emphasised that the results of the present study were obtained for years of below average rainfall with little runoff generation, i.e. under conditions of low connectivity. It is possible that in
Figure 5 - Correlations by event between the SDR and values for antecedent precipitation over the last 5 (A), 15 (B) and 30 days (C), for the Iguatu Experimental Watershed (IEW)
very rainy years, where there are also sequences of rainfall events with a high return period, the sediment accumulated in the watershed will be carried to the outflow, as discussed by Medeiros and Araujo (2014). In that case, sediment yield in later events may be limited by the availability of material.
The events of 9 May 2013 and 4 April 2014 (Figure 6C) showed high values for EI30 (Table 2), causing considerable sediment disaggregation. Events of this nature, with high values for erosivity when modelled by the USLE, display a high rate of modelled gross erosion, as sediment transport capacity is not considered. However, the actual sediment transport capacity is well below the availability of disaggregated sediment, resulting in a low SDR. Therefore, by excluding these two extreme EI30
events (below the line), the value for R2 in Figure 6C goes
CONCLUSIONS
1. Application of the Universal Soil Loss Equation (USLE) to the Iguatu Experimental Watershed (IEW) indicated values for soil loss which varied from 0 to
1,498 t ha-1 yr-1. Furthermore, 93.8% of the area of the
IEW was classified as being at low risk of erosion, less
than 5 t ha-1 yr-1, even in 2014, the year with the highest
total precipitation and erosivity;
2. The mean annual sediment delivery ratio (SDR) for the IEW is low for those years of below average rainfall and therefore under conditions of reduced connectivity, with a mean annual value of 0.37%; for individual events, this ranged from 0.08% to 1.67%;
3. As well as the absence of events of high hydrological connectivity during the study period, the low values for SDR in the IEW may be related to the low slopes in the watershed, the good state of conservation of the vegetation, and the presence of small surface reservoirs, which when dry, reduce the contribution area of the watershed.
4. Events of high rainfall depth resulted in major
sediment breakdown in the IEW, but without sufficient transport energy for drag, generating low SDR values; subsequent events, even when of lower erosivity, transported the readily available sediment, resulting in higher values for the SDR;
5. The strong correlation seen between runoff and
sediment yield indicates that sediment yield in the region was limited by the transport conditions during the period of study;
6. SDR values by event, which is an indicator of hydrological connectivity, presented strong correlation with accumulated antecedent precipitation for the previous 15 days in the IEW, demonstrating the importance of the sequence of rainy days (an indirect index of soil moisture content) to hydrological connectivity in the different units of the watershed.
REFERENCES
ALBUQUERQUE, A. W. et al. Determinação de fatores da
equação universal de perdas de solo em Sumé, PB.Revista Brasileira de Engenharia Agrícola e Ambiental, v. 9, n. 2, p. 153-160, 2005.
ALEXAKIS, D. D.et al. Integrated use of remote sensing, GIS
and precipitation data for the assessment of soil erosion rate in the catchment area of “Yialias” in Cyprus.Atmospheric Research, v. 131, p. 108-124, 2013.
BESKOW, S.et al. Soil erosion prediction in the Grande River
Basin, Brazil using distributed modeling.Catena, v. 79, p. 49-59, 2009.
BRACKEN, L. J.et al. Concepts of hydrological connectivity: research approaches, pathways and future agendas. Earth-Science Reviews, v. 119, p. 17-34, 2013.
BRACKEN, L. J. et al. The relationship between rainfall
inputs and flood generation in South-east Spain.Hydrological Processes, v. 22, p. 683-696, 2008.
BRACKEN, L. J.; CROKE, J. The concept of hydrological connectivity and its contribution to understanding runoff-dominated geomorphic systems.Hydrological Processes, v. 21, n. 13, p. 1749-1763, 2007.
DE VENTE, J. et al. Spatially distributed modelling of soil
erosion and sediment yield at regional scales in Spain.Global and Planetary Change, v. 60, p. 393-415, 2008.
DESMET, P. J. J.; GOVERS, G. A GIS procedure for automatically calculating the USLE LS factor on topographically complex landscape units. Journal of Soil and Water Conservation, v. 51, p. 427-433, 1996.
FOSTER, G. R. et al. Conversion of the universal soil loss
equation to SI metric units. Journal of Soil and Water Conservation, v. 36, p. 355-359, 1981.
FRYIRS, K. (Dis) Connectivity in catchment sediment cascades: a fresh look at the sediment delivery problem.Earth Surface Processes and Landforms, v. 38, p. 30-46, 2013. FRYIRS, K. A. et al. Buffers, barriers and blankets: the (dis)
connectivity of catchment-scale sediment cascades.Catena, v. 70, p. 49-68, 2007.
IRVEM, A.et al. Estimating spatial distribution of soil loss
over Seyhan River Basin in Turkey.Journal of Hydrology, v. 336, p. 30-37, 2007.
JAMES, A. L.; ROULET, N. T. Investigating hydrologic connectivity and its association with threshold change in runoff response in a temperate forested watershed.
Hydrological Processes, v. 21, p. 3391-3408, 2007. LOPES, F. B et al.Uso de geoprocessamento na estimativa da perda de solo em microbacia hidrográfica do semiárido brasileiro.Revista Agro@mbiente On-line, v. 5, n. 2, p. 88-96, 2011.
LU, H. et al. Modelling sediment delivery ratio over the
Murray Darling Basin. Environmental Modelling & Software, v. 21, p. 1297-1308, 2006.
MEDEIROS, P. H. A.et al. Connectivity of sediment transport
in a semiarid environment: a synthesis for the Upper Jaguaribe Basin, Brazil.Journal of Soils and Sediments, v. 14, p.
1938-1948, 2014.
MEDEIROS, P. H. A. et al. Modelling spatio-temporal
patterns of sediment yield and connectivity in a semi-arid catchment with the WASA-SED model. Hydrological Sciences Journal, v. 55, p. 636-648, 2010.
PANDEY, A.et al. Identification of critical erosion prone areas in the small agricultural watershed using USLE, GIS and remote sensing. Water Resources Management, v. 21, p. 729-746, 2007.
PRASANNAKUMAR, V.et al. Estimation of soil erosion risk
within a small mountainous sub-watershed in Kerala, India, using Revised Universal Soil Loss Equation (RUSLE) and geo-information technology.Geoscience Frontiers, v. 3, n. 2, p. 209-215, 2012.
RAHMAN, M. R. et al. Soil erosion hazard evaluation-An
integrated use of remote sensing, GIS and statistical approaches with biophysical parameters towards management strategies.
Ecological Modelling, v. 220, p. 1724-1734, 2009.
RIBEIRO, L. S.; ALVES, M. G. Análise de suscetibilidade à erosão laminar no município de Campos dos Goytacazes/RJ através de técnicas de geoprocessamento.Estudos Geográficos (UNESP), v. 6, p. 89-100, 2008.
SANTOS, J. C. N.et al.Determinação do fator de cobertura
e dos coeficientes da MUSLE em microbacias no semiárido
brasileiro. Revista Brasileira de Engenharia Agrícola e Ambiental, v. 18, n. 11, p. 1157-1164, 2014.
SANTOS, J. C. N. et al. Runoff and soil and nutrient losses in
semiarid uncultivated fields.Revista Ciência Agronômica, v. 42, p. 813-820, 2011.
SILVA, R. M.et al.Predicting soil erosion and sediment yield
in the Tapacurá Catchment, Brazil. Journal of Urban and Environmental Engineering, v. 8, n. 1 p. 75-82, 2014. WILLIAMS, J. R.; ARNOLD, J. G. A system of erosion -sediment yield models.Soil Technology, v. 11, p. 43-55, 1997. WISCHMEIER, W. H.; SMITH, D. D. Predicting rainfall erosion losses: a guide to conservation planning.Washington: United States Department of Agriculture, 1978. 58 p.
ZHOU, W.; WU, B. Assessment of soil erosion and sediment delivery ratio using remote sensing and GIS: a case study of upstream Chaobaihe River catchment, north China.
International Journal of Sediment Research, v. 23, p.