Modeling the influence of production and storage conditions on
the blueberry quality
Raquel P. F. Guiné
1,2*, Susana Matos
2, Christophe Gonçalves
2,
Fernando Gonçalves
1,2, Daniela V. T. A. Costa
3, Mateus Mendes
4,5 (1. CI&DETS Research Centre/ESAV, Polytechnic Institute of Viseu, Campus Politécnico, Repeses, 3504-510, Viseu, Portugal; 2. Department of Food Industry, ESAV, Polytechnic Institute of Viseu, Quinta da Alagoa, Ranhados, 3500-606, Viseu, Portugal; 3. Department of Ecology and Sustainable Agriculture, ESAV, Polytechnic Institute of Viseu, Quinta da Alagoa, Ranhados,3500-606, Viseu,, Portugal;
4. Polytechnic Institute of Coimbra, ESTGOH, Rua General Santos Costa, n.º 4, 3400-124, Oliveira do Hospital, Portugal; 5. Institute of Systems and Robotics, FCTUC-DEEC, University of Coimbra, Pólo II - Pinhal de Marrocos, 3030-290, Portugal)
Abstract: Blueberry is a widely consumed fruit with major economic value, appreciated due to its characteristic flavor as well
as health benefits. The present work aimed to evaluate the effect of several production factors and storage conditions on some chemical and physical properties of blueberries. Some physical and chemical characteristics (moisture, acidity, sugars, color and texture) of blueberries from three cultivars, originating from five different locations and conventional or organic farming, were evaluated. The variation of the properties along time was also evaluated for storage at room temperature and refrigeration. Moreover, artificial neural network models were developed to estimate the physical-chemical characteristics of the blueberries, as influenced by the production and conservation factors considered. The results showed that all the characteristics considered varied according to cultivar, place of cultivation and production mode. The storage conditions also induced changes in the chemical components as well as in color and texture. The changes were dependent on type and duration of storage, cultivar and production mode. Weight analysis of the artificial neural network models highlighted the patterns and trends observed experimentally.
Keywords: artificial neural network, conservation, color, production mode, texture
Citation: Guiné, R. P. F., S. Matos, C. Gonçalves, F. Gonçalves, D. V. T. A. Costa, and M. Mendes. 2018. Influence of
production and conservation conditions on the physical-chemical properties of blueberry with modeling through artificial neural networks. Agricultural Engineering International: CIGR Journal, 20(2): 226–238.
1 Introduction
Blueberries (Vaccinium corymbosum) are presently one of the most valuable fruits around the world because of their organoleptic characteristics as well as nutritional properties and health benefits. In fact, blueberries are among the fruits that are best recognized for their potential health benefits, being notorious for their bioactive components, particularly those with antioxidant
Received date: 2017-11-05 Accepted date: 2016-12-17 *Corresponding Author: Raquel P. F. Guiné, Department of
Food Industry, Agrarian School of Viseu, Quinta da Alagoa, Ranhados, 3500-606 Viseu, Portugal. Tel: +351232446641. Email: [email protected].
capacity (Wu et al., 2011; Zielinska and Markowski, 2012). Blueberry has been used in folk medicine for their contribution in anti-diabetic activity (Roopchand et al., 2013), and scientific studies have demonstrated that they improve insulin sensitivity in insulin-resistant subjects (Stull et al., 2010).
Blueberries contain a wide variety of phenolic compounds, including 27 identified different anthocyanins (the major biological components of blueberries) together with proanthocyanidins, cyanidin, malvidin glycosides and chlorogenic acids, which all contribute to the high antioxidant activity of the fruit. This antioxidant potential contributes to cardiovascular health, improves vision, and inhibits carcinogenesis and
mutagenesis (Pervin et al., 2016; Wu et al., 2011; Zielinska and Markowski, 2012). Furthermore, besides antioxidant capacity, studies have proven that blueberry polyphenols have anti-inflammatory and cardioprotective properties (Roopchand et al., 2013). Blueberries also contain dietary fibre, which may have beneficial effects on metabolism and on intestinal function (Bränning et al., 2009; Pervin et al., 2016).
Nonetheless, starting right at the moment of harvest, blueberries are very susceptible to structural, nutritional and biochemical changes, which have a strong impact on product quality and shelf-life. These postharvest modifications can be accelerated by water loss and action of microorganisms, mostly by fungal outbreaks (Vieira et al., 2016; Yang et al., 2014). Because they are perishable and susceptible to rapid spoilage, storage conditions are of utmost importance to maintain the desired product characteristics (Chen et al., 2015).
This work intended to evaluate the effect of several production factors (production mode: organic, conventional; cultivar: Duke, Bluecrop, Ozarkblue; geographical origin; altitude of the farm; age of the bushes) on some chemical components (moisture content, total soluble solids and acidity) and physical properties (colour and texture). Furthermore, this study was also complemented with the evaluation of the changes along storage (up to 14 days at room temperature and under refrigeration) in some of the properties analysed. Moreover, artificial neural network (ANN) models were created and analysed to estimate the physical-chemical characteristics of the blueberries as influenced by the production and conservation factors considered.
2 Material and methods
2.1 SamplingThree varieties of Northern Highbush blueberries were evaluated (Duke – DK, Bluecrop – BC, Ozarkblue – OZ). The blueberries were originating from conventional production mode (CP) and also from organic farming (OF). The samples were obtained from farms located in the North-Centre region of Portugal (Braga – BR, Estarreja – ES, Oliveira do Hospital – OH, Sever do Vouga – SV and Vouzela – VZ) (Table 1). The fruits were harvested in full maturity state, as the berries are
normally marketed, corresponding to complete colour development and without loss of turgor. Approximately 1 kg of berries of each cultivar, selected randomly from several plants in different parts of the same field, was collected for the experiments.
Table 1 Production conditions of the blueberries Location of the farm placement (m) Altitude of bushes (years)Age of the Sever do Vouga (Conventional production) 460 20 Sever do Vouga (Organic farming) 525 20
Estarreja 45 4
Oliveira do Hospital 510 21
Vouzela 450 4
Braga 125 28
2.2 Handling and conservation
After harvesting, the samples were transported to the laboratory in appropriate plastic cuvettes refrigerated and protected from light, inside a thermal opaque container.
The properties were then evaluated in the fresh samples and also after storage. The samples were kept for 7 and 14 days under refrigeration at a temperature of 4ºC and 85% to 90% relative humidity (RH). Finally, the properties were also evaluated for storage at room temperature (around 15ºC to 25ºC and 30% to 60% RH).
2.3 Evaluation of chemical properties
Moisture content was determined by a Halogen Moisture Analyzer HG53 from mettle Toledo. The operating conditions were the following: heat source - halogen lamp; drying temperature - 120°C; speed of
drying - 3 (intermediate) (Guiné et al., 2011). The
number of repetitions for each sample was four independent measurements.
The acidity determination was carried out according to the methods of the Association of Official Analytical Chemists (AOAC, 2016). For these determinations three repetitions were made.
For determining total sugars, the sample was prepared by the same procedure as for acidity. Total sugars were determined as approximation to total soluble solids by refractometry and the Brix graduation was measured using a refractometer Atago 3T (Guiné et al., 2015). In all cases three replicates were made.
2.4 Evaluation of physical properties
2.4.1 Color
handheld tristimulus colorimeter (Chroma Meter - CR-400, Konica Minolta) in the CIE Lab color space, through the Cartesian coordinates L*, a* and b*. The L* axis represents Lightness and varies from 0 (corresponding to no lightness, i.e., absolute black), to 100, which is maximum lightness (i.e. absolute white). The other axes are represented by a* and b* and they are at right angles to each other. The a* axis varies from green at one extremity (represented by –a) to red at the other (+a), whereas the b* axis varies from blue at one end (–b), to yellow (+b) at the other. Although in theory there are no extreme values of a* and b*, in practice they can frequently be numbered from –60 to +60. For each sample 55 berries were examined.
For the measurements similar light conditions were used for all samples, namely by avoiding direct sunlight and controlling the incidence of artificial light. The calibration was made using a white tile, and the illuminant used was D65.
The total color difference (TCD), was the variable considered for the overall color difference evaluation, between a sample and the reference (fresh berries). A larger total color difference denotes greater color change from the reference material (Guiné and Barroca, 2012). TCD can be calculated by the following equation (Cruz et al., 2015; Guiné et al., 2014; Guiné and Barroca, 2014):
* * 2 * * 2 * * 2
0 0 0
( ) ( ) ( )
TCD= L −L + a −a + b −b (1)
where, L0*, a0*, b0* are the color coordinates for the
reference sample. 2.4.2 Texture
To determine the texture attributes (firmness and elasticity), 55 representative berries from each sample were randomly selected. The analyzes were performed with a texturometer TA.XT Plus, from Stable Micro Systems, that measured the compression force with a probe of 2 millimeters (P/2) (Figure 1(a)), with the following test conditions: pre-test speed = 1.50 mm s-1, test-speed = 1.00 mm s-1, post-test speed = 1.00 mm s-1, distance = 6 mm, trigger force = 0.05 mm and a load cell of 50 kg. For the texture analysis for each sample 30 measurements were made in different berries. The results were processed using Exponent software TEE (Stable Micro Systems) and from the obtained texture profile
(Figure 1(b)) firmness was determined as strength at the highest peak and elasticity as distance at the highest point.
(a) Evaluation of texture on a blueberry fruit
(b) Example of a texture profile analysis for blueberry
Figure 1 Texture measurement result
2.5 ANN modeling
An ANN is an interconnected association of artificial neurons. The input for each neuron can be one or more variables. The value of each input is multiplied by a corresponding weight and possibly summed to a bias value. The output of each neuron is, therefore, a function of the weighted inputs. Neurons are trained by adjusting the weights of the input variables, in a way that the error between the neuron’s expected output and the measured output value is minimized. The weights learnt by the neural network during training are an indication of the relevance of each variable for the output. The analysis of the weights, therefore, gives a wealth of information about the contribution of each input to the final output. This method is useful as a data mining technique for finding patterns and correlations in some types of datasets, such as the present laboratorial experiments.
2.5.1 Architecture of the ANN used
The ANN used is a feed-forward model, created using Matlab™ (Matlab is a registered trademark of Mathworks. www.mathworks.com.) fitnet function. The fitnet function is optimised for data fitting of datasets such as the ones used in the present work. A sigmoidal transfer function, which is a universal approximator, was used in the hidden layer. A linear transfer function was used in the output layer. Training was performed using the Levenberg-Marquartd method. The mean squared error (MSE) method was used for performance assessment. Performance of the models was also assessed by calculating the correlation factor between values predicted by the neural networks and the values measured in the laboratory.
For simplicity of the analysis, each output variable was studied separately. An ANN model was created for predicting each output variable. All ANNs had just two neurons: one in the hidden layer and the other in the output layer. Hence, the number of weights to analyse for each output variable was equal to the number of input variables, which are inputs to the first neuron, plus 1 weight which is the input to the output neuron. Figure 2 illustrates the architecture of one ANN used.
Figure 2 Architecture of an artificial neural network
2.5.2 Characterization of the datasets and variables Neural networks work based on inductive reasoning. Therefore, in general, more samples used for training produce better models and the confidence in the results increases. In the present work, the number of experimental results available varied for different output variables. Table 2 summarises the number of samples used for each variable.
Table 2 Number of samples available for each output variable
Number Output Variable
81 Moisture
63 Acidity, Sugars
1160 L*, a*, b*
1132 Firmness, Elasticity
For each run, the Matlab script randomly selected approximately 70% of the samples for the train subset, 15% for the validation subset and the remainder samples were used for the test subset.
Table 3 summarises the input variables, which were split into a total of 15 variables for better neural network fitting and analysis. Age of the bushes, altitude of the farm and storage time were floating point numbers normalised in the interval [0, 1]. All the other variables were Boolean.
Table 3 Encoding of the input variables Input # Input Variable Description
1-5 SV, ES, OH, VZ, BR Origin (Sever do Vouga, Estarreja, Oliveira do Hospital, Vouzela, Braga) 6-8 B, D, O Cultivar (Bluecrop, Duke, Ozarkblue)
9 A Age of the bushes normalized into [0, 1] 10 H Altitude of the farm normalized into [0, 1] 11-12 CP, OF Production mode (Conventional production,
Organic farming)
13-14 RT, REF State (Room temperature, Refrigerated) 15 ST Storage time normalised into [0, 1]
The result of the learning process depends on some random values. Namely, the convergence of the model can be faster, slower or totally impaired depending on the initial weights and bias of each neural connection, as well as the subset of samples selected for training, testing and validation. Therefore, the final results obtained usually differ between experiments, because the starting point and data may also differ.
The best neural network models will produce the best correlations between values predicted by the neural network and the experimental values measured in the laboratory. In the present work, the performance of the models is measured using the correlation factor (R) and MSE.
For better confidence in the analysis, different experiments were performed in the present study. For each output variable, one hundred different models were created. The results were sorted by the correlation factor R, from best to worst. The five best models were then selected for further analysis.
The neurons’ input weights can be positive or negative. A positive weight means that the input variable contributes more to the output of that neuron. In a network with two neurons, if the second neuron also receives a negative weight, that inverts the result which
comes from the first layer. Therefore, in the present analysis the signals of the input weights were mirrored when the weight of the second neuron was negative. The weights were also normalized into the interval [–1, 1]. The results shown are the average of the 5 best models, after this post-processing.
3 Results and discussion
3.1 Chemical propertiesSome chemical properties of the blueberries were evaluated for samples corresponding to different production conditions as well as different storage conditions. The results for moisture content, acidity and
total sugars are shown in Table 4. The values of moisture content at harvest varied from 75.80% for blueberries from Sever do Vouga, cv. Bluecrop, cultivated in organic farming, up to 82.79% for berries cv. Bluecrop cultivated in Braga in conventional agriculture. These values are in accordance with those reported by Prior et al. (1998), according to which blueberries of the same cultivar have 24.1% dry matter corresponding to 75.9% moisture. Also Díaz et al. (2011) evaluated moisture content in blueberries from cultivars Duke and Briggitte harvested in Chile, and found values just slightly higher (about 84%) than those encountered in this work. In the study by Skupien (2006) the moisture content was 84%.
Table 4 Chemical properties of the blueberries according to production and storage conditions
Production Storage Chemical properties
Origin1 Cultivar2 Mode3 Condition4 Time (days) Moisture content (%) Acidity (mg citric acid/100 g) Sugars5 (g sucrose/ 100 g) ES B CP HARV 0 76.17±1.64 0.56±0.07 14.65±0.48 OH B CP HARV 0 76.59±0.88 0.79±0.04 9.30±1.09 VZ B CP HARV 0 77.91±3.61 0.62±0.07 13.64±0.88 BR B CP HARV 0 82.79±0.17 0.75±0.10 13.05±0.26 SV B CP HARV 0 77.60±2.71 0.71±0.08 12.16±0.63 SV B OF HARV 0 75.80±3.08 0.83±0.07 10.31±2.05 SV D CP HARV 0 78.31±3.59 0.77±0.07 12.51±0.21 SV D CP RT 7 82.55±7.02 0.79±0.03 9.83±1.03 SV D CP RT 14 82.54±5.29 0.88±0.04 9.69±1.09 SV D CP REF 7 81.51±7.47 0.81±0.10 11.58±1.74 SV D CP REF 14 81.91±4.43 0.92±0.08 9.51±2.18 SV D OF HARV 0 79.05±2.11 0.47±0.03 14.38±0.85 SV D OF REF 7 83.62±3.71 0.66±0.03 12.69±1.13 SV D OF REF 14 78.08±4.81 0.66±0.03 12.72±0.95 SV O CP HARV 0 81.24±2.34 1.02±0.07 7.37±0.48 SV O CP REF 7 80.05±1.83 0.88±0.04 9.48±0.81 SV O CP REF 14 79.10±2.78 0.98±0.03 7.63±0.61 SV O OF HARV 0 81.00±4.31 0.88±0.04 9.32±1.49 SV O OF REF 7 79.59±4.49 0.72±0.04 11.30±1.45 SV O OF REF 14 73.36±1.89 0.68±0.03 12.87±1.05
Note: 1 Origin: Braga – BR, Estarreja – ES, Oliveira do Hospital – OH, Sever do Vouga – SV, Vouzela – VZ; 2 Cultivar: Bluecrop – B, Duke – D, Ozarkblue – O;
3 Mode: Conventional Production – CP, Organic farming – OF;
4 Condition: At harvest – HARV, Room temperature (ambient) – RT, Refrigeration – REF; 5 Sugars measured as soluble solids content.
The values of acidity at harvest were found to vary between 0.47 mg/100 g (expressed in malic acid), for blueberries from cv. Duke produced in Sever do Vouga in organic farming, and 1.02 mg/100 g, for cv. Ozarkblue from the same origin but produced in conventional agriculture. Zheng et al. (2003) obtained for cv. Duke at harvest a value of 0.82%, for titratable acidity (TA).
The total sugars were determined by approximation as the total soluble solids content (TSS) and varied at harvest from 7.37 to 14.65 g sucrose/100 g, respectively for blueberries from cv. Ozarkblue cultivated in Sever do Vouga and cv. Bluecrop cultivated in Estarreja, both in conventional production mode. Gündüz et al. (2015) evaluated the soluble solids content in blueberries from
cv. Bluecrop in three consecutive harvest years (2010 to 2012), and reported values between 12.5% and 13.4%. Also, Castrejón et al. (2008) studied the evolution of soluble solids content during ripening of Bluecrop blueberries and found values around 14% at the end of maturation.
Considering the maturation index (MI) as the ratio between TSS and TA, at harvest the values in the present work varied in the ranges 6.51-22.03, 16.32-30.06 and 7.20-10.63 for cvs. Bluecrop, Duke and Ozarkblue, respectively. Hancock et al. (2008) reported values of MI of about 11.3 for cv. Elliot and Castrejón et al. (2008) studied the variation in MI along ripening and verified an increase from 5 to 22 at the end of maturation.
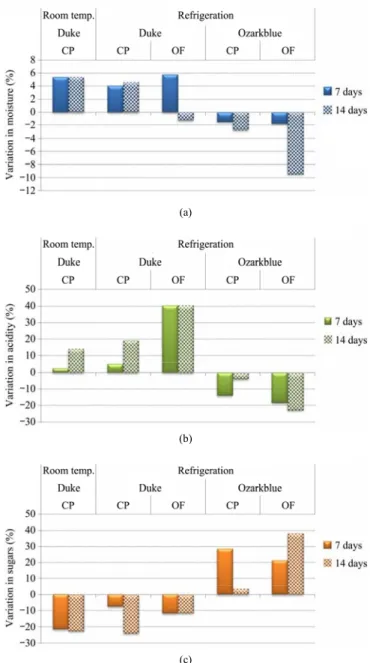
Regarding the effect of storage conditions on the chemical properties evaluated, to calculate the variation the reference samples were always those with the same conditions (same origin, same cultivar and same production mode) considered at harvest, i.e., at day zero. The results for the variations in moisture content along 14 days of storage are shown in Figure 3(a) and they reveal that while for cv. Duke there was a trend to increase by about 3% (on average) after the 14 days either at room temperature or under refrigeration, for cv. Ozarkblue the moisture diminished by about 6% (on average) during the same period under refrigeration. Although this increase might be natural when the berries were stored under refrigeration at an atmosphere of 85% to 90% RH, in the case of ambient temperature it should not happen considering the RH of the surrounding atmosphere (30% to 60% RH). Hence, the observed increase might be due to experimental error in the measurements or a possible influence of other food materials stored near the berries.
Figure 3(b) shows the variation of acidity along storage for blueberries from cultivars duke and Ozarkblue. Again, the trends observed for both cultivars are opposite, with an increase in acidity of about 25% for cv. Duke and a decrease of about 13% for cv. Ozarkblue. As the results in Figure 3(c) confirm, the differences between these two cultivars regarding the variation of TSS along storage are again opposite, showing an increase of 21% for cv. Ozarkblue and a decrease of 19% for cv. Duke. The results for acidity and TSS are consistent, since they vary in an inverse proportion to each other. Regarding the
storage temperature, no marked changes were found in the moisture, acidity or TSS for the blueberries cv. Duke from conventional agriculture when stored for 14 days at room temperature or under refrigeration. Vieira et al. (2016) reported the variations in TSS for blueberries cv. Duke also produced in Sever do Vouga, Portugal, stored under refrigeration (∼5ºC, ∼90% RH) as being quite minimal during the first 14 days (varying from ~11.5% to ~12%) and just slightly higher in the next 10 days, reaching a value of about 13% at the 25th day of storage. In the same study, the authors observed a decrease in TA from ~0.5% at day 0 to ~0.15% at day 25, for the same blueberry cultivar under the same storage conditions. Furthermore, the authors also reported weight losses of about 6% during the 25 days under refrigeration.
(a)
(b)
(c)
Figure 3 Variation of moisture (a), acidity (b) and sugar content (c) along storage
The increase in the sugar concentration observed for cv. Ozarkblue could be due to an effect of sugar concentration as a result of water loss by dehydration, originating apparent changes in TSS that could be incorrectly interpreted as a true change in the amount of sugars present on fruits (Olivas and Barbosa-Cánovas, 2005). However, other possible explanation, as advanced by Duan et al. (2011), is that during postharvest storage the metabolism of acids in the fruits converted starch and acids into sugars, thus resulting in the decrease of TA values and increase of TSS.
3.2 Physical properties
3.2.1 Color
The Cartesian colour coordinates (L*, a*, b*) for the blueberries evaluated with the peel are shown in Table 5. Lightness (L*) presents for the blueberries at harvest values from 31.08 to 38.56, indicating a marked darkness, given that the values are clearly closer to 0 (black) than to 100 (white). The colour coordinate a* represents red
when positive and green when negative, and in the present work the values found for the samples analysed were pretty close to zero (varying from –0.21 to +0.62 at harvest), indicating that none of these colours is meaningful in blueberries. Negative values of b* are indicative of blue colour (in detriment of yellow colour which corresponds to positive values of b*). The samples analysed in this work shows values of b* at harvest in the range from –8.21 to –4.93, indicative of blue, although not too intense. These values obtained for the colour coordinates are in accordance with those from Saftner et al. (2008) and Silva et al. (2005). Also, Giovanelli and Buratti (2009) evaluated the colorimetric parameters for blueberries from cv. Bluecrop, and registered values of 34.9, 0.74 and –3.26, respectively for L*, a* and b*. However, higher values of lightness were reported by Matiacevich et al. (2011) for blueberries from cvs. Star, Centurio, Elliot, Briggitte and Duke, with L* varying from 60 to 70.
Table 5 Color coordinates of the blueberries according to production and storage conditions
Production Storage Colour coordinates
Origin1 Cultivar2 Mode3 Condition4 Time (days) L* a* b*
ES B CP HARV 0 36.38±2.54 0.09±0.38 –7.77±1.19 OH B CP HARV 0 34.56±2.00 0.31±0.43 –7.76±0.88 VZ B CP HARV 0 36.79±3.14 –0.02±0.46 –7.32±1.20 BR B CP HARV 0 31.08±2.67 0.62±0.91 –5.02±1.51 SV B CP HARV 0 33.85±4.19 0.52±0.93 –6.17±1.86 SV B OF HARV 0 35.59±1.88 0.60±1.18 –8.21±0.90 SV D CP HARV 0 33.15±2.69 0.54±1.33 –5.48±1.27 SV D CP RT 7 31.58±2.28 0.00±0.40 –4.93±1.34 SV D CP RT 14 31.78±2.26 0.08±0.53 –4.80±0.37 SV D CP REF 7 30.64±2.04 0.39±0.61 –4.70±1.01 SV D CP REF 14 31.08±2.77 0.73±1.59 –5.04±1.42 SV D OF HARV 0 34.39±2.07 –0.21±0.29 –6.61±0.89 SV D OF REF 7 36.02±2.29 –0.56±0.24 –7.31±1.02 SV D OF REF 14 35.74±4.79 –0.11±1.46 –7.43±2.08 SV O CP HARV 0 38.56±2.50 –0.05±0.52 –8.01±0.88 SV O CP REF 7 35.40±2.86 0.34±0.74 –7.14±1.20 SV O CP REF 14 34.17±3.07 0.60±0.58 –6.31±1.31 SV O OF HARV 0 38.56±2.50 –0.05±0.52 –8.01±0.88 SV O OF REF 7 37.10±3.37 1.95±2.43 –6.35±1.38 SV O OF REF 14 35.85±3.27 1.27±1.40 –6.65±0.98
Note: 1 Origin: Braga – BR, Estarreja – ES, Oliveira do Hospital – OH, Sever do Vouga – SV, Vouzela – VZ; 2 Cultivar: Bluecrop – B, Duke – D, Ozarkblue – O; 3 Mode: Conventional Production – CP, Organic farming – OF; 4 Condition: At harvest – HARV, Room temperature (ambient) – RT, Refrigeration – REF.
To assess the variation in colour along storage, the TCD was calculated, considering as reference the samples with the same conditions (same origin, same cultivar and same production mode) but at harvest, i.e., without
storage. Figure 4 shows the values of colour change for samples from cvs. Duke and Ozarkblue stored at room temperature and under refrigeration for a period of 14 days. A higher change in colour was observed for cv.
Ozarkblue (3.3 on average after 14 days under refrigeration) when compared with cv. Duke (1.9) for the same storage conditions and time. On the other hand, in general, the TCD was slightly lower when the blueberries were stored at room temperature (TCD = 1.6) than when kept under refrigeration. These results indicate that the overall colour of the blueberries does not markedly change with storage. Zheng et al. (2003) studied the storage of blueberries cv. Duke under refrigeration (at 5ºC) for different atmospheres, and the reported values of the colour coordinates allowed calculating the TCD. In this way, for a period of 14 days of storage under refrigeration with atmospheric air the TCD was 2.96
while for a 100% O2 atmosphere was 2.76. Also,
Schotsmans et al. (2007) observed that the overall colour parameters did not change over a 28 days period of storage under refrigeration at 1.5ºC with regular or controlled atmosphere.
Figure 4 Total color difference for the stored samples (CP – conventional production, OF – organic farming)
3.2.2 Texture
Firmness is one of the most important quality attributes that has a great influence on consumer acceptability of fresh blueberries, thus being pivotal for the commercialization of these fruits (Paniagua et al., 2013). Table 6 shows the textural properties (firmness and elasticity) of the berries evaluated in the present study. The results showed that at harvest the firmness varied from 1.12 N to 1.60 N. Chen et al. (2015) evaluated the firmness of blueberries cv. Brilliant at harvest and reported a value of about 1.3. N. Paniagua et al. (2013) reported for blueberries Rabbiteye at harvest a value of firmness of 1.74 N. The values encountered in the present work are similar to those reported by the authors cited. Regarding elasticity for the blueberries at harvest, it ranged from 2.02 to 2.93 mm, respectively for
the samples of blueberries cv. Ozarkblue and cv. Bluecrop, in both cases for berries originating from Sever do Vouga and produced in organic farming.
Table 6 Textural properties of the blueberries according to production and storage conditions
Production Storage Chemical properties Origin1 Cultivar2 Mode3 Condition4 Time
(days) Firmness (N) Elasticity (mm) ES B CP HARV 0 1.50±0.25 2.51±0.49 OH B CP HARV 0 1.22±0.17 2.18±0.41 VZ B CP HARV 0 1.44±0.21 2.51±0.42 BR B CP HARV 0 1.12±0.19 2.41±0.41 SV B CP HARV 0 1.18±0.18 2.47±0.63 SV B OF HARV 0 1.41±0.22 2.93±0.42 SV D CP HARV 0 1.70±0.16 2.89±0.42 SV D CP RT 7 1.40±0.32 2.83±0.50 SV D CP RT 14 1.34±0.37 2.99±0.77 SV D CP REF 7 1.90±0.20 3.15±0.45 SV D CP REF 14 1.99±0.28 3.97±0.68 SV D OF HARV 0 1.63±0.25 2.44±0.38 SV D OF REF 7 1.86±0.26 3.04±0.46 SV D OF REF 14 1.89±0.44 4.08±0.63 SV O CP HARV 0 1.40±0.25 2.19±0.45 SV O CP REF 7 1.53±0.34 2.32±0.39 SV O CP REF 14 1.50±0.45 2.99±0.71 SV O OF HARV 0 1.36±0.17 2.02±0.36 SV O OF REF 7 1.71±0.33 1.97±0.26 SV O OF REF 14 1.57±0.48 2.43±0.60 Note: 1 Origin: Braga – BR, Estarreja – ES, Oliveira do Hospital – OH, Sever do Vouga – SV, Vouzela – VZ;
2 Cultivar: Bluecrop – B, Duke – D, Ozarkblue – O;
3 Mode: Conventional Production – CP, Organic farming – OF;
4 Condition: At harvest – HARV, Room temperature (ambient) – RT, Refrigeration – REF.
The variations in the textural parameters along storage are shown in Figure 5, and they are calculated using as reference the samples at harvest with the same conditions (same origin, same cultivar and same production mode). While the blueberries kept at room temperature showed a decrease of 21% in firmness after 14 days, those kept under refrigeration all showed increasing firmness during the storage period considered (Figure 5(a)). Paniagua et al. (2013) stored blueberries Rabbiteye at 4ºC for a period of 21 days and they observed that after 7 days there was an increase in firmness of 14% and after the 21 days the increase was 23%. Also, Schotsmans et al. (2007) reported a small increase in firmness of blueberries cv. Bluecrop along a storage period of 28 days under refrigeration at regular atmosphere, being the rate of increase 0.0068 N day-1. However, Chen et al. (2015)
evaluated the firmness of blueberries cv. Brilliant during 49 days of storage under refrigeration at 5ºC and observed that during the first 21 days the firmness remained approximately constant, but diminishing intensely thereafter. Figure 5(b) shows that elasticity was not affected by storage at room temperature and for the refrigerated blueberries there was an increase after 14 days of storage that was on average 52% for cv. Duke and 28% for cv. Ozarkblue.
(a) Firmness
(b) Elasticity
Figure 5 Variation of the textural properties along storage (CP – conventional production, OF – organic farming)
3.3 ANN modeling
3.3.1 Experimental results
Table 7 summarizes some performance parameters of the ANN models used. The correlation factors between experimentally measured outputs and the output predicted by the neural networks are in the range 0.404-0.767 for the whole dataset. Those correlations show that the models are not accurate predictors of the outputs based on the inputs. That is an expectable result, considering the variability of the parameters, even for berries from the same location. Nonetheless, the conclusions obtained by analysis of the input weights are still valid to find patterns in the data. The input weights should give useful information about the relevance of each input to each output.
Table 7 Performance of the ANN models, assessed as correlation factor R and MSE
R Variable
Train subset Test subset Validation subset All dataset MSE Moisture 0.681 0.452 0.692 0.670 5.332 Acidity 0.782 0.678 0.717 0.767 0.008 TSS sugar 0.771 0.677 0.729 0.765 1.866 L* 0.574 0.593 0.609 0.582 9.400 a* 0.402 0.391 0.434 0.404 1.038 b* 0.517 0.646 0.569 0.527 3.054 Firmness 0.623 0.655 0.579 0.621 0.082 Elasticity 0.685 0.648 0.697 0.682 0.288
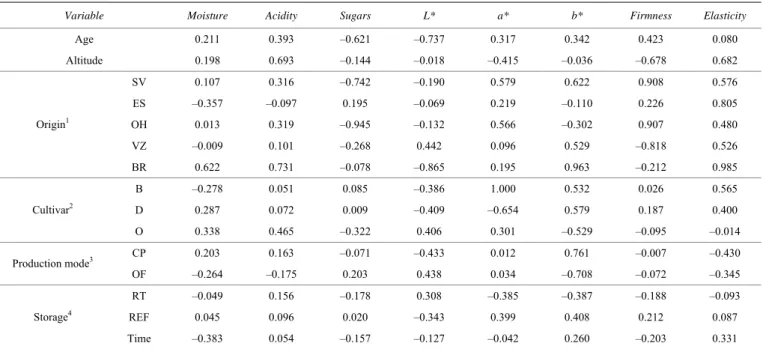
Table 8 shows the weights measured for each input variable, normalized into the interval [–1, 1] to facilitate the analysis. The sign of a weight is important to show whether the corresponding variable has a positive or a negative impact in the result. The absolute value predicts how important the variable is in the context. Inputs with low absolute values will be almost irrelevant to the output, while large absolute values imply a large influence of the corresponding input.
3.3.2 Analysis of the input neurons’ weights for moisture, acidity and sugars
From Table 8, it is possible to affirm that some variables have little influence on the amount of moisture measured. While the samples from Estarreja seem to have the lowest amount of moisture, those from Braga contain the highest amount. As for cultivar, Bluecrop shows a negative weight, thus pointing to lower moisture content. Duke and Ozarkblue, on the other hand, show significant positive weights. Age and altitude show weak correlations, captured by small input weights of 0.211 and 0.198. Nonetheless, those weights show that samples from older bushes at higher altitudes have higher amounts of moisture. The production mode also has some impact on the amount of moisture – input weights of 0.203 for conventional agriculture and –0.264 for organic farming show that samples from conventional agriculture have much higher amounts of moisture, when compared to organic farming. As for temperature, the absolute values of the weights are very small, less than 0.05. Opposite signs seem to indicate that storage at room temperature makes the samples lose some moisture, while refrigeration slightly increases the amount of moisture. As for time, a weight of –0.383 reveals that berries loses moisture when the time increases.
Table 8 Summary of the average input weights calculated for the ANN models produced for each output variable
Variable Moisture Acidity Sugars L* a* b* Firmness Elasticity
Age 0.211 0.393 –0.621 –0.737 0.317 0.342 0.423 0.080 Altitude 0.198 0.693 –0.144 –0.018 –0.415 –0.036 –0.678 0.682 SV 0.107 0.316 –0.742 –0.190 0.579 0.622 0.908 0.576 ES –0.357 –0.097 0.195 –0.069 0.219 –0.110 0.226 0.805 OH 0.013 0.319 –0.945 –0.132 0.566 –0.302 0.907 0.480 VZ –0.009 0.101 –0.268 0.442 0.096 0.529 –0.818 0.526 Origin1 BR 0.622 0.731 –0.078 –0.865 0.195 0.963 –0.212 0.985 B –0.278 0.051 0.085 –0.386 1.000 0.532 0.026 0.565 D 0.287 0.072 0.009 –0.409 –0.654 0.579 0.187 0.400 Cultivar2 O 0.338 0.465 –0.322 0.406 0.301 –0.529 –0.095 –0.014 CP 0.203 0.163 –0.071 –0.433 0.012 0.761 –0.007 –0.430 Production mode3 OF –0.264 –0.175 0.203 0.438 0.034 –0.708 –0.072 –0.345 RT –0.049 0.156 –0.178 0.308 –0.385 –0.387 –0.188 –0.093 REF 0.045 0.096 0.020 –0.343 0.399 0.408 0.212 0.087 Storage4 Time –0.383 0.054 –0.157 –0.127 –0.042 0.260 –0.203 0.331 Note: 1 Origin: Braga – BR, Estarreja – ES, Oliveira do Hospital – OH, Sever do Vouga – SV, Vouzela – VZ; 2 Cultivar: Bluecrop – B, Duke – D, Ozarkblue – O; 3 Mode: Conventional Production – CP, Organic farming – OF; 4 ConditionRoom temperature (ambient) – RT, Refrigeration – REF; Storage time – Time.
As for acidity, the models show that locations Braga, followed by Oliveira do Hospital and Sever do Vouga, have the strongest influence on the berries. Regarding the cultivar, Ozarkblue clearly shows the highest acidity. There is also a positive correlation captured, between acidity and age, and also altitude of the farm. Actually, altitude of the farm is the second highest weight, behind location Braga. In terms of production mode, conventional agriculture seems to produce the most acidic berries, while organic farming contributes with a negative weight.
As for total sugars, location Estarreja is the only one with a positive weight. All the other locations seem to contribute with negative weights, with Oliveira do Hospital and Sever do Vouga receiving the largest absolute values. There is a marginal positive contribution of the cultivar Bluecrop, while Ozarkblue seems to negatively impact the amount of sugars measured (weight –0.322). The amount of sugars measured also seems to decrease with age of the bushes: age is the third best predictor, with a weight of –0.612. Organic farming contributes to increased sugars, with a positive weight of 0.203. Storage at room temperature makes the amount of sugars decrease, as well as storage time.
3.3.3 Analysis of the input neurons’ weights for color Colour is very difficult to model, as shown by the correlation R obtained for L*, a* and b*. Nonetheless, the
neural input weights still capture the most remarkable patterns existing in the laboratorial data. Samples from Braga are darker than average, with an input weight of –0.865 for L*. Vouzela is the opposite, with an input weight of 0.442. The weights also show that Bluecrop and Duke, with negative weights for L* of –0.386 and –0.409, are darker than Ozarkblue, which has a positive weight of 0.406. As for age of the bush, the models show that older bushes produce the darkest berries. Altitude, on the other hand, seems to play no role on L*. Production mode, on the contrary, shows an important role – the models highlight a difference, with conventional farming receiving an input weight of –0.433 and organic farming receiving an input weight of 0.438. Refrigerated berries are also darker than those stored at room temperature. As for time, the impact seems to be very small, but berries should become slightly darker as time goes by, for it received a weight of –0.127.
Regarding a* and b*, the results show that samples from Braga have a less intense blue than average. Samples from Oliveira do Hospital are slightly reddish and intense blue, while those from Sever do Vouga are more reddish but less blue. As for cultivars Bluecrop and Duke are less blue when compared with Ozarkblue. Relating to age, older bushes seem to produce berries with stronger red and faintest blue colours. As for altitude,
b* is mostly indifferent to altitude, but the weight learnt to a* shows that altitude produces greener berries. As for production mode, a* is mostly indifferent to the mode, but b* shows that berries from organic farming have stronger blue, while berries from conventional agriculture have faintest blue. As for storage, berries stored at room temperature tend more to the blue and green colorations, while in the refrigerated berries the intensities of blue and green are lower. Regarding storage time, a* seems mostly unaffected, while b* shows the berries tend do decrease blueness.
3.3.4 Analysis of the input neurons’ weights for firmness and elasticity
Table 8 shows that locations Vouzela and Braga negatively impact the firmness of the berries – especially berries from Vouzela, which will have the lowest firmness, while Sever do Vouga and Oliveira do Hospital will have the highest. As for cultivar, Duke receives the largest positive weight, indicating a higher firmeness. Age of the bush also contributes positively to firmness – older bushes produce harder berries. Altitude of the farm, on the contrary, has a negative impact, so that berries from higher altitudes will be softer. Production mode has a very small impact on the firmness of the berries. Anyway, berries from organic farming will probably be slightly softer, with a negative weight of –0.072. As for storage mode, refrigeration seems to have a positive impact on firmness, while storage at room temperature has a negative weight, thus meaning that firmness decreases when at room temperature. As for time, increasing time reduces firmness, with time having a negative weight of –0.203.
As for elasticity, berries from Braga seem to be the most sensitive, with a weight of 0.985. Bluecrop and Duke cultivars receive input weights of 0.565 and 0.400, while elasticity is indifferent to Ozarkblue. Age of the bush also has a very small impact on elasticity: an input weight of 0.080 shows that older bushes will probably produce berries with marginally larger elasticity. Altitude of the farm, on the contrary, seems to be very important, with bushes at higher altitudes producing berries with higher elasticity. As for storage mode, storage at room temperature will decrease elasticity, while refrigeration
will increase it. Elasticity will also increase with storage time.
4 Conclusions
The results of this work showed that moisture, acidity and sugars contents, as well as colour and texture varied according to cultivar, place of cultivation and production mode. Berries from cv. Bluecrop originating from Estarreja and cultivated in conventional agriculture showed the highest sugar content at harvest while those from cv. Ozarkblue from sever do Vouga and conventional agriculture presented the highest acidity. Blueberries from cv. Ozarkblue became less acid and sweeter when refrigerated but those from cv. Duke presented an opposite trend. The colour also changed for the refrigerated as well as for the blueberries kept at room temperature, with higher colour change observed for cv. Ozarkblue. Regarding texture, the blueberries that at harvest showing higher firmness were those from cv. Duke, originating from Sever do Vouga and conventional production mode. The firmness was influenced by storage so that the berries became less firm when kept at room temperature but firmer when stored under refrigeration.
The quality parameters of the ANN models were modest. Therefore, those models might not predict with accuracy the exact output variables based on just those inputs. However, the results of neuron weight analysis confirmed the trends observed experimentally and captured important patterns to explain some of the results of the chemical and physical analyses.
References
AOAC. 2016. Official Methods of Analysis of AOAC International. 20th ed. Rockville, USA: Association of Official Analytical Chemists.
Bränning, C., Å. Håkansson, S. Ahrné, B. Jeppsson, G. Molin, and M. Nyman. 2009. Blueberry husks and multi-strain probiotics affect colonic fermentation in rats. British Journal of Nutrition, 101(6): 859–870.
Castrejón, A. D. R., I. Eichholz, S. Rohn, L. W. Kroh, and S. Huyskens-Keil. 2008. Phenolic profile and antioxidant activity of highbush blueberry (Vaccinium Corymbosum L.) during fruit maturation and ripening. Food Chemistry, 109(3): 564–572.
Chen, H., S. Cao, X. Fang, H. Mu, H. Yang, X. Wang, Q. Xu, and H. Gao. 2015. Changes in fruit firmness, cell wall composition and cell wall degrading enzymes in postharvest blueberries during storage. Scientia Horticulturae, 188: 44–48.
Cruz, A. C., R. P. F. Guiné, and J. C. Gonçalves. 2015. Drying kinetics and product quality for convective drying of apples (Cvs. Golden Delicious and Granny Smith). International Journal of Fruit Science, 15(1): 54–78.
Díaz, P., O. Henríquez, J. Enrione, and S. Matiacevich. 2011. Thermal transitions of pulp and cuticle of blueberries. Thermochimica Acta 525(1-2): 56–61.
Duan, J., R. Wu, B. C. Strik, and Y. Zhao. 2011. Effect of edible coatings on the quality of fresh blueberries (duke and elliott) under commercial storage conditions. Postharvest Biology and Technology, 59(1): 71–79.
Giovanelli, G., and S. Buratti. 2009. Comparison of polyphenolic composition and antioxidant activity of wild italian blueberries and some cultivated varieties. Food Chemistry, 112(4): 903–908.
Guiné, R. P. F., S. Pinho, and M. J. Barroca. 2011. Study of the convective drying of pumpkin (Cucurbita Maxima). Food and Bioproducts Processing, 89(4): 422–428.
Guiné, R. P. F., and M. J. Barroca. 2012. Effect of drying treatments on texture and color of vegetables (pumpkin and green pepper). Food and Bioproducts Processing, 90(1): 58–63. Guiné, R. P. F., F. Henriques, and M. J. Barroca. 2014. Influence of drying treatments on the physical and chemical properties of cucumber. Journal of Food Measurement and Characterization, 8(3): 195–206.
Guiné, R. P. F., and M. J. Barroca. 2014. Quantification of browning kinetics and colour change for quince (Cydonia Oblonga Mill.) exposed to atmospheric conditions. Agricultural Engineering International: CIGR Journal, 16(4): 285–298.
Guiné, R. P. F., I. C. Almeida, A. C. Correia, and F. J. Gonçalves. 2015. Evaluation of the physical, chemical and sensory properties of raisins produced from grapes of the cultivar Crimson. Journal of Food Measurement and Characterization, 9(3): 337–346.
Gündüz, K., S. Serçe, and J. F. Hancock. 2015. Variation among highbush and rabbiteye cultivars of blueberry for fruit quality and phytochemical characteristics. Journal of Food Composition and Analysis, 38: 69–79.
Hancock, J., P. Callow, S. Serçe, E. Hanson, and R. Beaudry. 2008. Effect of cultivar, controlled atmosphere storage, and fruit ripeness on the long-term storage of highbush blueberries. HortTechnology, 18(2): 199–205.
Matiacevich, S., P. Silva, J. Enrione, and F. Osorio. 2011. Quality assessment of blueberries by computer vision. In Proc. 11th International Congress on Engineering and Food (ICEF11),
421–425. Athens, Greece, 22-26 May.
Olivas, G. I., and G. V. Barbosa-Cánovas. 2005. Edible coatings for fresh-cut fruits. Critical Reviews in Food Science and Nutrition, 45(7-8): 657–670.
Paniagua, A. C., A. R. East, J. P. Hindmarsh, and J. A. Heyes. 2013. Moisture loss is the major cause of firmness change during postharvest storage of blueberry. Postharvest Biology and Technology, 79: 13–19.
Pervin, M., M. A. Hasnat, J. H. Lim, Y. M. Lee, E. O. Kim, B. H. Um, and B. O. Lim. 2016. Preventive and therapeutic effects of blueberry (Vaccinium Corymbosum) extract against DSS-induced ulcerative colitis by regulation of antioxidant and inflammatory mediators. The Journal of Nutritional Biochemistry, 28: 103–113.
Prior, R. L., G. Cao, A. Martin, E. Sofic, J. Mcewen, C. O´Brien, N. Lischener, M. Ehlenfeldt, W. Kalt, G. Krewer, and C. M. Mainland. 1998. Antioxidant capacity as influenced by total phenolic and anthocyanin content, maturity, and variety of Vaccinium species. Journal of Agricultural and Food Chemistry, 46(7): 2686–2693.
Roopchand, D. E., P. Kuhn, L. E. Rojo, M. A. Lila, and I. Raskin. 2013. Blueberry polyphenol-enriched soybean flour reduces hyperglycemia, body weight gain and serum cholesterol in mice. Pharmacological Research, 68(1): 59–67.
Saftner, R., J. Polashock, M. Ehlenfeldt, and B. Vinyard. 2008. Instrumental and sensory quality characteristics of blueberry fruit from twelve cultivars. Postharvest Biology and Technology, 49(1): 19–26.
Schotsmans, W., A. Molan, and B. MacKay. 2007. Controlled atmosphere storage of rabbiteye blueberries enhances postharvest quality aspects. Postharvest Biology and Technology, 44(3): 277–285.
Silva, J. L, E. Marroquin, F. B. Matta, J. O. Garner Jr, and J. Stojanovic. 2005. Physicochemical, carbohydrate and sensory characteristics of highbush and rabbiteye blueberry cultivars. Journal of the Science of Food and Agriculture, 85(11): 1815–1821.
Skupień, K. 2006. Evaluation of chemical composition of fresh and frozen blueberry fruit (Vaccinium Corymbosum L.). Acta Scientiarum Polonorum. Hortorum Cultus, 5(1): 19–25. Stull, A. J., K. C. Cash, W. D. Johnson, C. M. Champagne, and W.
T. Cefalu. 2010. Bioactives in blueberries improve insulin sensitivity in obese, insulin-resistant men and women. The Journal of Nutrition, 140(10): 1764–1768.
Vieira, J. M., M. L. Flores-López, D. J. de Rodríguez, M. C. Sousa, A. A. Vicente, and J. T. Martins. 2016. Effect of chitosan–Aloe vera coating on postharvest quality of blueberry (Vaccinium Corymbosum) fruit. Postharvest Biology and Technology, 116: 88–97.
of anthocyanins extract from blueberry on TNBS-Induced IBD model of mice. Evidence-Based Complementary and Alternative Medicine, 2011: article ID 525462.
Yang, G., J. Yue, X. Gong, B. Qian, H. Wang, Y. Deng, and Y. Zhao. 2014. Blueberry leaf extracts incorporated chitosan coatings for preserving postharvest quality of fresh blueberries. Postharvest Biology and Technology, 92: 46–53.
Zheng, Y., C. Wang, S. Wang, and W. Zheng. 2003b. Effect of high-oxygen atmospheres on blueberry phenolics, anthocyanins, and antioxidant capacity. Journal of Agricultural and Food Chemistry, 51(24): 7162–7169.
Zielinska, M., and M. Markowski. 2012. Color characteristics of carrots: effect of drying and rehydration. International Journal of Food Properties, 15(2): 450–466.