Smart Sustainable Cities Assessment
Adeoluwa Stephen Akande
A thesis submitted in partial fulfillment of the
requirements for the degree of Doctor in Information
Management
December 2019
NOVA Information Management School (IMS)
Information Management
Specialization in Geographic Information
Systems
Smart Sustainable Cities Assessment
Supervised by:
Professor Dr. Pedro da Costa Brito Cabral
NOVA Information Management School (NOVA IMS)
Universidade Nova de Lisboa
Lisboa, Portugal
Co-supervised by:
Professor Dr. Sven Casteleyn
Geospatial Technologies Laboratory
Universitat Jaume I
Castellon, Spain
Professor Dr. Edzer Pebesma
Institute of Geoinformatics
Westfälische Wilhelms-Universität
Munster, Germany
Copyright © by
Adeoluwa Stephen Akande
Abstract
There has been an exponential growth of cities in the last decade. Rural to urban migration are occurring at an unprecedented level. This is partly because cities serve as hubs of innovation offering numerous economic opportunities. However, this growth comes with its unique challenges some of which include strained mobility, pollution, growth of slums etc. The “smart cities” concept aims to address this with increased efficiency using a unique combination of data and technology in every aspect of the city. Even though it is believed that the smart cities concept inherently incorporates sustainability or ultimately leads to a more sustainable city, not all smart city concepts are aligned with sustainability targets. In this research, we provide a more holistic view studying the relationship between a “smart city” and a “sustainable city”. We conceptualised a framework to measure the connection between technology and environmental sustainability and categorised European cities based on this relationship. We provide a concise and clearer understanding of the drivers of the use of technology through the sharing economy to foster sustainability in cities by citizens. Using a weighting and meta-analysis of adoption theories, we laid the foundation for additional hypothesises which researchers can evaluate in future smart sustainable cities assessment studies and provided interesting insights for city councils and governments pushing for a citizen adoption of sustainable practices within their administrative boundaries. Lastly, we rank European capital cities based on how smart and sustainable they are using a composite index based on publicly available data. We also carried out a sensitivity analysis and validation study of our results.
Keywords:
Smart Cities, Sustainable Cities, Clustering, Sharing economy, Environmental sustainability.Original Contributions
Journal articles
• Akande, A., Cabral, P. and Casteleyn, S. (2019) ‘Assessing the Gap between Technology and the Environmental Sustainability of European Cities’, Information Systems
Frontiers. doi: 10.1007/s10796-019-09903-3.
• Akande, A. et al. (2019) ‘The Lisbon ranking for smart sustainable cities in Europe’, Sustainable Cities and Society, 44, pp. 475–487. doi:
https://doi.org/10.1016/j.scs.2018.10.009.
• Akande, A., Cabral, P. and Casteleyn, S. ‘Understanding the sharing economy and its implication on sustainability in smart cities’. (Submitted to a top journal in the area of information systems).
Conference papers
• Akande, A. (2018). Smart Sustainable Cities assessment framework. In S. Vinkor, P. Porycek, N. Edelmann, & O. Glassey (Eds.), Proceedings of the international
Conference EGOV-CeDEM-ePart 2018 (pp. 287-294). Krems: Edition Donau-Universitat Krems. Retrieved from
https://books.google.pt/books/about/Proceedings_of_the_International_Confere.htm l?id=NzVxDwAAQBAJ&redir_esc=y
Lead editor of Journal Special Issue
• Akande, A. et al. (Eds.) (2018). Open Data for Open Cities (OD4OC): Reuse of open data through spatial analysis [Special issue]. Information, XX (4).
Acknowledgements
To God almighty, who kept the space-time continuum stable for long enough to have my PhD work completed.
To my lovely family, Temitayo, my wife, and Lucian, my little child, you are both my world.
To my parents and parent-in-laws, for their kind words, encouragement and frequent calls. To Prof. Pedro Cabral, the main supervisor of this thesis, for all the guidance and mentorship.
To Prof. Sven Casteleyn, a co-supervisor of this thesis, for all the good advice to improve the quality of the articles that were published and help during my external semester in Castellon, Spain.
To all my colleagues who were kind enough to share their experience and skills with me: Fernando, Mijail, Marek, Sara and Albert.
To all of my friends who gave meaning to life outside work: Brian, Dami, Don, Jide, Yomi and others.
To the European Commission, for the financial support of the “Geoinformatics: Enabling Open Cities (GEO-C)” project within the Marie Skłodowska-Curie Actions, International Training Networks (ITN), and European Joint Doctorates (EJD). Grant Agreement number 642332 — GEO-C — H2020-MSCA-ITN-2014.
Table of Contents
Chapter 1 - Introduction ... 15
1.1 Background and motivation ... 15
1.2 Research focus ... 16
1.3 Research objectives ... 17
1.4 Research methodology ... 18
1.5 Study relevance and potential contributions ... 19
1.6 Path of research ... 20
Chapter 2 - Assessing the gap between Technology and the Environmental Sustainability of European Cities ... 23
2.1 Introduction ... 23
2.2 Literature Review ... 26
2.2.1 The “sustainability” concept ... 26
2.2.2 The “smart” concept ... 27
2.2.3 The “city” concept ... 27
2.2.4 The “smart sustainable city” concept ... 28
2.2.5 The link between ICT and environmental sustainability ... 28
2.3 Measuring the connection between ICT and environmental sustainability. ... 31
2.3.1 Conceptual Model ... 32
2.4 Methodology ... 34
2.4.1 Data ... 34
2.4.2 Exploratory data analysis ... 36
2.4.3 Principal component analysis (PCA) ... 36
2.4.4 Cluster analysis ... 37
2.5 Results ... 39
2.5.1 Exploratory Analysis ... 39
2.5.2 Principal Component Analysis ... 41
2.5.3 Clustering ... 43
2.5.4 Geographical Analysis ... 46
2.6 Discussion ... 47
2.6.1 Practical Implications ... 50
2.6.2 Limitations and future research ... 52
Chapter 3 - Understanding the sharing economy and its implication on sustainability in smart cities 54
3.1 Introduction ... 55
3.2 Research methodology ... 56
3.2.1 Literature search ... 57
3.2.2 Screening and Eligibility ... 59
3.2.3 Variable Synthesis ... 60 3.3 Results ... 61 3.3.1 Descriptive statistics ... 61 3.3.2 Weight analysis ... 63 3.3.3 Meta-analysis ... 64 3.4 Discussion ... 68 3.5 Implications ... 70 3.6 Conclusion ... 72
3.7 Limitations and future research ... 73
Chapter 4 - The Lisbon Ranking for Smart Sustainable Cities in Europe ... 74
4.1 Introduction ... 74
4.2 Data and methods ... 80
4.2.1 Study area ... 80
4.2.2 Data ... 81
4.2.3 Methods ... 82
4.3 Results and Discussion ... 85
4.3.1 Hierarchical clustering ... 85
4.3.2 Principal Component Analysis ... 87
4.3.3 Sensitivity Analysis ... 91
4.3.4 Rank score comparison with Gross Domestic Product (GDP) ... 93
4.3.5 Rank score comparison with geographical location ... 94
4.3.6 Rank score comparison with size and population ... 95
4.3.7 Further Discussion ... 96 4.4 Validation ... 96 4.5 Conclusions ... 98 Chapter 5 - Conclusions ... 100 5.1 Summary of findings ... 100 5.2 Contributions ... 101 5.3 Impact ... 102
5.4 Limitations and future research ... 103 References ... 106 Appendix ... 141 2.1 Appendix A ... 141 2.2 Appendix B ... 141 2.3 APPENDIX C ... 143 2.4 APPENDIX D ... 147 2.5 Appendix E ... 148 3.1 APPENDIX ... 148 4.1 APPENDIX A ... 151 4.2 APPENDIX B ... 166
List of Tables
Table 1-1. Methodological approach summary ... 19
Table 1-2. Match chapter - research article ... 20
Table 2-1: Acronyms, descriptions, year and literature support of variables ... 35
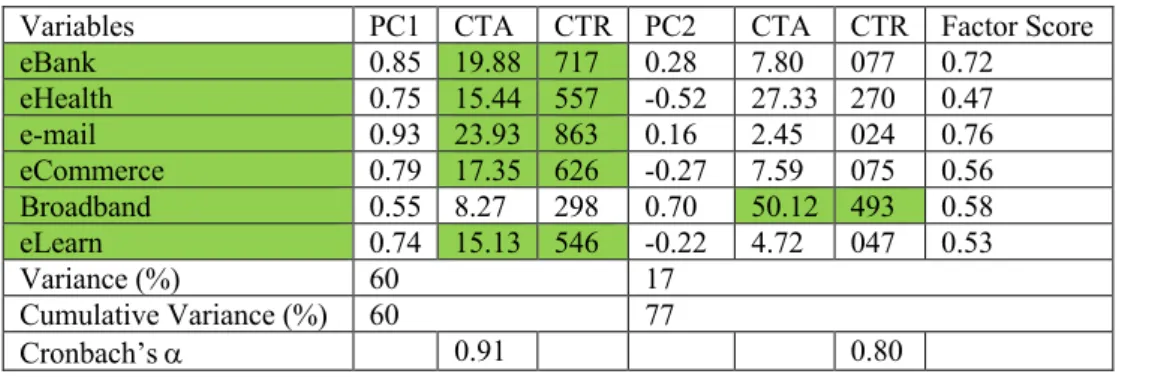
Table 2-2: Indicator Variable Loadings, CTA and CTR*1000 ... 42
Table 3-1: Categories of keywords used to search literature database ... 58
Table 3-2: List of literature used for meta-analysis (ordered by publication year, author) ... 60
Table 3-3: Summary of independent - dependent variable weight analysis results (ordered by frequency of use) ... 64
Table 3-4: Meta-analysis results (ordered by frequency) ... 65
Table 4-1: Data used ... 82
Table 4-2:Variables used in ranking ... 87
Table 4-3: Principal Component Eigenvalues ... 88
Table 4-4:Indicator Variable Loadings*1000, CTA, CTR*1000 and factor score*1000 ... 89
Table 4-5: Smart Sustainable City ranking and top three indicators that affects ranking ... 92
Table 4-6: Top 10 cities in four European ranking systems and their correlation with Smart Sustainable Cities Ranking ... 97
List of Figures
Figure 2-1: Conceptual Framework ... 34
Figure 2-2: Correlogram of ICT variables ... 41
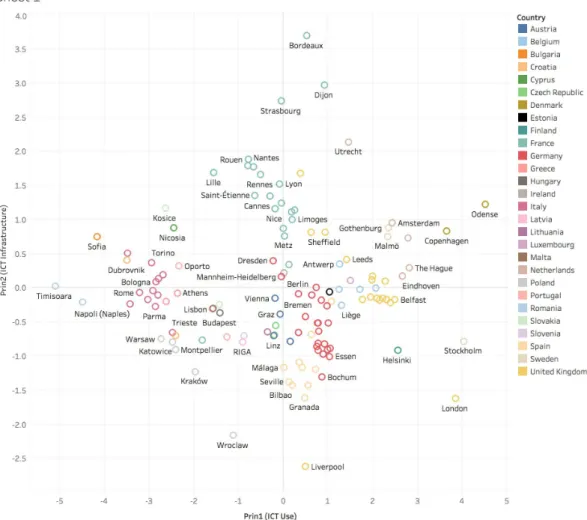
Figure 2-3: Cities ICT development coordinates on principal components ... 43
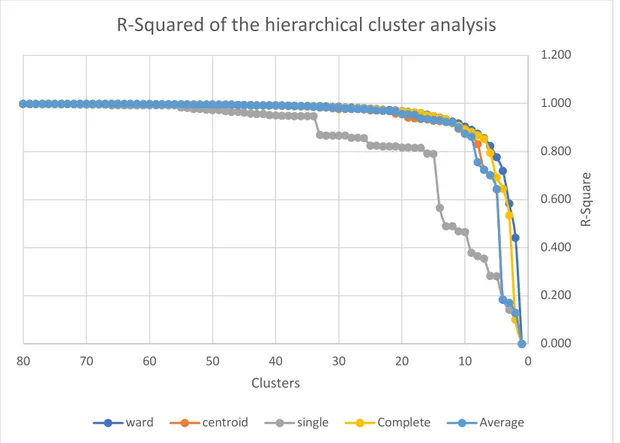
Figure 2-4: Comparison of the r-squared values of the hierarchical methods ... 44
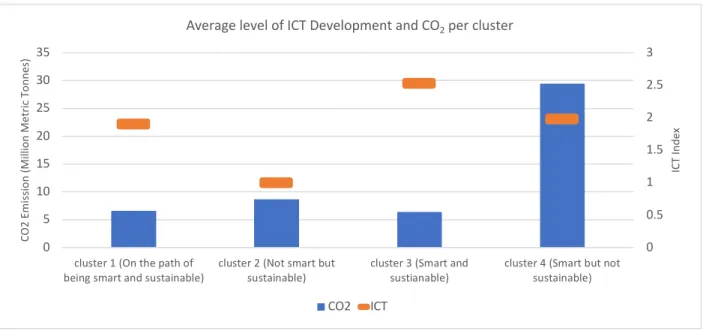
Figure 2-5: Average value of ICT development and CO2 emission in each cluster ... 45
Figure 2-6: European Map of its cities in terms of ICT and environmental sustainability ... 47
Figure 3-1: PRISMA data flow diagram for the systematic literature review (# means ‘number’) ... 57
Figure 3-2: Number of respondents in the 22 withheld articles (by year) ... 62
Figure 3-3: Spatial distribution of 8502 respondents in the 22 withheld articles ... 63
Figure 3-4: Forest plot of meta-analysis ordered by sample size ... 67
Figure 3-5: Model of drivers for the sharing economy resulting from weight analysis and meta-analysis; **p < 0.05 ... 67
Figure 4-1: Visual representation of the UNECE-ITU Smart Sustainable Cities Framework ... 79
Figure 4-2: Map showing EU 28 with their respective capital cities ... 81
Figure 4-3:Hierarchical Clustering Dendogram ... 86
Figure 4-4: Individuals factor map ... 87
Figure 4-5: Bar chart showing rank scores of European capital cities ... 90
Figure 4-6: Smart Sustainable ranking of European capital cities ... 91
List of abbreviations and acronyms
AI Artificial Intelligence
CRM Customer Relation Management CTA Absolute Contribution
CTR Relative Contribution DT Diffusion Theory EU European Union
EVF Extended Valence Framework EW Equal Weighting
GDP Gross Domestic Product GHG Green House Gases
ICT Information Communication Technology IPCC Intergovernmental Panel on Climate Change ISO International Standards Organization
IT Information Technology
ITU International Telecommunication Union KMO Kaiser-Meyer-Olkin
NAM Norm Activation Model
NOVA IMS Nova Information Management School PCA Principal Component Analysis
PLS Partial Least Squares
PRISMA Preferred Reporting Items for Systematic Reviews and Meta-Analysis RES Renewable Energy Sources
SAS Statistical Analysis System SERVQUAL Service Quality
SMS Short Message Service SSC Smart Sustainable City
TAC Theory of Access-based Consumption TAM Technology Acceptance Model TEA Theory of Emerging Adulthood
TPB Theory of Planned Behaviour TRA Theory of Reasoned Action
UNECE United Nations Economic Commission for Europe VBNT Values-Belief-Norms Theory
Chapter 1 - Introduction
11.1 Background and motivation
Cities are the bedrock of human civilization driving the industrial development of the world. They uniquely provide the density required for effective interaction and networking to generate wealth and improve living standards (Wolfe & Bramwell, 2016). However, in recent times, many urban centres are seeing an exponential growth in population, creating a pattern of rapid urbanization (UN-HABITAT, 2011). It is projected that a huge percentage of the world’s population will live in cities by 2030 (United Nations, 2014). This rapid growth of cities will create unusual sustainability challenges both on infrastructures, citizens and the environment (David, 2017). These in turn will affect the quality of life of residents of the city as well as the efficiency of its operations (Degbelo, Granell Granell, et al., 2016). Some of these challenges are already being addressed through the development of intelligent technologies (Castán, Martínez, Menchaca, & Berrones, 2016). However, a lot of these smart solutions are not aligned with sustainability targets. For example, the explosive use of some of these intelligent technologies to improve liveability in cities will, among other things, lead to more energy demand which has an inevitable impact on climate (Chourabi et al., 2011). This problem is connected with the “Jevons Paradox”, which states that “in the long term, an increase in efficiency in resource use will generate an increase in resource consumption rather than a decrease” (Giampietro & Mayumi, 2018). Consequently, the concept of smart sustainable cities (SSC) was created (Ahvenniemi, Huovila, Pinto-Seppa, & Airaksinen, 2017).
“A smart sustainable city is an innovative city that uses information and communication technologies (ICTs) and other means to improve quality of life, efficiency of urban operation and services, and competitiveness, while ensuring that it meets the needs of present and future generations with respect to economic, social, environmental as well as cultural aspects” (UNECE,
1Parts of the text of this chapter has been published as Akande, A. (2018). Smart Sustainable Cities assessment framework. In S. Vinkor, P. Porycek, N. Edelmann, & O. Glassey (Eds.), Proceedings of the international Conference EGOV-CeDEM-ePart 2018 (pp. 287-294). Krems: Edition Donau-Universitat Krems. Retrieved from https://www.donau-uni.ac.at/imperia/md/content/bibliothek/folder/cedem2018.pdf#page=301
2015a). The term “Smart Sustainable Cities” only became popular around 2010 as a result of an effort to balance the “smart cities” rave of the moment with long term sustainability targets (Al-Nasrawi, Adams, & El-Zaart, 2015). Bibri & Krogstie (2017b) also appropriately describes this term as “a city that is supported by a pervasive presence and use of advanced ICT, which, in connection with various urban domains and systems and how these intricately interrelate, enables cities to become more sustainable and to provide citizens with a better quality of life”. Smart sustainable cities as a concept exists at the intersection of the two broad concepts - smart cities and sustainable cities - and other concepts such as urban analytics, urbanization and urban growth, urban ICT and environmental sustainability (Höjer & Wangel, 2015). It describes the holistic application of ICT and other smart technologies to provide mainstream solutions that provide a conducive environment for the increasing population in urban areas while guaranteeing the sustainability of the various dimensions of the urban domain. An example of when the “smart sustainable cities” concept is at work is when ICT is used to accumulate and analyse data on various urban systems and domains, and thereafter used to provide strategic insights for policy makers to make sustainable decisions to improve liveability in cities. From a synthesis of several definitions, the ITU defines a smart sustainable city as one that “uses ICT and other means to improve quality of life, efficiency of urban operation and services, and competitiveness, while ensuring it meets the needs of present and future generations with respect to economic, social and environmental aspects” (ITU, 2014).
1.2 Research focus
Various governments have set ambitious targets to transition their cities to being smart and sustainable using various initiatives and it is crucial that the performance of these ventures is measurable. One of the ways to go about this is to develop a framework that facilitates the tracking of the advancement of cities towards their smart-sustainable goals. The development of this framework demands an understanding of the various connecting factors linking a smart city model and a sustainable city and the relationship between them. In this research, using data at city level, we assess smart sustainable city performance by studying the link between smart city performance and sustainable city performance, evaluating drivers of the use of technology to promote the sustainable use of resources and ranking cities based on their joint smartness and sustainability performance. Specifically, we answer the following research questions:
• What is the relationship between smart cities performance and sustainable cities performance?
There is an assumption among city managers that a drive in pushing the smartness of cities will ultimately lead to an improvement in sustainability and vice versa even though there is currently a large gap between smart city and sustainable city frameworks (Ahvenniemi et al., 2017; D’Auria, Tregua, & Vallejo-Martos, 2018). We seek to clarify this using empirical data.
• What drives the adoption of the sharing economy to optimise the use of resources within cities?
Cities are huge inefficient engines consuming 75% of all natural resources while accounting for 50% of global waste even though they account for just 3% of global land area and 55% of global population (Neves, Krajewski, Jung, & Bockemuehl, 2012). The sharing economy seeks to address this by using technology to address human needs and fairly distribute resources to reduce waste (Barnes & Mattsson, 2017). There is still a need to understand what drives the individual adoption of the sharing economy.
• How well do cities in Europe perform in terms of their smartness and sustainability? There is a growing demand for city assessment studies because cities are now seen as a leverage point in the quest for global sustainability due to the agglomeration of population in them. However, most city assessment studies are plagued by some methodological gaps, which we address in this dissertation and we rank cities based on how smart and sustainable they are.
1.3 Research objectives
The main goal of our research is to assess cities based on how smart and sustainable they are. However, to achieve that main goal, we divided our research in three different objectives, with each objective corresponding to a separate study presented as individual chapters in this dissertation.
List of objectives:
1. To evaluate the relationship between smart city performance and sustainable city performance in Europe.
2. To identify the drivers, trends and synthesize the findings from existing research of the adoption of the sharing economy in fostering sustainability within cities.
3. To rank the performance of capital cities within Europe based on how smart and sustainable they are and explore the effect of psychological empowerment on the intention to use and recommend e-participation.
1.4 Research methodology
In order to address our research objectives, this dissertation is composed of three studies. The first and third study makes use of various multivariate data analytic technique, such as cluster analysis and Principal Component Analysis (PCA) (Akande, Cabral, & Casteleyn, 2019; Akande, Cabral, Gomes, & Casteleyn, 2019). The second study is a literature review that follows a quantitative approach to develop a weight and meta-analysis of the existing cross-sectional studies on the sharing economy.
We made used of city level secondary data on various indices for this research. The data were obtained from various authorities such as Eurostat, the International Telecommunication Union (ITU) and the Organization of Economic Cooperation and Development (OECD). This research was focused on European cities. The European Union (EU) supports the evolution of its cities to being smart and sustainable. This is exemplified by its conscious efforts to invest in various smart city initiatives. On the Market Place of the European Innovation Partnership on Smart Cities and Communities website, there are 34 EU projects in different cities focused on the various sector components of smart cities2 (European Commission, 2016c). But beyond these
smart city initiatives, the EU is also concerned with alleviating the various pressures that come along with urbanization as well as the sustainable development of its cities (European Commission, 2017).
Multivariate descriptive statistical analysis is well known for its ability to describe and analyse large data matrices. They are also known for their effectiveness in summarizing and reducing the dimensionality of a dataset (Husson, Lê, & Pagès, 2010a). This makes them
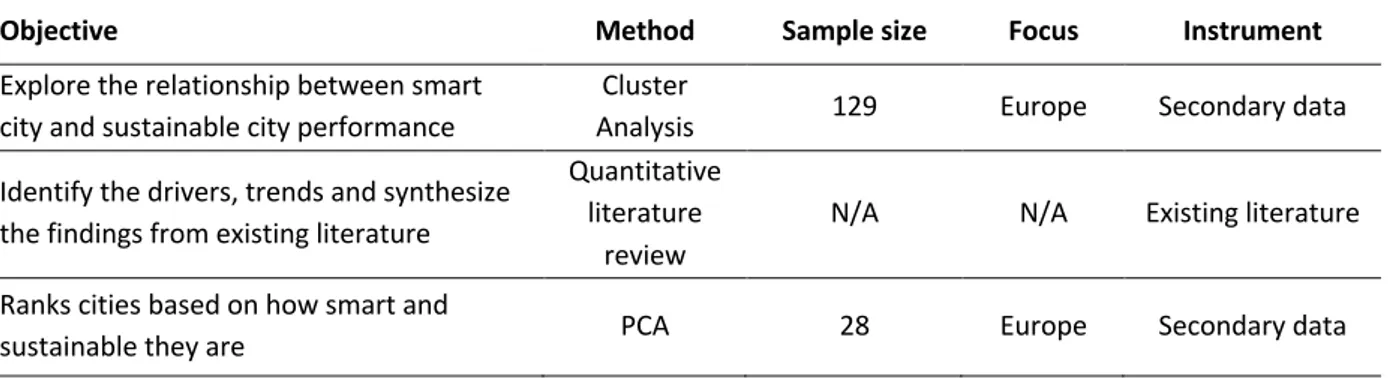
particularly suited for our research questions because of the large number of dimensions required to characterise cities and the need to synthesize our analysis for easy interpretation. Table 1.1 summarizes the research methods used for each study in this dissertation.
Table 1-1. Methodological approach summary
Objective Method Sample size Focus Instrument
Explore the relationship between smart city and sustainable city performance
Cluster
Analysis 129 Europe Secondary data Identify the drivers, trends and synthesize
the findings from existing literature
Quantitative literature
review
N/A N/A Existing literature Ranks cities based on how smart and
sustainable they are PCA 28 Europe Secondary data
1.5 Study relevance and potential contributions
Although the concept of smart sustainable cities is rapidly gaining traction among urban planners and policy makers, academic literature on this concept is still scanty because the field is still in its infancy. However, a number of good articles on this subject has been published in reputable journals (Bibri & Krogstie, 2017a; A Kramers et al., 2016; M Börjesson Rivera, Eriksson, & Wangel, 2015). In contrast, there are quite a lot of academic articles on related concepts, such as smart cities and sustainable cities. Smart sustainable cities is a field of study that has evolved from viewing individual concepts such as smart cities and sustainable cities from a different perspective and an attempt to fuse and synthesize both concepts. This has sometimes led to the interchangeable use of the term “smart cities” and “sustainable cities” in conversations. In fact, Höjer & Wangel (2015) argued that ‘the smart city is the smart sustainable city and that the word “sustainable” can be left out without further ado’. However, when the term “smart city” is used in this context, sustainability is only assumed to be a by-product and we agree that it holds some potential for sustainability. There is need to develop robust indices to evaluate cities striving for both smart and sustainable urban development (Höjer & Wangel, 2015). This is important because according to Bibri & Krogstie (2017b), “without evaluative approaches and practices, smart sustainable cities risk becoming no more than labels, just like some sustainable urban forms becoming fallacies – without validated urban content or only for urban labelling”. Developing
these assessment methods will not only require a fundamental understanding of the conections between ICT and environmental sustainability in cities, but also an understanding of the drivers that operationalise these connections (Bibri & Krogstie, 2017a). Existing literature on smart sustainable cities presents several research gaps to which this dissertation contibutes. First, there is still a knowledge gap on the joint interaction between smart city performance and sustainable city performance using a evaluative approach. Instead, the body of research focuses individually on either smart city performance or sustainable city performance. Second, there is still a lack of comparative study analysing how intelligent technology through adoption of the sharing economy can be used to optimise resource consumption and foster material sustainability in cities. Thirdly, there is still a lack of rankings of cities based on how smart and sustainable they are. Existing rankings like the European Smart Cities ranking (Giffinger et al., 2007), the European Green Capital Award (Gudmundsson, 2015), the European Green City Index (Siemens, 2009), the European Green Leaf Award (European Commission, 2016a), European Soot-free City Ranking (Reh, Fellermann, & Duprez, 2013), Europe Quality of Life Index (Numbeo, 2016) and Urban Ecosystem Europe (Berrini & Bono, 2007) are plagued by some methodlogical gaps which we address in this dissertation.
1.6 Path of research
This dissertation is made up of a collection of three research articles with each article corresponding to one of the chapters from 2 to 4. Two of the three articles were peer-reviewed and are already published in top-tier journals (Akande, Cabral, & Casteleyn, 2019; Akande, Cabral, Gomes, et al., 2019). The third article is still undergoing a peer-review process in a top-tier journal. It is important to state that the peer-review process significantly improved the quality of the research articles in this dissertation. These articles focus on exploring the relationship between the sustainability and smartness of cities, evaluating the drivers of the adoption of the sharing economy within a smart sustainable city and ranking of cities based on how smart and sustainable they are. Table 1.2 lists the articles and the corresponding chapter in the dissertation.
Chapter Publication Authors Contribution of each
author Status
Journal
Rank Year
2
Assessing the gap between Technology and the
Environmental Sustainability of
European Cities Akande, A.
(AA), Cabral, P. (PC),
Casteleyn, S. (SC)
Conceptualization, AA, PC; Data curation, AA; Investigation, AA; Methodology, AA; Formal analysis, AA, Visualization, AA, PC; Writing – original draft, AA; Writing – review and editing, AA, PC, SC.
Published in Information Systems Frontiers Scopus – Q1 ABS - 3 2019 3 Understanding the sharing economy and its implication on sustainability in smart cities
Conceptualization, AA, PC; Data curation, AA; Merging analysis, AA; Meta-analysis, AA; Weight-analysis, AA; Visualization, AA, PC, Writing – original draft, AA; Writing – review and editing, AA, PC, SC.
Under
review N/A N/A
4 The Lisbon Ranking for Smart Sustainable Cities in Europe Akande, A. (AA), Cabral, P. (PC), Casteleyn, S. (SC), Gomes, P (PG) Conceptualization, AA, PC; Data curation, AA; Investigation, AA; Methodology, AA; Formal analysis, AA, Visualization, AA, PC; Writing – original draft, AA; Writing – review and editing, AA, PC, SC, PG.
Published in Sustainable Cities and Society Scopus – Q1 ABS – N/A 2019
The current chapter serves as an introductory section, including the background and motivation, research focus and objectives, methodology, path of research as well as the outline of the document.
Several smart city assessment frameworks strongly focus on ICT development without understanding its relationship with environmental sustainability performance (Ahvenniemi et al., 2017). In chapter two, we present a literature review on the concept of smart sustainable cities and its related concepts. Using data from cities in Europe, we also present a study on the micro-level interaction of Information and Communication Technology (ICT) and environmental sustainability. The need for a common strategy for achieving integrated smart, sustainable and inclusive growth at a European level is demonstrated.
An important use case of the smart sustainable city concept is the sharing economy which is a new economic model based on the peer-to-peer “activity of obtaining, giving, or sharing access to goods and services, coordinated through community-based online services” (Hamari, Sjöklint,
& Ukkonen, 2016). Given that it is an emerging concept, the adoption of the sharing economy has been slow. In chapter three, we present a study that makes use of weight and meta-analysis to determine the best drivers of the individual adoption of the sharing economy. The study presents the first attempt at advancing knowledge on the sharing economy by quantitatively synthesizing findings presented in previous literature.
An aspect of smart sustainable city assessment is city benchmarking and ranking. In chapter four, we ranked European capital cities based on how smart and sustainable they are, using a selection of indicators from a framework proposed by UNECE-ITU. The ranking is meant to attract attention and induce competition amongst cities.
Chapter 2 - Assessing the gap between Technology and the Environmental
Sustainability of European Cities
Abstract3
The growth of cities’ population increased the interest in the opportunities and challenges that Information and Communication Technology (ICT) have on carbon footprint reduction, which fosters their environmental sustainability. Using Principal Component Analysis (PCA), six ICT-related variables from European Union (EU) cities were combined into a single two-dimensional ICT index. Then, through cluster analysis, cities were clustered into four groups based on the ICT index and Carbon dioxide (CO2) emissions. Using ICT as an indicator of smartness and CO2
emissions as an indicator of sustainability, we show that it is possible for a city to be smart but not sustainable and vice versa. Results also indicate that there is a gap between cities in northern Europe, which are the top performers in both categories, and cities in south-eastern Europe, which do not perform as well. The need for a common strategy for achieving integrated smart, sustainable and inclusive growth at a European level is demonstrated.
2.1 Introduction
The growth and development of an economy are intrinsically tied to its investment in the development, adoption and innovative use of modern technologies (European Commission, 2010a; Gouvea, Kapelianis, & Kassicieh, 2017). The effective deployment and use of ICT can increase the rate of innovations in societies and economies (Gouvea et al., 2017). Furthermore, ICT is the binding element of the triple-helix dimension of sustainability; economy, environment and society (Gouvea et al., 2017; UNECE, 2015b).
The EU is taking a leading role in championing the push for a digital agenda for Europe, as the successful implementation of an ICT strategy is vital to the inclusive, equitable and sustainable economic development of Europe (Gouvea et al., 2017). This vision is contained in the
3 The text from this chapter has been published as Akande, A., Cabral, P. and Casteleyn, S. (2019)
‘Assessing the Gap between Technology and the Environmental Sustainability of European Cities’, Information Systems Frontiers. doi: 10.1007/s10796-019-09903-3
EU’s strategy for smart, sustainable and resilient growth which articulates the EU’s plan to achieve an inclusive, sustainable Europe and sets targets for reducing Green House Gases (GHG) by 2020 (European Commission, 2010a). Some of the targets include more energy-efficient ICT products
and ICT-enabled energy-efficient buildings (OECD, 2009). A pivotal component of this plan is an urban agenda which aims to make cities attractive and
sustainable through an integrated and coordinated approach (European Commission, 2010b). The role played by ICT in the development of smart and sustainable cities globally cannot be over-emphasised (European Commission, 2010a). Cities are important to climate change and environmental sustainability discourse. This notion is because cities around the globe accommodate more than 70% of the global population and are responsible for about 75% of global energy use and energy-related GHG emissions (IPCC, 2014a; UN-HABITAT, 2011). According to Gouvea et al. (2017), “it is clear that without the diffusion and dissemination of ICT; countries cannot garner the full environmental benefits and the positive externalities that are generated as a result”. It is crucial to assess the relationship between ICT and environmental sustainability within cities in Europe, considering the serious environmental problems, the world is facing, and the interest of the EU in pursuing a digital agenda to make her cities smarter.
Previous studies have sought to understand the association between ICT and environmental sustainability using regression. Wu and Raghupathi (2018) performed a country-level study to examine this relationship and found out that ICT is positively correlated with sustainability and thus has the potential to promote environmental sustainability. Furthermore, Gouvea et al. (2017) reported a positive linear relationship between environmental sustainability and ICT in countries. However, Añón Higón et al. (2017) reported a contrasting result identifying a non-linear relationship between ICT and environmental sustainability in the shape of an inverted U-curve. The findings of these studies are based on the macro-level using country data and fail to account for the variations in this relationship from one country to another. One may ask if the relationship found is the same across all countries studied or if there are exceptions.
Furthermore, there is still a knowledge gap on the micro-level interaction of ICT and environmental sustainability. By “micro-level interaction”, we mean studying this interaction using city level data as opposed to the country level data (macro-level) used in previous studies. Country level data are aggregations produced by averaging measurements across different units (cities, towns and villages) within the country. This differs from city level data which are used to
infer city-level interaction of ICT and environmental sustainability, study within country variations and perform inter-city comparisons. This paper strives to contribute to this discourse by using a different approach to study this interaction on a micro-level using city data. Thus, this research aims to answer the following research question: is there a relationship between the ICT development and environmental sustainability of cities? A follow up to this question is: what is the nature of this relationship and is it consistent or does it vary across different cities? This question is vital to understand the concept of smart cities in relation to environmental sustainability. The concept of “smart city” and “sustainable city” is often used interchangeably in literature without a proper understanding of the relationship between them (Bibri & Krogstie, 2017b).
Furthermore, several smart city assessment frameworks strongly focus on ICT development without understanding its relationship with environmental sustainability (Ahvenniemi et al., 2017). We intend to clarify this issue empirically by using data from cities. Specifically, we used data from the year 2016 of 129 cities in 28-member states of the EU (EU-28). Our research approach is as follows:
1. Propose a framework to measure the ICT development of EU cities.
2. Calculate a single measure of ICT development (an ICT development score) based on the framework developed in objective 1.
3. Determine an appropriate measure of environmental sustainability in EU cities.
4. Establish the relationship between the ICT development and environmental sustainability of EU cities.
5. Cluster all cities in Europe based on their ICT and environmental sustainability relationship.
Our work makes significant contributions to the gaps identified in the literature. We present an exploratory analysis of the relationship between the smart cities concept and environmental sustainability using data on 129 cities within the EU. In the context of this paper, the smart cities concept is viewed from the perspective of ICT development within a city and is measured using six ICT indicators, while environmental sustainability is proxied using the GHG emissions of cities. Furthermore, we contribute to understanding the role different dimensions of ICT development play in urbanisation and environmental sustainability. This study yields valuable insights for policymakers in the urban domain on the dynamics of different levels of ICT development and its relationship to environmental sustainability for different cities within the EU.
The rest of this article is structured as follows: In Section 2, we conduct a literature review of key concepts related to this study; in Section 3, we present the framework to measure the connection between ICT and environmental sustainability; in Section 4, we present our data and methodology; Section 5 shows the results of our analysis; Section 6 discusses the results obtained presenting the implications and limitations of the paper as well as possible future work; and Section 7 presents the conclusions.
2.2 Literature Review
We delve into the literature to further understand and contextualise the “sustainability”, “smart” and “city” concepts within the scope of our study.
2.2.1 The “sustainability” concept
Sustainability is often used in literature with reference to development to connote the act of balancing the pace of development with the number of resources required to achieve such a pace. Environmental sustainability can be traced back to the 18th century when Carl von Clausewitz
postulated that we should not be cutting down trees at a rate higher than that at which they are replaced (von Clausewitz, 2009). This postulation is the underlying principle of environmental sustainability: using the earth’s resources faster than it is being replenished. This unsustainable use of the earth’s resources to meet man’s immediate needs has resulted in, among other things, an increase in the amount of CO2 in the atmosphere. An increase in atmospheric CO2 will, in turn,
lead to the warming of our planet precipitating the risk of flooding, drought and an increase in natural disasters among other things (IPCC, 2018).
The concept of sustainability was first introduced to the urban domain in the early 1990s (Wheeler & Timothy, 2014). It was born out of a realisation of the risks that urban development poses to the environment which may lead to a perilous future (Bibri & Krogstie, 2017b). According to Bibri and Krogstie (2017a), urban sustainability is “a desired state in which urban society strives for achieving a balance between environmental protection and integration, economic development and regeneration, and social equity and justice within cities as long-term goals through the strategic process of sustainable urban development as a desired trajectory”. This definition is supported in
the various literature which hinges sustainable development on three components; economy, environment and society (Jenks & Jones, 2008; UNECE, 2015a).
2.2.2 The “smart” concept
The word “smart” has been used in several contexts in literature. However, it has been most used to refer to the application of ICT in the creation and management of products, services and systems (Nasrawi, Adams, & El-Zaart, 2016). Its use in the urban domain can be traced back to the 1960s when the term “cybernetically planned cities” was used to refer to the use of ICT to plan urban environments (Gabrys, 2014). Since then, the word “smart” has been more uniformly used when referring to the use of ICT in the urban domain (Mustafa & Kar, 2017). This practice ranges from understanding how cities function to improve their management, to offering services that improve the quality of life of citizens (Bibri & Krogstie, 2017b; Rana et al., 2018). It has also improved other aspects of society connected to the urban domain such as education, communication, financial services and commerce (Cruz-Jesus, Oliveira, Bacao, & Irani, 2017).
2.2.3 The “city” concept
According to Nasrawi et al. (2016), a city “is a place where people live that is larger or more important than a town”. Its importance is due to the size of its population and the concentration of economic opportunities in them. From being smaller in size, they have rapidly grown because of urbanisation, and this has profound consequences on global sustainability. This research views cities as an object to which the “smart” concept and “sustainability” concept can be linked. In literature, there are two research strands related to cities and sustainability. One focuses on the impact of urbanisation and cities on sustainable development and the other focuses on how we can make cities more sustainable. One of the ways to make cities more sustainable is through the proper deployment of ICT in its various forms to monitor, understand, probe and plan cities. This approach has come to be known as the “smart sustainable city concept” by academia and the international community (Bibri & Krogstie, 2017b).
2.2.4 The “smart sustainable city” concept
Smart sustainable cities is a concept that fuses environmental sustainability, urbanisation and technological development (Höjer & Wangel, 2015). It is a term that combines smart city and sustainable city, used to describe the use of ICT to enable cities to become more sustainable and to improve the quality of life of citizens (Akande, Cabral, Gomes, et al., 2019; Al-Nasrawi et al., 2015; Bibri & Krogstie, 2017a; Höjer & Wangel, 2015; A Kramers et al., 2016). The use of ICT in urban systems and domains includes but is not limited to “sensing, collecting, storing, coordinating, integrating, processing, analysing, synthesising, manipulating, modelling, simulating, managing, exchanging, and sharing data for the purpose of monitoring, understanding, probing and planning modern cities to achieve particular goals” (Bibri & Krogstie, 2017b). The emerging field of smart sustainable cities is gradually developing into two main research strands; one that focuses on the effects and implication of ICT use and infrastructure on urban sustainability (Anna Kramers et al. 2014; Nasrawi et al. 2016) and another that deals with the development of integrated frameworks to measure the combined smartness and sustainability of cities (Ahvenniemi et al. 2017). This research is line with the first strand, focusing on the relationship between ICT and environmental sustainability in cities.
2.2.5 The link between ICT and environmental sustainability
It is worthy to note that, despite the obvious link between ICT and environmental outcome, there are no statistical indicators that directly measure this link (OECD, 2009). Research exploring the impact of ICT and the information society on environmental sustainability only began appearing in literature in the year 2000 (Ospina & Heeks, 2010). A survey of this literature reveals three interrelated research strands: sustainable development, mitigation and adaptation.
The first strand of research in this field explores a global perspective to link sustainable development and the information society. These researches discussed the potential effect the rapid expansion of ICT could have on the achievement of the Millennium Development Goals and environmental sustainability. Slob and van Lieshout (2002) studied the trends of ICT development and their implication on sustainability. Although they found that ICT has stimulated economic growth, they were not certain of the effect the rapid developments in ICT will cause on the environment and called for more research into technology-environment interactions. Furthermore,
(Willard & Halder, 2003) considered the implication of Information Society on sustainable development, highlighting the consequences environmental information systems, e-commerce and e-participation will have on sustainability from a broad perspective.
The second research strand of literature found focuses on the role ICT applications play in the reduction of CO2 emission. Here, the International Telecommunications Union plays a
prominent role identifying the direct, indirect and systematic effects of ICT on CO2 emission and
recommending policies and activities aimed at reducing the adverse effects and promoting the positive effects (ITU, 2008). It focuses on how the use of ICT can affect the environment in developed countries. For example, how the use of video conferencing instead of travelling can reduce the carbon footprint of the user or the use of e-mails instead of sending a postal mail in paper form (S. J. Wu & Raghupathi, 2018). Literature here focuses on the opportunities posed by ICT to reduce CO2 emission generated by energy consumption (ITU, 2009), travel and mobility
(Sustainable Development Commission, 2010) and industries (Mingay & Pamlin, 2008).
The third strand of research explores how ICT can play a role in climate change adaptation issues in developing regions because these are most vulnerable to the effect of increased CO2
emission. This research strand examines how ICT can be used as a tool to foster innovation and involve all stakeholders in climate change strategies (Ospina & Heeks, 2010). This is exemplified by researches on poverty reduction and environmental protection in Kenya (Mungai, 2005) and the use of SMS to report air pollution in the Philippines (Dongtotsang & Sagun, 2006).
Of these three strands, our research falls within the second as we explore how to exploit this relationship and apply it within the context of cities and urbanisation (Yi & Thomas, 2007).
ICT products and services are playing an essential role in improving the sustainability and liveability of cities. These products and services range from the new wave of computing such as big data analytics, Internet of Things (IoT) and Artificial Intelligence (AI) to ICT-enabled applications such as eCommerce, eBanking, eHealth, eLearning, and e-mail (Bibri & Krogstie, 2017b; Cruz-Jesus et al., 2017; Pappas, Mikalef, Giannakos, & Krogstie, 2018). They enable new sustainable ways of doing business and providing services in what is known as “Digital Transformation” (Pappas et al., 2018; A. Venkatesh, 2008). Furthermore, when combined with e-government, these e-services can facilitate the transition of society into “digital nations” (A. Kar et al., 2017). Most importantly, they promote dematerialisation which has implications for the environment. Big data generated from various IoT technology gives businesses an insight into how
their products and services are affecting the environment providing them with an opportunity to help decarbonise the global economy (Mikalef, Pappas, Krogstie, & Giannakos, 2017). Furthermore, ICT gives businesses a competitive advantage via eCommerce (Gorla, Chiravuri, & Chinta, 2017; Guo & Gao, 2017), provides a cost- effective and flexible way to learn via eLearning (Joseph, Kar, & Ilavarasan, 2017; Teo, Kim, & Jiang, 2018), improves communication between medical personnel and their patients via eHealth (Maresova & Klimova, 2017; Serrano, Garcia-Guzman, Xydopoulos, & Tarhini, 2018), increases the speed and flexibility of financial transaction via eBanking (Garín-Muñoz, López, Pérez-Amaral, Herguera, & Valarezo, 2018) and reduces the cost of communication via e-mail (Gouvea et al., 2017). Overall, the ICT services highlighted above have reduced the need to commute and are inherently connected with environmental sustainability.
There are various studies on the connection between ICT, urbanisation and sustainability. Using ideas proposed by Giffinger et al. (2007), Bifulco et al. (2016) studied the roles of ICT in improving sustainability within smart cities. Using the Network Readiness Index of the World Economic Forum as a proxy for ICT and the Environmental Performance Index as a proxy for environmental sustainability, Gouvea et al. (2017) studied this link at a country level. This link was studied using ordinary least squares regression with ICT as the predictor variable. They found a positive and significant linear relationship between ICT and environmental sustainability. Their work was in line with Wu and Raghupathi (2018), who did an exploratory study on the strategic association between ICT and sustainability at country level using data from the World Bank Group. Wu and Raghupathi (2018) studied this relationship using multiple linear regression with five ICT factors derived from averaging various ICT measurements as explanatory variables. They found that ICT factors are positively associated with sustainability. However, Añón Higón et al. (2017) using ordinary least squares regression, discovered that the relationship between ICT and CO2
emission is not linear but rather an “inverted U-shaped” at country-level. Watson et al. (2010) also discussed the role of ICT in improving energy efficiency and fostering changes that reduce the environmental impact of cities.
Despite the wealth of literature in analysing the relationship between ICT development and environmental sustainability across different countries from a broad perspective, this relationship is not yet fully understood at a micro-level. Hence, there is a need to take a comprehensive approach to understand the relationship between ICT solutions and environmental sustainability
(Bibri & Krogstie, 2017a, 2017b). Although Kramers et al. (2016) argue that it is difficult to determine the role of ICT in environmental sustainability because of the larger socio-technical system which encapsulates ICT, we believe that this complex relationship can be broken down by operationalising theoretical constructs and studying specific aspects of this relationship. A foundational step in deciphering this relationship is understanding how this relationship varies different cities at a micro-level.
2.3 Measuring the connection between ICT and environmental sustainability.
Measuring the link between ICT and environmental sustainability requires the use of indicators. The Organization for Economic Co-operation and Development (OECD) Working Party on Indicators for the Information Society (WPIIS) is the international body charged with the responsibility for setting international standards for ICT indicators, which it has been doing since 1997. Although there are existing information society / ICT indices which we could have made use of, these indices exist only at macro (national) level. Some of these indices include the IDC’s Information Society Index (Karvalics, 2005), ICT development Index (ITU, 2005, 2017a) the International Telecommunications Union’s (ITU) Digital Access Index and Digital Opportunity Index (ITU, 2005), the World Bank’s Digital Adoption Index (World Bank Group, 2016), the United Nations Development Program’s Technology Achievement Index and the Infostate Index (Huyer, Hafkin, Ertl, & Dryburgh, 2005). These macro-level indices represent a country with a single index and fail to consider the individual differences within the cities in the country. For example, in line with Oni and Papazafeiropoulou's (2014) idea, we would expect that the characteristic of a capital city is different from other cities within the same country.
Furthermore, some of these existing ICT indices are opaque on their derivation methods, while others incorporate several indicators that are not relevant for our study (Taylor, 2016). This inconsistency implies that the methodological characteristics of existing ICT indices cannot be fully evaluated. The indicators included in these ICT indices reflect the purpose for which they were developed, which is not aligned with ours. Hence, we build our own index by analysing technologies which are relevant to the scope of our study, as opposed to making use of a generic index. The challenge with this approach is the unavailability of consistent data, relevant for this study, for all cities. We need to make a compromise between the number of variables to include in
our study and the number of cities for which these data are consistently available. Cruz-Jesus et al. (2017) described this as making “a trade-off between the depth and the width of the analysis”. If more variables are used, and fewer cities are included in our study, our findings may be narrow and limited to only the cities we have included, making it impossible to generalise our conclusions to other contexts. Conversely, if we include more cities and make use of fewer variables, our analysis may not fully capture the various dimensions of ICT development, and hence, we may arrive at misleading conclusions.
Lastly, the process of associating a weight to each variable used to build the ICT index can lead to unreliable results if subjectively done (Bruno, Esposito, Genovese, & Gwebu, 2010). Some of the subjective approaches used in previous studies include the Equal Weighting approach (World Bank Group, 2016) and the participatory approach. The Equal Weighting approach assumes that all variable contributes equally to the index (OECD, 2008). However, this is not interesting because there is no empirical basis for this assumption. The participatory approach involves the use of principal stakeholders to assign weights based on their experience. Both approaches create indices without taking cognisance of the interrelationship between indicators. Having fully understood the opportunities and obstacles of building an ICT index from variables, we opted for the use of multivariate statistics to explore the suitability, underlying nature and structure of our data and used that information to assign weights and build an index. This approach takes care of the redundant variables included in our analysis as a result of the subjective selection of indicators. Furthermore, it provides an empirical basis for weighting by determining how the different indicators change in relation to each other and across European cities. Several authors have used this method in the past (Cruz-Jesus et al. 2012; Cuervo and Menéndez 2006; Vicente and López 2011).
2.3.1 Conceptual Model
We turn to the literature to build on previous theoretical work to help us develop a conceptual model and select appropriate indicators for analysis. The conceptual framework proposed by OECD for measuring the information society consists of the following interconnected modules: ICT supply, ICT Infrastructure, ICT demand, ICT products, information and electronic content and ICT in a broader context (OECD, 2005). Several researchers have adapted modules from this
framework and used it to study the ICT impact relationship in different contexts such as economic development (Cruz-Jesus et al., 2017) and sustainable development (Azadnia, Zahedi, & Pourabedy, 2017). Furthermore, building on the framework proposed by Berkhout and Hertin (2001) to study the demand side (users and uses) of ICT and its effect on the environmental sustainability, we sought to explore this link by including indicators that measure the infrastructure and pervasiveness of ICT in our study.
ICT demand entails the use of ICT goods or services by various groups and industries to carry out their activities efficiently. The European Commission’s Digital Agenda for Europe clearly outlines the role of e-services and their importance to service delivery in connection with improving the quality of life of citizens (European Commission, 2014a). Specifically, eBanking, eLearning, e-mail and eHealth were listed as being “some of the most innovative and advanced online services” (European Commission, 2014a). The use of these services has been included as variables to outline the use of ICT by individuals within cities. Furthermore, we included the percentage of enterprises selling online to take cognisance of the pervasiveness of ICT among business units. This variable is an important indicator of dematerialisation and electronic commerce (Cruz-Jesus et al., 2012; OECD, 2009).
ICT infrastructure is the services on which the information society relies on for its proliferation (Rossy de Brito et al., 2018). We decided to include Broadband Internet per 100000 persons because of the importance of a broadband connection to access the Internet. Broadband Internet is increasingly becoming important because of the recent explosion of bandwidth-intensive applications such as online gaming, audio and video streaming (D. J. Kim & Hwang, 2012). Broadband Internet per 100000 persons has been used by many authors to measure ICT development (Cruz-Jesus et al., 2017; OECD, 2009; Vicente & López, 2011) Data on this variable are widely available with relatively long-time series. There are standardised methodologies and collection procedures of this data (OECD, 2009). This variable is included to measure the level of
connectivity with regard to ICT infrastructure within cities (Cruz-Jesus et al., 2012).
In the domain of environmental sustainability, several authors have discussed the strong connection between environmental sustainability and GHG emission in cities (Owusu & Asumadu-Sarkodie, 2016; Privitera, Palermo, Martinico, Fichera, & Rosa, 2018). Although GHG comprises CO2, methane gas, nitrous oxide and fluorinated gases, CO2 is the primary pollutant accounting
for about 80% of emissions (World Bank, 2007). CO2 emission originates from anthropogenic
we will be making use of CO2 as our leading indicator of environmental sustainability. As such,
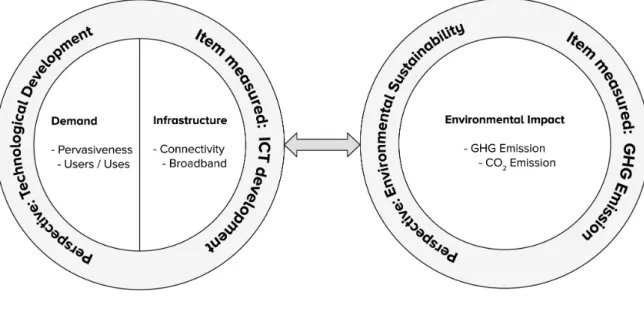
our conceptual framework is schematised in Figure 2-1. It is made up of two pillars (perspectives): technological development, measured by ICT development, and environmental sustainability, measured by GHG emission. The technological development pillar is divided into two dimensions: ICT demand, which measures the pervasiveness of ICT by characterizing its various users and uses, and ICT infrastructure, which measures the connectivity of the information society using broadband Internet. The environmental sustainability pillar is assessed as the environmental impact of GHG emission as measured by CO2 emissions.
Figure 2-1: Conceptual Framework
2.4 Methodology
2.4.1 Data
Based on our theoretical framework as outlined in section 3.1, we have selected six variables to characterise the ICT development of cities and one variable to characterise the environmental sustainability of cities in Europe. These variables are listed in Table 2-1. The selected variables are in line
with recommendations from the OECD, the European Commission and the Intergovernmental Panel on Climate Change (IPCC) (European Commission 2010a; OECD 2009). These indicators were selected based on literature and recommendations from the ITU, OECD, IPCC and the European Commission
CO2 emissions are a key indicator of contribution to climate change by cities. The parameter has been
used in the past as a core indicator or environmental sustainability and climate change by the IPCC (IPCC, 2014b).
It is important to note that the variables listed in Table 2-1 are not all-inclusive of every factor that contributes to the ICT development and digital sustainability of a city. However, we believe they are adequate within the bounds of data availability limits to measure the ICT development and environmental sustainability within cities in Europe. Data for variables were sourced from the ITU, OECD and Eurostat as compiled by 2thinknow City Benchmarking4. These secondary data sources were primarily chosen
because of the following reasons:
- They are the most authoritative source of data about the availability of ICTs in households and usage of ICTs by individuals (Eurostat, 2016; ITU, 2017b).
- They ensure the quality and integrity of their data are not compromised by following an encompassing quality management approach (European Commission, 2017). Hence their data is suitable for research purposes.
- Their data have been used for previous similar researches including accessing the pattern between economic and digital development of countries (Cruz-Jesus et al., 2017), accessing the digital divide in Europe (Cruz-Jesus et al., 2012) and accessing factors driving GHG emission in Europe (Andrés & Padilla, 2018).
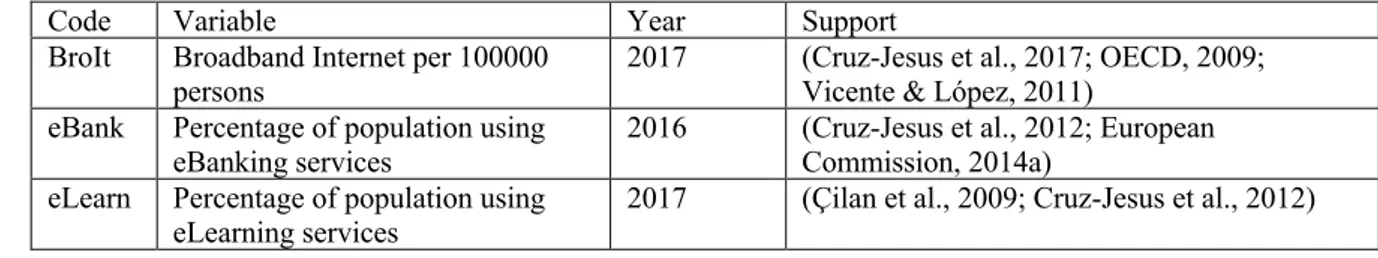
Table 2-1: Acronyms, descriptions, year and literature support of variables
Code Variable Year Support
BroIt Broadband Internet per 100000
persons 2017 (Cruz-Jesus et al., 2017; OECD, 2009; Vicente & López, 2011) eBank Percentage of population using
eBanking services
2016 (Cruz-Jesus et al., 2012; European Commission, 2014a)
eLearn Percentage of population using
eLearning services 2017 (Çilan et al., 2009; Cruz-Jesus et al., 2012)
e-mail Percentage of population using
e-mail 2017 (Billón, Ezcurra, & Lera-López, 2008; Bunz, Curry, & Voon, 2007; Cruz-Jesus et al., 2012; Ferro, Helbig, & Gil-Garcia, 2011)
eHealth Percentage of population using the
Internet to seek health information 2017 (Cruz-Jesus et al., 2012)(European Commission, 2014a) eCom Percentage of enterprises selling
online 2017 (Cruz-Jesus et al., 2012; Cuervo & Menéndez, 2006) CO2 CO2 emission (Tonnes) 2014 (Añón Higón et al., 2017; OECD, 2009;
UNECE, 2015b)
2.4.2 Exploratory data analysis
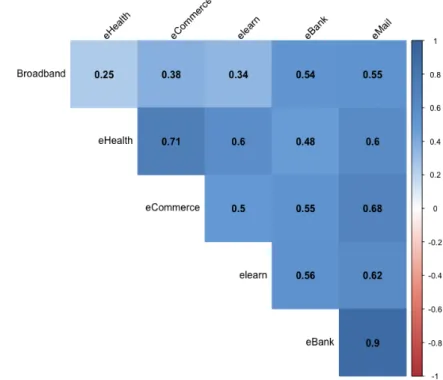
An exploratory analysis was done using numerical techniques that are statistically robust to understand the structure of our data. Summary statistics were calculated for each variable with the coefficient of asymmetry (skewness) and histograms used to check for the presence of outliers. Although, all variables under consideration are numerical, the range of values of eBank. eLearn, e-mail, eHealth and eCom differ from that of BroIt. While eBank, eLearn, e-mail, eHealth and eCom are expressed as percentages with a range of 100, BroIt is expressed as a count with a range of 100000. Hence, if used in their raw form, variables with higher numerical values will be assigned higher weights which would undermine the contribution of other variables in our analysis (A. Oliveira et al., 2017). We, therefore, normalised all explanatory variables using the minimum and maximum values of each respective variable transforming them to a scale between 0 and 1 before performing our hierarchical clustering tests (Akande, Costa, Mateu, & Henriques, 2017). Furthermore, because PCA depends on the correlation structure of our data, Pearson’s linear correlation coefficient was calculated to assess the existence of a linear relationship between our explanatory variables. The presence of a correlation between our explanatory variables will help us get meaningful results (Cruz-Jesus et al., 2017).
2.4.3 Principal component analysis (PCA)
PCA was used to transform our data from high dimensional space into a low-dimensional space (Spicer, 2005). However, before performing PCA, we checked the suitability of our dataset to be analysed by testing for certain PCA assumptions. Firstly, we tested the linear relationship between all variables using Pearson correlation coefficients. Secondly, we tested for the sampling adequacy of our dataset using the Kaiser-Meyer-Olkin (KMO) measure of sampling adequacy. Thirdly, we tested our data’s suitability for reduction using Barlett’s test of Sphericity (Cruz-Jesus et al., 2017). After that, we performed PCA on the
six ICT variables to derive a single measure each of ICT development. PCA describes the variation in our data by a set of uncorrelated variables known as the principal components. The ICT variables produced six principal components. We then investigated if the first few components account for most of the variation in our original dataset to retain them and discard the remaining components. Selecting the number of principal components to retain is a fundamental decision, as choosing fewer principal components than required will produce an incomplete representation of results and selecting more principal components than necessary will result in the inclusion of noise in the results (Friesen, Seliske, & Papadopoulos, 2016). Kaiser’s criterion was used to determine the number of principal components to retain (Cruz-Jesus et al., 2017).
Variable eigenvectors were investigated to determine which variables contributed the most to each dimension to aid the interpretation of our PCA results. We made use of the contribution of each variable to the inertia explained by each axis (CTA) and the part of variance associated with each variable explained by each axis (CTR) (Koch, 2013) to determine the contributing variables to each axis. We made use of CTA and CTR because they can be used in interpreting our results statistically and geometrically (Abdi & Williams, 2010).
Cronbach’s Alpha was used to measure the internal consistency of each component (Cruz-Jesus et al., 2017). Finally, each component selected was weighted based on its variance in proportion to the total variance of all selected components. Variable loadings were multiplied by each selected principal component’s weight and summed up to obtain a factor score. From the normalised table, we then calculated the coordinate of each city in relation to this factor score, multiplying the coordinate of vectors representing these cities by their respective factor score and summing them together (Friesen et al., 2016). This is more fully explained in Appendix B.
2.4.4 Cluster analysis
Cluster analysis was used as a robust method for identifying homogeneous groups of objects (in this case, cities) called “clusters” sharing similar ICT development / environmental sustainability characteristics in such a way that these groups “can achieve maximum internal homogeneity (within the cluster) and maximum external heterogeneity (between clusters)” (Brian Everitt, Landau, Leese, & Stah, 2011; A. Oliveira et al., 2017). After developing a quantitative index to measure the ICT development of cities in Europe using PCA, we made use of cluster analysis to create homogenous groups of cities based on this
index and the amount of CO2 emission in each city. We made use of a hybrid clustering approach,
combining both hierarchical clustering method and partitioning method (Kumar et al., 2014). Hierarchical clustering was done to determine the number of clusters to extract since we had no prior information about the number of clusters to group the cities (Balcan & Gupta, 2014). In hierarchical clustering, the structure of our data determines the number of clusters at each hierarchy. We also made use of the centroids of the selected clusters in the hierarchical clustering as seeds for the partitioning clustering method. The basic algorithms for hierarchical clustering can be described as follows:
1. There are N objects to group
2. We find the closest two points and merge them into a new point
3. We compute the similarity (distance) between this new point and the remaining points. 4. Iterate through steps 2 and 3 until there is only one point remaining.
The hierarchical algorithm and distance measurement used determines the quality of clusters obtained (Leisch, 2006). We made a comparison of the cluster solutions obtained by using different hierarchical clustering algorithms. These include centroid, Ward’s method, average-linkage, single-linkage and complete-linkage method. Each of these methods was evaluated using its R-Squared (R2) value and the method with the highest R2 value was selected. The R-squared value
is a measure of the proportion of the total variance that is retained in each solution (see Appendix A). The selected hierarchical algorithm was thereafter tested using different distance measurement including Euclidean distance, squared Euclidean distance, Minkowsky and city-block distance (Brian Everitt et al., 2011). Each of these distance measures gave similar results. The result of the best hierarchical clustering algorithm was visualised using a dendrogram (also known as a binary tree) which provides a visual depiction of the formation path of the clusters (Salah, Turki, & Al-Othman, 2012).
K-means clustering algorithm requires that the number of clusters, K, be specified before applying the algorithm. To determine the number of clusters to use from the hierarchical clustering, we made a visual comparison of the number of clusters and the distance value at which individuals agglomerate to form a group (Cabral, Sousa, Mendes, & de Carvalho, 2017). The dendrogram was thereafter “cut” at the appropriate number of clusters level. The centroids of each cluster were used to generate initial seeds for the partitioning clustering methods (k-means). The k-means algorithm is also implemented in four steps: