The Portuguese Shadow Toll Concessions:
Analysis of Allocation and Valuation of Risks
Elsa Natália Hilário Camuamba
Supervision:
Professor Ricardo Ferreira Reis
Professor Joaquim Miranda Sarmento
Dissertation submitted in partial fulfillment of the requirements for the degree of Msc in Economics at the Católica-Lisbon School of Business and Economics
ii
ABSTRACT
Title: The Portuguese Shadow Toll Concessions: Analysis of Allocation and Valuation
of Risks
Author: Elsa Natália Hilário Camuamba
As more countries are relying on the private sector for provision of public services, Public-Private Partnerships (PPPs) are at the center of this growing trend. Optimal risk allocation through risk transfer to the private sector is the critical issue for the success of these partnerships in achieving best value-for-money (VfM) for the public sector. Using the Portuguese shadow toll concessions (SCUT), this study aims to analyze and evaluate their allocation of risk between the public and private sectors. Accordingly, the first part of the paper examines how risks in the SCUT concessions were allocated. Our analysis indicates that for the most part, with the exception of demand risk, risks were well allocated. The second part of the paper identifies and evaluates the main risks transferred to the private sector. It also goes further in assessing gains before and after risk transfer, if any, to the private sector. We find that risks transferred to the private sector account for a very small share of public sector payments. This paper also concludes that the costs to the public sector, through the payment obligations, far outweigh those assumed by the private sector. Consequently, this paper examines whether the SCUT concessions were successful in regards to achieving VfM. The high gains to the private sector may suggest otherwise. However, given that there was no comparison of VfM between the PPP approach and an alternative procurement route, it is not possible to draw any concrete conclusions.
Keywords: risk allocation, risk valuation, value-for-money, NPV-at-risk
iii
Acknowledgements
I am indebted to my supervisors, Professors Ricardo Ferreira Reis and Joaquim Miranda Sarmento, for their clear guidance, insightful knowledge of the subject at hand, and for dispatching to me the relevant academic research material for my dissertation.
I also wish to extend my sincere thanks to Professor Leonor Modesto for introducing me and recommending me to take part in the Public-Private Partnerships Seminar from which I was able to bridge the gap in my understanding and application of risk valuation methods.
My heartfelt thanks goes to Professor Teresa Lloyd-Braga who has been instrumental in shaping my time at Católica-Lisbon School of Business and Economics. Her guidance and assistance have been invaluable.
This endeavor would not have been possible without the emotional support, companionship, and constructive input of friends who both far and near created an enabling environment for me.
Last but not least, a special thanks goes to my parents for their unshakable support. Their constant faith in my ability is the lightening rod that has guided me through some of the most questionable moments in my life; for this, I am most grateful.
iv
TABLE OF CONTENTS
ABSTRACT ... ii ACKNOWLEDGMENTS ... iii Table of Contents ... iv 1. Introduction ...1 2. Literature Review ...3 2.1. Value-for-Money ...32.2. Risk Allocation Strategies ...5
2.2.1. Risk Identification ...8
2.3. Benchmark of Shadow Toll Contracting ...9
3. The SCUT Concessions: The Case of Portugal ...11
3.1. Background ...11 3.2. Risk Matrix ...13 4.Methodology ...15 4.1. Evaluation Methods ...15 4.2. Basic Assumptions ...16 5. Results ...17 6. Conclusion ...21 7. References ...23 Appendix ...26
1
1. Introduction
In recent years, the challenge of bridging infrastructure gaps while working within budgetary constraints have led many governments to seek out new mechanisms of financing public projects. One of these mechanisms involves the private sector financing the provision of public services through Public-Private Partnerships (or PPPs) (Grimsey and Lewis, 2002, 2004, 2005). In its basic form, a PPP is a long-term contract between a government agency and a private operator to deliver a public good or service. Although a PPP arrangement involves many stakeholders, in this study, we focus on two main groups, i.e. the public and private companies. In contrast to traditional procurement models where public infrastructure and services are provided almost exclusively by the public sector, PPPs allow the private sector to take on substantially greater risk, enabling the public sector to capitalize on private sector efficiency through optimal risk transfer (Grout, 1997; Hart et al, 1997; Bentz et al, 2002; Guasch, 2004; Corner 2006). In their study of competitive tendering and contracting, Domberger and Rimmer (1994) find that governments can save up to 20% on service expenditure by applying competitive tendering (qtd. in Grimsey, 2003).
However, PPPs are not without challenges. Their complex structure coupled with potentially conflicting stakeholder interests, different attitudes towards risk, and different skills in risk management make it unsuitable for some projects (Jin and Doloi, 2008). These inherent characteristics expose the parties involved in the contract to high level of risk. As highlighted by Thompson and Perry (1992), if risks are inadequately borne by ces to pay for Conversely, should risks be inadequately borne by the private sector,
(qtd. in Jin and Doloi, 2008, pp. 708). Thus in the absence of optimal risk allocation, PPPs may fail to generate
value-for-combination of whole-of-life costs and quality (or fitness for purpose) of good or service ng VfM is the primary objective in PPPs.
2
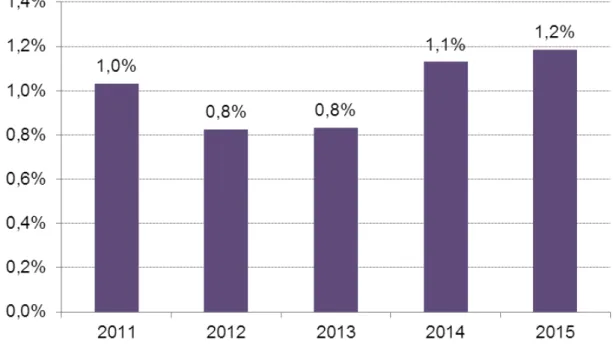
1). Similarly, as shown in Exhibit 2 (see appendix), projected gross payments of current of which the road sector makes up the highest share. Moreover, seeing as the projected gross payments of current PPPs for the next three years make up about 1% of gross domestic product (see appendix,
partnerships have been raised. According to Cruz and Marques (2010, pp. 4030
annual burden of these projects in a climate of constraining public expenditure has led to
an overall negative p . It does not come as a surprise
especially as it concerns the road sector that some infrastructure projects have been put on hold and others are being modified. The SCUT concessions are a case in point and merit greater analysis.
The shadow toll concessions (SCUT) one of the major initiatives undertaken by the Portuguese government to develop the national transport infrastructure were originally approved and
government, and not the users, pay for the road usage. However, this has proved unsustainable for the Portuguese budget and has led the government to apply tolls to these roads. Accordingly, this study focuses on the seven SCUT concessions and aims to analyze and evaluate their allocation of risks between the public and private sectors. The study seeks to answer the following three main questions:
(i) how are risks allocated between the public and private sectors? Consequently, (ii) how to best evaluate the risks allocated or transferred to the private sector? And finally,
(iii) how much risk has the private sector assumed?
Our analyses show that with the exception of demand risk, risks under the SCUT concessions were well allocated between the two parties. The quantitative evaluation shows that the risks transferred to the private sector represent a very small share of what the public sector is paying, and that the costs to the public sector, through the payment obligations, are relatively large. Apart from Grande Porto, all the concessions register after-risk transfer gains (before taxes).
The paper is organized as follows. Section 2 provides a brief theoretical background of the related literature on the concept of VfM and risk allocation with
3
particular focus on VfM evaluation and risk allocation strategies and identification, respectively. This is followed by a benchmark assessment of countries with shadow toll payment systems. In section 3, a comprehensive background analysis of the SCUT concessions is provided followed by a detailed qualitative assessment of the SCUT concessions in a risk matrix. Section 4 outlines the methodology and basic assumptions. Here, we quantitatively evaluate key risks in each of the concessions through a sensitivity analysis in net-present-value (NPV) terms. A second method, NPV-at-risk, using Monte Carlo simulation is also undertaken. The results are presented and discussed in section 5. Section 6 outlines the limitations of the study and the conclusions reached.
2. Literature Review
While there is no single definition of a PPP, a commonly referenced interpretation is that a PPP is a long-term contract between a public body and a private operator in which arrangements concerning the design, construction, operation, and financing of a public project are made with the aim of enhancing the value of public assets (Guasch, 2004; Grimsey, 2005; OECD, 2008). As advanced by Grimsey (2005), from the viewpoint of the public sector, VfM is the driving principle for procuring PPPs.
2.1. Value-for-Money
The decision to undertake a PPP is based on the principle that they provide greater value-for-money (VfM) through risk transfer. VfM can be defined as representing an optimal combination of cost effectiveness and quality. Six drivers underpin VfM. These are: risk transfer; the long-term nature of contracts (including whole-of-life cycle costing); the use of an output specification; competition; performance measurement and incentives; and private sector management skills (Arthur Andersen and Enterprise LSE, 2000; Grimsey and Lewis, 2005). Of the drivers outlined above, the literature identifies risk transfer to be the most important (Hayford, 2006; Jin and Doloi, 2008; among others). However, as Hayford (2006) rightly asserts, risk transfer to the private sector will only create VfM if the costs assumed by the public sector through the risk transfer are less than the costs it would incur if it were to manage the risk itself. Accordingly, prior to pursuing a project through PPP, the government will need to assess which of the two
4
procurement options determines best VfM. This requires an ex ante comparison of VfM of both the PPP and traditional procurement (Grimsey and Lewis, 2005; OECD, 2008).
VfM assessment should be based on qualitative and quantitative factors. A qualitative analysis normally encompasses setting objectives based on the scope of the project, regulatory issues, and market assessment (level of competition), as well as desired project outcomes. As will be shown in the coming sections, risk identification is one of the first steps taken towards risk management and its role in facilitating proper risk allocation is unquestionable. A risk matrix is therefore one of the commonly used tools to qualitatively assess VfM.
The Public Sector Comparator (PSC), on the other hand, is the main quantitative test for VfM. Although various alternative tests exist, the PSC is argued to be less complex and more flexible than most other options (Grimsey and Lewis, 2005). Its assessment is based on cashflow terms discounted at the public sector rate and then after the reference PPP has demonstrated better value than the public provision strategy can the project proceed to the bidding phase (OECD, 2008). PSC estimates the hypothetical risk-adjusted cost if a project were to be financed, owned and implemented by the government. It also provides a consistent benchmark and evaluation tool, and it encourages competition by generating confidence in the market. The latter point is worth noting as competition before and after the bidding process, is fundamental to the success of the project. In the event of post-contract renegotiation, for instance, the monopolist (the winning bidder) holds the advantage in comparison to a competitive entity when dictating negotiation terms. Also, the monopolist is more likely to be prone to
established, competition in the bidding process is relied upon to ensure VFM Grimsey
5
2.2. Risk Allocation Strategies
The main premise underlying PPPs is that risk should be allocated to the party
best able to manage it (Grimsey and Lewis, 2005; Corner 2006). Irwin (2006)1 proposes a
more detailed framework which considers the ability of each party to (i) influence the corresponding risk factor; (ii) influence the sensitivity of total project value to the corresponding risk factor; and (iii) absorb the risk However, the question of how risks
particular risk transferred to the private consortium in one project, while retained by the
government or shar 2008, pp.708). Zou et al (2008) find
that to guarantee the success of PPP infrastructure projects, proper risk identification and allocation should be conducted from a life-cycle perspective. That is, it should be conducted from the feasibility study stage to operation and transfer stages with continuous monitoring, all the while ensuring VfM and taking into account public and private interest considerations.
Relevant literature increasingly articulates the paramount role of PPP arrangements in closing infrastructure gaps created through government inefficacies in the conventional provision of infrastructure (Jin and Doloi, 2008), making a case for PPPs and their efficiency of service delivery in comparison to traditional public procurement (Grimsey, 2003; Corner, 2006). Brealey et al (1997) for instance, argue that due to its higher agency costs, the public sector is likely to be less productively efficient than the private sector. Early empirical evidence has shown, however, that most of the risk is usually borne by the public sector. According to Arrow and Lind (1970), the government generally holds the advantage of a more efficient distribution of risks because it is able to spread risk among taxpayers. However, a counterargument is that the cause of
contingent liability, i.e., the taxpayer will always pay the bill (Grimsey, 2003). Nevertheless, Thomas et al (2003) show that
inevitably be allocated to the party least able to refuse them rather than the party best able
to manag 2008, pp.708). This goes to show that unless
risks are appropriately distributed among the respective entities, a PPP scheme can be
1
6
-for-money basis, what oosemore, 2007, pp. 70).
Another challenge associated with these types of arrangements is that government guarantees2 are not subject to the same degree of scrutiny by going through the budget
process as regular spending guarantee legally binds a
(Hemming, 2006, pp.30). Furthermore, most PPP projects are recorded off-balance sheet, allowing governments to delay payment and in the process secure private financing and 2007, pp.1). However, this can cause major problems as off-balance sheet financing enables governments to by-pass expenditure controls, which in effect can obscure government liabilities. In the case of
Marques, 2010, pp.4027).
The preceding discussion on risk allocation naturally leads one to ask how risks should be evaluated and how to account for uncertainty as well as risks in PPPs (Grimsey and Lewis, 2002, 2004, 2005). Uncertainty and risk are present whenever a project has more than one possible outcome. Whereas risk can be characterized by some calculable probability on a future event occurring and the corresponding effect it would have on expected outcomes should it materialize (Broadbent et al., 2008), in the case of uncertainty, the future outcome is unclear, hence actual probabilities cannot be assigned (qtd. in Demirag 2010; Grimsey and Lewis, 2004). A likely consequence of uncertainty in these types of arrangements long planning horizon, complex structures, information asymmetries and especially in conventional procurement models is optimism bias through cost overruns. However, unlike in conventional procurement models, with PPPs optimism bias is minimized through the project cycle (Flyvbjerg et al., 2003; Flyvbjerg B, 2004).
A fundamental aspect of PPPs is balancing the interests of the public and private sectors. Due in part to different attitudes towards risk and responses to uncertainty,
2
A guarantee is a form of government intervention intended to reduce the financial costs of risks faced by the private sector and/or by other public sector entities should risks (Hemming, 2006).
7
differing views abound concerning the appropriate discounting method to use in these types of partnerships. Arrow and Lind (1970) argue that when calculating the present value of returns from a public investment a distinction must be made between private and
3 rate of 3,5% is used as the real discount rate for PPPs; meanwhile in Australia the discount rate is based on the risk-free rate adjusted for risk through the standard Capital Asset Pricing Model (CAPM) (Sarmento, 2010).
While some argue otherwise (Grout and Klein, 1997; Modigliani and Miller, 1997), it is widely acknowledged that private sector borrowing costs are higher than the ing at a risk-free rate. A more unanimous consensus, however, is that projects have to earn at least the weighted average cost of capital (WACC) to be acceptable by investors. Hence, the discount rate allowing for the identification of a viable project is determined by its WACC (Brealey et al, 1997). At the same time, WACC alone does not reflect the required risk premium. Ye and Tiong (2000) show that a combination of the WACC and the dual risk-return methods can provide a better decision for risk evaluation of privately financed infrastructure projects.
For the purpose of this study, four different discount rates are used in evaluating (2003, C68) argument that the practice of using the same discount rate for conventional
favors too much public sector provision,
used in this study is adjusted for risk through the addition of a risk margin (reflecting systematic risk), to a risk free rate.
We now proceed to a brief description of the types of risks inherent in PPPs. A more detailed identification of risks specific to the SCUT concessions is provided in section 3 where a risk matrix is used as a way to qualitatively assess the projects in question.
3
and a measure of preference reflecting the idea of decreasing money preference with increasing per capita income.
8
2.2.1. Risk Identification
As previously highlighted, there are two dimensions to risk allocation through VfM; qualitative and quantitative. Here, we focus on the qualitative dimension, i.e., the -by-step analysis of
cost-Lewis, 2004, pp.87). The ability of PPPs to allow for risk sharing between the parties involved in the contract is driven by VfM, which in essence reflects the risks and uncertainties in these types of arrangements. Risk identification is therefore one of the most critical stages in risk allocation. Hence, a process of due-diligence must be applied to assess the impact of relevant risks and the extent to which they are covered by the contractual agreement as well as to set alternative mitigation measures should the need arise. For instance, operating cost overruns may seriously hinder the creation of VfM. To manage this type of risk, a fixed-price contract can be considered. This type of contract would provide incentives for cost minimization in that the oper
relating to the fluctuations in operating costs and makes a profit only if the costs actually
Qualitative assessment using a risk matrix helps identify which risks are shared, retained or transferred to the party best able to manage them (Yescombe, 2001). In chronological order, risks can be identified and categorized as follows (Gatti, 2008):
(i) Pre-completion phase risks: activity planning, technological, construction risks;
(ii) Post-completion phase risks: supply, operational, market risks; and,
(iii) Risks common to pre-completion and post-completion phase: interest rate risk, exchange risk, inflation risk, environmental risk, regulatory risk, legal risk, credit risk.
9
2.3. Benchmark of Shadow Toll Contracting
Although not as widely adopted as actual tolls, shadow tolls are used in some parts of Europe as well as in Canada. The U.K. pioneered the concept and practice of shadow tolls dating back to the early 1990s through its implementation of the Private Finance Initiative (PFI), a strategic economic policy that delegated financing of public infrastructure projects to the private sector.4 Between 1993 and 1996, the U.K. instituted eight 30-year long shadow toll contracts which accounted for about 35% of all new construction projects between 1996 and 2001. It is estimated that payment for these eight contracts totals £220 million annually, translating into a total cost of approximately £6 billion over the life of the contracts (Shaoul et al., 2006). It is important to stress, however, that the introduction of shadow tolls in the U.K. was seen as a transitory mechanism for moving to a system of real tolls some time in the future (Grimsey and Lewis, 2004, Shaoul et al., 2006).
Besides the U.K., shadow tolls are also in use in Belgium, Canada, Finland, the Netherlands, and Spain. In the Netherlands, one case under a shadow toll scheme is the Noord tunnel, whose competitive tendering process was launched in 1991 (Bousquet and Fayard, 2001). In New Brunswick, Canada, the Fredericton-Moncton highway project has recently been converted to a shadow toll scheme (Taylor et al., 2001), and there are cases where a combination of real and shadow tolling is used, such as the Golden Ears Bridge in British Columbia (Buxbaum and Ortiz, 2009). In Spain, the M45-M501 8km long highway around Madrid has been upgraded through three separate shadow toll procurements and is currently at its pre-design stage (Report, 2009).
Shadow toll concessions take the form of a DBFO scheme where the concessionaire designs, builds, finances and operates the road without necessarily owning the assets used to develop the project (Yescombe, 2002). Usage payments for shadow toll-based projects are made by the public entity and not the users, for whom the infrastructure is free. The public sector pays the concessionaire, at least in part, on the
60). Under DBFOs, payments can also be made based on performance which is measured
4
10
in terms of road availability (e.g. number of lanes closed to traffic) and road safety conditions. In the event of higher than expected traffic, for instance, the concessionaire is overcompensated, in other words, paid in excess of what was planned but is subject to a capped revenue threshold (Bousquet and Fayard, 2001). Although there are cases in
which shadow toll contracting are regarded as availability payments5, these two forms of
payment slightly differ in their approach. While shadow tolls rely on traffic volumes, availability payments are based on other dimensions of service quality, including safety and minimum performance criteria.
It is also worth emphasizing that shadow tolls are not a source of funding in and of itself but rather a tool that allows for the pooling of new sources of capital. Perhaps one of the key advantages of such a payment mechanism is that they are politically appealing and generate little, if any, resistance from users. There is no tendency for
taxes associated with the road sector. In Finland, for example, a shadow toll system was adopted partly as a result of existing high motor spirit, road tax and customs duties. Also, the low level of road usage did not justify the use of real tolls, hence a shadow toll was considered a better and more feasible alternative. The second key advantage of shadow tolls is that there are no expenses associated with toll collection. Whereas under a toll system, additional costs related to the construction, maintenance, and operation of toll collection facilities can be rather significant. It is estimated that an average of about 10% to 15% of revenue is absorbed by toll collection costs (Bousquet and Fayard, 2001).
Despite these advantages, as highlighted earlier, shadow tolls do not generate new sources of capital, a not-so-cost-effective option for the public or the private sector (depending on whether the maximum revenue is capped). Moreover, users are not subject to the real costs of using the road. Further criticism has also been rai
National Audit Office concerning the appropriateness of transferring volume risk or downside demand risk to the private sector as the latter is unable to influence demand using pricing measures (Grimsey and Lewis, 2004). Overall, shadow toll contracting makes for a feasible payment mechanism for private finance either as an interim
5
11
financing mechanism preceding the application of real tolls or when the levying of tolls prevents or inhibits the use of the infrastructure.
3. The SCUT Concessions: The Case of Portugal 3.1. Background
Following the launch of the National Road Program in 1996, the SCUT concessions were put into tender in 1998 as part of an initiative by the Portuguese government to improve the provision of public infrastructure in relatively poor regions. It consists of seven concessions, namely, Algarve, Beira Interior, Beiras Litoral & Alta, Costa de Prata, Interior Norte, Grande Porto, and Norte Litoral operating under a design, construct and operate scheme. These represent approximately 930 km of new highways, equivalent to 30% of national road concessions at the time. PPPs are project finance, and as such they are financed mainly through debt, usually 70%-90% (Esty, 2004). Under
Portuguese), payments to the private consortium for road usage are made by the public entity rather than the users. Payments were based on traffic volume at a pre-established rate per vehicle. These were made annually to the private bidders (through tax payers money) using the following band structure (Sarmento, 2010):
(i) Band A: a payment of x per vehicle per kilometer for the first (a*1000) vehicles per day (vpd)/km;
(ii) Band B: a payment of y per vehicle per km for the next (b*1000) vpd/km; and (iii) Band C: All higher levels of vpd/vkm = no payment.
Burdened by budget constraints and rising fiscal costs, in September of 2010 the Portuguese government announced its decision to discontinue the shadow toll system in favor of a real toll model. An estimate of the costs to the public sector associated with the concessions is presented in Exhibit 4. The renegotiation process for the introduction of real tolls is in progress and at its concluding phase. Phase one of the introduction of tolls came into effect in October of 2010, and encompassed the areas, Costa de Prata, Grande Porto and Norte Litoral. The second and last phase took place in December of the same year, covering the remaining four concessions. The new payment structure allows the concessionaire to charge the respective usage fees which the concessionaire then hands
12
over to the public sector, Estradas de Portugal, and is remunerated based on road availability.
Exhibit 4. SCUT - Annual Payments over the Life of the Concessions (Euro million)
0 100.000 200.000 300.000 400.000 500.000 600.000 700.000 800.000
Source: Court of Audit Report
The introduction of the SCUT concessions was, in many respects, conceived as a provisional arrangement. It was intended that once the regions covered under SCUT reached a GDP per capita equal or superior to 80% of the national level, a purchasing power equal or superior to 90% of the national indicator, and the alternative roads to SCUT achieved one third of the travel time permitted in the SCUT concessions, a move towards real tolling would ensue. Concomitant with the high financial costs incurred through the concessions, part of the controversy surrounding these concessions is also motivated by the fact that of the 930 km area covered under SCUT, only 55% falls under ot fully justify the motivation proclaimed by the government in the first place.
In light of the above, did the SCUT concessions create VfM? Subsequently, how was the risk allocation between the two entities? In order to answer, we now proceed to
13
an assessment of the concessions starting with the qualitative dimension in the form of a risk matrix.
3.2. Risk Matrix
Table 1 provides the risk allocation for the SCUT concessions. As stated earlier, risk allocation is complex due to the confluence of factors impacting the project. A risk matrix helps identify which risks are retained by the public sector, which are transferred to the private sector, and which are shared. As can be seen in the matrix, some risks do not fall distinctly within the private or public sector and have to be shared between the two parties. Arguably, the allocation of availability risk in service level, for instance, would be better managed if transferred to the private entity as it is a measure of performance concerning the service provided. This way, incentives would be given to the private party to achieve cost minimization. On the other hand, risks due to changes in environmental standards or laws have all been allocated to the private sector although they would have been better mitigated if shared with the public sector as the latter is better able to influence environmental laws.
Literature identifies the demand, construction, financial, and operating and maintenance (O&M) risks as the main risks that can be transferred to the private sector and the rest are merely residual (OECD, 2008). From this Table, we can see that construction (with the exception of unilateral changes and expropriation), O&M (with the exception of unilateral changes, accidents and latent defects which are shared) and financial risks were all transferred to the private sector. The demand risk, on the other hand, was shared until 2010 but later retained by the public sector upon renegotiations based on the new band structure outlined above. Allocating demand risk to the public sector reduces private sector risk, equally reducing incentives for private sector efficiency.
Accordingly, therein lies the scope of this study and the motivation driving it. Assessing the values of these three main risks transferred to the private sector and comparing them against the government payments
14
Table1. Allocation of Risks within the SCUT Concessions
Source: Columns (i), (iii), (iv) and (vi): Direção-Geral do Tesouro e Finanças (2011). Columns (ii) and (v): assessment based on Ball et. al. (2003) risk composition.
Types of Risks (i) Description (ii) Designation (iii) Phase (iv) Impact of Risk (v) Allocation (vi)
Design Project Private Planning Project Public Obtaining licenses and
necessary approval Project Private Disinterest on the part of
the private tender Bidding Public Failure to meet deadlines
and procedures Bidding Private Occurence of
disputes/complaints Bidding Shared Meeting deadlines Construction Medium Private Additional costs (extra
work) Construction
Medium Private
Unilateral changes Construction Low Public Quality/reliability Construction Low Private Expropriation
(implementation and costs) Construction Low Private
Expropriation (on publication of the declaration of public utility)
Construction Low Public
Damage to infrastructure (own/third party/injury to workers)
Construction Medium Private
Toll collection Operation Medium Private Additional costs (extra
work) Operation Medium Private Accidents Operation Low Shared Unilateral changes Operation Low Public Changes to implemented
technology Operation Low Private Failure to meet quality
levels
Operation Medium Private
Latent defects Operation Low Shared
Inflation Construction/Operation
Low Private
Interest rates Construction/Operation Medium Private Default Construction/Operation High Private Post-environmental
assessment Project Private Environmental
standards/laws Construction Private
Demand
Unforeseen variation in the demand for the service generated by the project
Traffic Operation Shared
Disruption in supply Operation Private Service level Operation Public General legislative
ammendments Construction/Operation Private Specific legislative
ammendments Construction/Operation Public Artifacts Construction Public Natural Disasters Project/Operation Shared Wars Project/Construction/Operation Shared
Availability Unforeseen variation in the supply of service Regulatory/Legal Unforeseen variation in regulatory conditions Force Majeure Unforeseen variation due to war, civil disturbance, etc. Operation and Maintenance Unforeseen variation due to cost overruns, maintenance delays, etc. Financial Unforeseen variation in relevant financial indicators, risk of default, etc.
Environmental Unforeseen variation due to adverse environmental hazard Project and Bidding Unforeseen variation due to bad planning, loss of transparency in bidding, etc. Construction Unforeseen variation due to faulty construction techniques, construction delays, etc.
15
4. Methodology
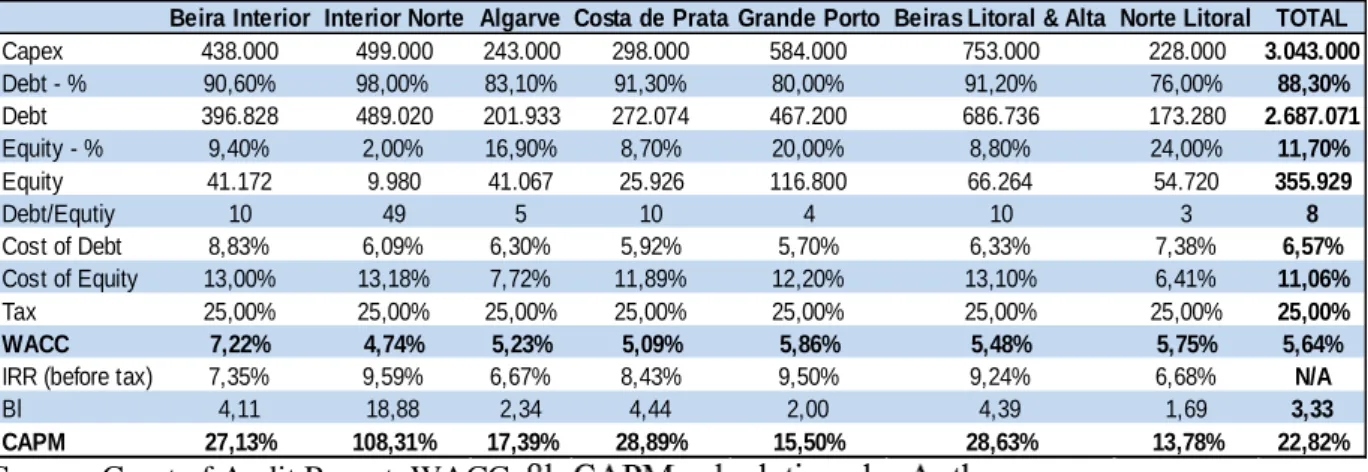
Based on the main risks identified, three input variables were used as a basis for our evaluation. These are: capital expenditure (capex), interest costs, and operating and maintenance (O&M) costs. It is essential that risks be considered on a project-by-project basis, hence the study assesses risks for each of the concessions. The data used was obtained from the Portuguese Public Road Institute (as shown in Table 2) and from the Court of Audit Report.
Table 2. SCUT Data
Source: Court of Audit Report. WACC,
4.1. Evaluation Methods
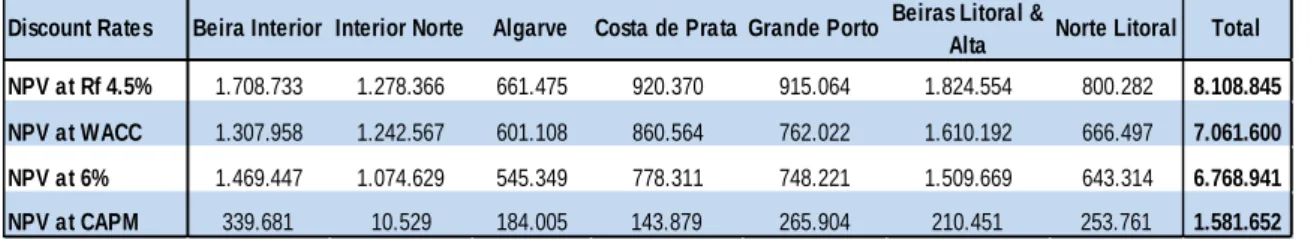
First, the net present value (NPV) of government payments and those of the costs (capex, interest costs, O&M costs) were calculated. In calculating the NPVs, four different discount rates were applied, namely,
(i) the Portuguese risk free rate of 4,5% based on a 10-year yield on government bond (before 2008 financial crisis);
( ii) the legal Portuguese discount rate, as of 2003, for PPPs of 6%;
(iii) WACC-based discount rates incorporating both equity and debt financing; and
(iv) CAPM-determined discount rates reflecting the level of systematic risk associated with each project.
Second, a sensitivity analysis of the main input variables using the four discount rates was carried out to test the robustness of the results obtained from the NPV analysis.
Beira Interior Interior Norte Algarve Costa de Prata Grande Porto Beiras Litoral & Alta Norte Litoral TOTAL
Capex 438.000 499.000 243.000 298.000 584.000 753.000 228.000 3.043.000 Debt - % 90,60% 98,00% 83,10% 91,30% 80,00% 91,20% 76,00% 88,30% Debt 396.828 489.020 201.933 272.074 467.200 686.736 173.280 2.687.071 Equity - % 9,40% 2,00% 16,90% 8,70% 20,00% 8,80% 24,00% 11,70% Equity 41.172 9.980 41.067 25.926 116.800 66.264 54.720 355.929 Debt/Equtiy 10 49 5 10 4 10 3 8 Cost of Debt 8,83% 6,09% 6,30% 5,92% 5,70% 6,33% 7,38% 6,57% Cost of Equity 13,00% 13,18% 7,72% 11,89% 12,20% 13,10% 6,41% 11,06% Tax 25,00% 25,00% 25,00% 25,00% 25,00% 25,00% 25,00% 25,00% WACC 7,22% 4,74% 5,23% 5,09% 5,86% 5,48% 5,75% 5,64%
IRR (before tax) 7,35% 9,59% 6,67% 8,43% 9,50% 9,24% 6,68% N/A
Bl 4,11 18,88 2,34 4,44 2,00 4,39 1,69 3,33
16
Third, we computed the NPV-at-risk for the base case NPV of payments and NPV of costs discounted at WACC. As shown by Ye and Tiong (2000), standard measures of risks and returns are limited in their scope and application of risk assessment and financing methods. NPV-at-risk on the other hand, combines a risk-adjusted discount rate method (WACC) and the dual-risk return method, capturing both the size of the acceptable deviation and the appropriate confidence levels in its assessment. Here, the WACC is the appropriate discount rate since it does not overestimate risks. Further, since the distribution functions of returns are not known, Monte Carlo simulation was conducted to generate the distribution of the possible NPVs assuming a normal
distribution. Using Ye and Tiong paper as a guide, we calculated the
NPV-at-risk for each concession taking into account the NPVs of payments and of the three main costs. NPV-at-risk is then given by: NPV-at-risk = NPVµ - Z( )*
Where Z( ) is the number of units of standard deviation corresponding to is the confidence level
is the standard deviation
Lastly, a comparison between risk with NPV of payments and NPV-at-risk with NPV of costs allowed us to measure the value of NPV-at-risk for each project and estimate the gains in each project, respectively.
4.2. Basic Assumptions
The assumptions made in our analyses are as highlighted on Table 3. In addition, the literature considers the level of transferred risk on transport to be low or medium low (Sarmento, 2010). An unlevered beta of 0,5 based on Damadoran (2012) is used in our analysis. Accordingly, the risk-adjusted rates based on the CAPM were determined using
each of l = u [1 + D/E (1 t)]; where D/E
stands for the debt-to-equity ratio, and t, the tax rate. The CAPM for a single project is calculated using the following formula:
CAPM : Ri = Rf + l (Rm f )
Where R is the required return on the project
Rf is the risk free rate (4,5%)
17
Rm is the expected return
Table 3.
5. Results
Table 4 indicates the NPV payments using the four discount rates. As can be seen, NPV payments are quite sensitive to the discount rate. For instance, the 0,36% differential between the 6% and WACC rates amounts to a differential of approximately
300 million in total NPV payments.
Table 4. Discounted NPV Payments (Euro million)
Source: Authors.
To reflect the uncertainty inherent in the projects, sensitivity analyses in NPV terms were performed for each of the concessions: using downside and upside assumptions regarding the capex, interest costs and O&M costs (applying the four discount rates). The results of the sensitivity analyses are set out in Tables 5, 6, 7 and 8 (see appendix). Here, we also see that the discount rates have a profound impact on the NPV of costs and that the NPV of costs show significant downside and upside variations. Moreover, these results illustrate why the determination of the appropriate discount rate for evaluating these types of projects (especially as it concerns the appraisal stage) is one of the most critical, and the most debated in the literature.
Variable Assumption
Capex (Table 2): 5 years (constant)
Major repairs every 10 years = 10% Capex + 3% annual inflation
Debt (Table 2): Maturity = 20 years (principal repayment on a constant annual basis) Interest rate = Cost of Debt (Table 2)
Real data until 2010 based on Company Financial Report Inflation = 3% annually
Capex Interest Cost
O&M Cost
Discount Rates Beira Interior Interior Norte Algarve Costa de Prata Grande Porto Beiras Litoral &
Alta Norte Litoral Total NPV at Rf 4.5% 1.708.733 1.278.366 661.475 920.370 915.064 1.824.554 800.282 8.108.845
NPV at WACC 1.307.958 1.242.567 601.108 860.564 762.022 1.610.192 666.497 7.061.600
NPV at 6% 1.469.447 1.074.629 545.349 778.311 748.221 1.509.669 643.314 6.768.941
18
In determining the
NPV-at-simulation (with 1000 iterations) was run based on the base case distributions (mean and standard deviation) for each of the main risks identified (capex, interest, O&M) as well as the risks associated with government payments. The reason we consider payment risk is because it represents country risk. With a 95% confidence level, the results of the assessment are shown in Table 9. The NPV-at-risk Total Costs captures the three main risks allocated to the private sector. In absolute value, concessions Beiras Litoral & Alta, Beira Interior, and Interior Norte (in descending order) are the most expensive to the state. Capex and payment risks are the most important.
Table 9. NPV-at-Risk Assessment (discounted at WACC)
Source: Authors.
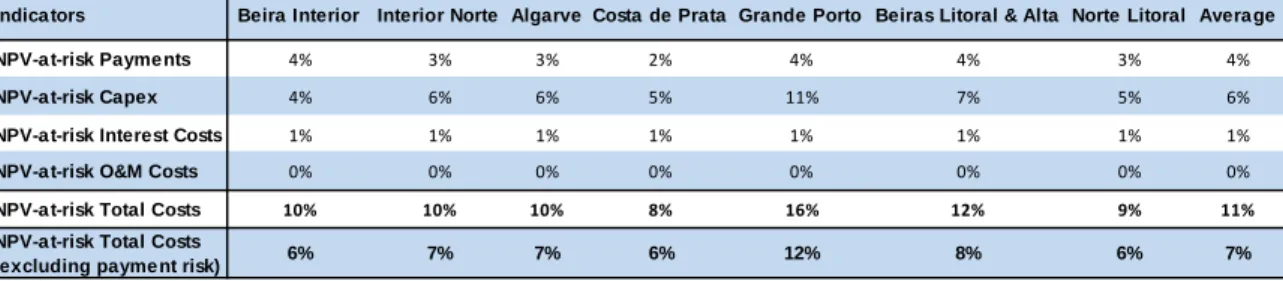
Further, as shown in Table 10, on average, 11% of payments (including payment risk) went to cover risks of which capital expenditure is the highest at 6%. O&M risks on the other hand, are almost negligible. Grande Porto and Beiras Litoral & Alta indicate the highest share of risk as percentage of payments both with and without payment risk (see also Exhibit 5).
Table 10. Weight of Risks as Percentage of NPV Payments
Source: Authors.
Indica tors Beira Interior Interior Norte Algarve Costa de Prata Grande Porto Beiras Litoral & Alta Norte Litoral TOTAL
NPV-a t-risk Payme nts 54.273 35.544 20.632 20.024 31.664 65.206 19.815 247.158
NPV-a t-risk Capex 58.794 76.849 36.304 45.157 83.745 111.502 33.022 445.373
NPV-a t-risk Interest Costs 13.419 7.855 5.145 6.444 9.848 16.690 5.050 64.451
NPV-a t-risk O&M Costs 31 26 20 34 41 13 27 192
NPV-a t-risk Total Costs 126.516 120.274 62.102 71.659 125.299 193.411 57.914 757.175
NPV-a t-risk Total Costs
(excluding payme nt risk) 72.244 84.730 41.469 51.635 93.634 128.205 38.099 510.016
NPV Payments 1.307.958 1.242.567 601.108 860.564 762.022 1.610.192 666.497 7.050.908
Indica tors Beira Interior Interior Norte Algarve Costa de Prata Grande Porto Beiras Litoral & Alta Norte Litoral Avera ge
NPV-a t-risk Payme nts 4% 3% 3% 2% 4% 4% 3% 4%
NPV-a t-risk Capex 4% 6% 6% 5% 11% 7% 5% 6%
NPV-a t-risk Interest Costs 1% 1% 1% 1% 1% 1% 1% 1%
NPV-a t-risk O&M Costs 0% 0% 0% 0% 0% 0% 0% 0%
NPV-a t-risk Total Costs 10% 10% 10% 8% 16% 12% 9% 11%
NPV-a t-risk Total Costs
19
Exhibit 5. Weight of Risks as Percentage of NPV Payments
Source: Authors.
Exhibit 6 shows the difference between what the government is paying and how much it is getting in terms of risks, with the greatest NPV payment and total risk differential registered by Beiras Litoral & Alta and the smallest differential by Algarve.
Exhibit 6. NPV-Payment and Total Risk Differential (excluding payment risk)
Source: Authors. 0% 2% 4% 6% 8% 10% 12% 14% 16% 18% NPV-at-risk O&M Costs NPV-at-risk Interest Costs NPV-at-risk Capex NPV-at-risk Payments 72.244 84.730 41.469 51.635 93.634 128.205 38.099 1.307.958 1.242.567 601.108 860.564 762.022 1.610.192 666.497 0 200.000 400.000 600.000 800.000 1.000.000 1.200.000 1.400.000 1.600.000 1.800.000
20
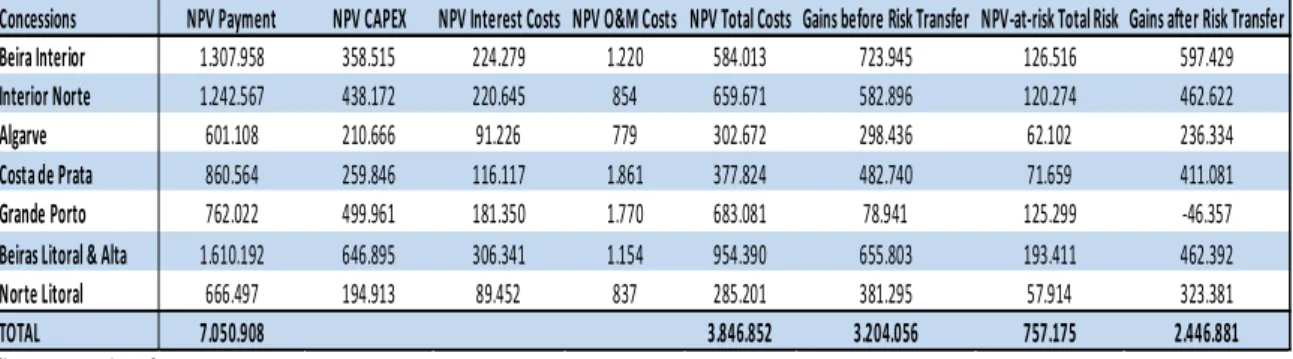
The main results of our analyses regarding NPV-at-risk are shown in Table 11. Here, total risks also include payment risks. As can be seen in the last column of the Table, with the exception of Grande Porto, all the SCUT concessions show gains after-transfer risks (before taxes), indicating that the costs incurred by the public sector through the contract payments, far outweigh those assumed by the private sector.
Table 11. Gains Before & After-Risk Transfer (before taxes)
Source: Authors.
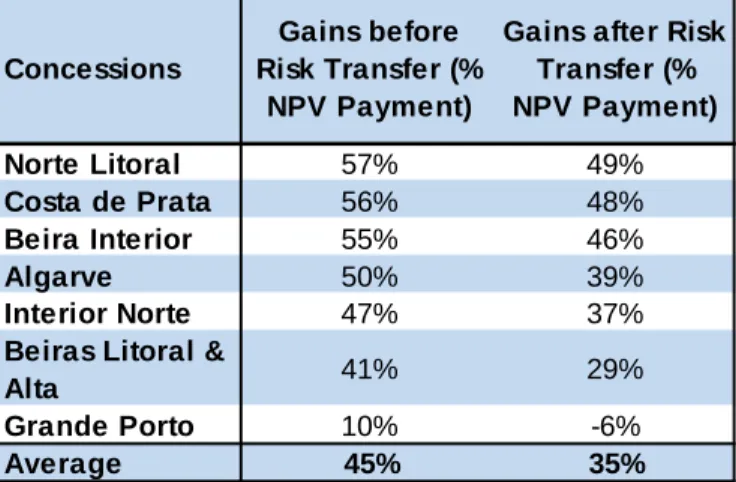
Finally, Table 12 reports the gains to the private sector as percentage of the NPV of payments before and after risk transfer. In descending order, Norte Litoral, Costa de Prata, and Beira Interior register the highest gains before and after risk transfer. Further, Grande Porto and Beiras Litoral & Alta provide for an interesting analysis. Among the concessions, they are the two that took on the most risk as percentage a of NPV payments (both when assessed with and without payment risk); this is also shown by the fact that both register above average share of risk (refer to Table 10). Correspondingly, they are the two concessions that report the smallest gains (or loss in the case of Grande Porto) as a percentage of NPV payments before and after risk transfer.
Concessions NPV Payment NPV CAPEX NPV Interest Costs NPV O&M Costs NPV Total Costs Gains before Risk Transfer NPV-at-risk Total Risk Gains after Risk Transfer Beira Interior 1.307.958 358.515 224.279 1.220 584.013 723.945 126.516 597.429
Interior Norte 1.242.567 438.172 220.645 854 659.671 582.896 120.274 462.622
Algarve 601.108 210.666 91.226 779 302.672 298.436 62.102 236.334
Costa de Prata 860.564 259.846 116.117 1.861 377.824 482.740 71.659 411.081
Grande Porto 762.022 499.961 181.350 1.770 683.081 78.941 125.299 -46.357
Beiras Litoral & Alta 1.610.192 646.895 306.341 1.154 954.390 655.803 193.411 462.392
Norte Litoral 666.497 194.913 89.452 837 285.201 381.295 57.914 323.381
21
Table 12. Weight of Gains before and after Risk Transfer
Source: Authors.
6. Conclusion
The objective of this study was threefold: first, it examined the allocation of risks between the public and private sectors in the seven SCUT concessions, namely, Algarve, Beira Interior, Beiras Litoral & Alta, Costa de Prata, Interior Norte, Grande Porto, and Norte Litoral. We concluded that for the most part, with the exception of demand risk,
risks under the SCUT concessions were well allocated between the two parties.
Then this paper identified the main risks transferred to the private sector and how to best evaluate them. Through a risk matrix we identified these risks to be the construction, financial and O&M risks. We used a valuation technique developed by Ye and Tiong (2000), NPV-at-risk, which incorporates both the WACC and the dual-risk return methods, thereby capturing both the size of the acceptable deviation and the appropriate confidence levels in our variables of interest.
Last, this study evaluated the main risks transferred to the private sector and
money to measure the gains, if any, for the private sector before and after risk transfer. We find that the risks transferred to the private sector represent a very small share of what the public sector is paying. On average, risk transferred to the private sector represents 11% of NPV payments which is in fact slightly higher but close to that of the Australian benchmark. The Australian benchmark of transferrable risks (based on other sector projects) is set at 8% (OECD, 2008). We also find that the costs to the public
Concessions
Gains before Risk Transfer (%
NPV Payment)
Gains after Risk Transfer (% NPV Payment) Norte Litoral 57% 49% Costa de Prata 56% 48% Beira Interior 55% 46% Algarve 50% 39% Interior Norte 47% 37%
Beiras Litoral &
Alta 41% 29%
Grande Porto 10% -6%
22
sector, through the payment obligations, far outweigh the costs taken in by the private sector. More specifically, with the exception of Grande Porto, all the concessions register after risk transfer gains (before taxes). On average, the concessions register before and after risk transfer gains (as percentage of NPV payments) of 45% and 35% respectively.
Limitations in this study are that the risk analyses and the subsequent valuation methods employed are limited to the projects in question and would not necessarily lead to the same conclusion in other projects. Other valuation methods may very well lead to different results. Another limitation is that this valuation exercise, as any other, is subject to the assumptions and expectations set by the authors, rendering it subjective.
Was risk crucial to achieving VfM? When looking at the high gains, doubts arise as to whether VfM was achieved. On the other hand, no conclusion can be drawn seeing as no alternative approach was analyzed. However, in a broader context and more in line with the existing literature on SCUT, when compared against the use of a PSC, Sarmento (2010) finds that procuring the projects through the PPP approach was far more expensive and did not add VfM to the public sector. Arguably, a substantial part of the inefficiency suggested from our analyses can be traced back to the appraisal process itself. The lack of public sector comparators in assessing the projects meant that cost estimates from bidders were not properly assessed and thus there was no way of assessing whether the PPP approach offered a superior outcome. Similarly, the absence of a legal and institutional framework for PPPs coupled with the significant number of PPP deals undertaken within a short time frame undermined, to a great degree, the performance and execution of the projects in question. The SCUT case strongly suggests the need for a more coherent and rigorous appraisal of infrastructure projects in Portugal.
The current study can be expanded by conducting more detailed analysis on risks. Similarly, a more comprehensive risk valuation exercise can be performed using other valuation methods. In addition, an interesting analysis can be had by comparing these projects with similar projects in other countries.
23
7. References `
Akintoye, A., Beck, M. and Hardcastle, C., (2003). Public-Private Partnerships:
Managing Risks and Opportunities, Blackwell Science Ltd.
Akintoye, A. and Beck, M., (2009). Policy, Finance and Management for Public-Private
Partnerships, 1st ed., Wiley-Blackwell.
Arrow, K. J. and Lind, R. C., (1970). Uncertainty and the Evaluation of Public Investment Decisions, American Economic Review, pp. 364-378.
Ball, R., Heafey M. and King, D., (2003). Risk Transfer And Value for Money in PFI Projects, Public Management Review, 5 (2), pp. 279-290.
Bentz, A., Grout, P.A., and Halonen, M., (2002). What should the state buy? Working Paper no. 01/040, Centre for Market and Public Organization.
Bousquet, F., and Fayard, A., (2001). Road Infrastructure Concession Practice in Europe. The World Bank.
Brealey, R. A., Cooper, I. A., and Habib, M. A., (1997). Investment Appraisal in the Public sector, Oxford Review of Economic Policy, 13(4), pp. 12-28.
Buxbaum, J. N., Ortiz, I. N., (2009). Public Sector Decision Making for Public-Private
Partnerships, Transportation Research Board.
Corner, D., (2006). The United Kingdom Private Finance Initiative: The Challenge of Allocating Risks, OECD Journal On Budgeting, 5(3), pp. 37-56.
Cruz, C. O., and Marques, R. C., (2010). Revisiting the Portuguese Experience with Public-Private Partnerships, African Journal of Business Management, 5(11), pp. 4023-4032.
Demirag, I., Khadaroo, I., Stapleton, P., and Stevenson, Caral., (2010). Public Private The Institute of Chartered Accountants of Scotland.
Esty, Benjamin, (2004). Modern Project Finance, John Wiley and Sons, Inc.
Flyvbjerg, B., N. Bruzeliu and W. Rothengatter, (2003), Megaprojects and Risks: An
Anatomy of Ambition, Cambridge University Press, Cambridge.
Flyvbjerg, B., (2004). Procedures for Dealing with Optimism Bias in Transport Planning. The British Department for Transport, Guidance Document.
24
Gatti, S., (2008). Project Finance in Theory and Practice: Designing, Structuring, and
Financing Private and Public Projects, Elsevier Inc.
Grimsey, D. and Lewis, M. K., (2002). Evaluating the risks of public private partnerships for infrastructure projects. International Journal of project Management, 20, pp. 107-118.
Grimsey, D., (2003). The privatisation myth, Public Infrastructure Bulletin, 1(2), Article 4. [Online] Available at: <http://epublications.bond.edu.au/pib/vol1/iss2/4> [Accessed 9 March 2012].
Grimsey, D. and Lewis, M. K, (2004). Public Private Partnerships: The worldwide
Revolution in Infrastructure Provision and Project Finance, Edward Elgar.
Grimsey, D. and Lewis, M.K., (2005). Are Public Private Partnerships value for money? Evaluating alternative approaches and comparing academic and practitioner views,
Accounting Forum, 29, pp. 345-378.
Grout, P. A., (1997). The Economics of the Private Finance Initiative, Oxford Review of
Economic Policy, 13 (4), pp. 53-66.
Grout, P. A., (2003). Public and Private Sector Discount Rates in Public-Private Partnerships, Economic Journal, 113 (486), C62-C68.
Hart, O., Shleifer, A., and Vishny, R. W., (1997). The Proper Scope of Government: Theory and an Application to Prisons. The Quarterly Journal of Economics, 112 (4) pp. 1127-1161.
Hayford, O., (2006). Successfully allocating risk and negotiating a PPP contract. [Online] Available at: <http://www.claytonutz.com/area_of_law/construction_and_major_projects /docs/PPP_Summit_Paper_May06.pdf> [Accessed 9 March 2012]
HM Treasury, (2006).
Available at: <http://www.hm-treasury.gov.uk/d/vfm_assessmentguidance061006opt.pdf > [Accessed 21 February 2012].
Hodge, G. A., Greve, C., and Boardma, A. E., (2010). International Handbook on
Public-Private Partnerships, Edward Elgar Publishing Inc.
Irwin., T.C., (2007). Government Guarantees: Allocating and Valuing Risk in Privately Financed Infrastructure Projects, The International Bank for Reconstruction and
Development/The World Bank.
Klein, M., (1997). The risk premium for evaluating public projects, Oxford Review of
25
Jin, X. and Doloi H., (2008). Interpreting risk allocation mechanism in public-private partnership projects: an empirical study in a transaction cost economics perspective, Construction Management and Economics, 26(7), pp. 707-721.
Leviäkangas, P., (2007). Private Finance of Transport Infrastructure Projects: Value and
risk analysis of a Finish shadow toll project, VTT Technical Research Centre of Finland.
Ministério das Finanças, (2011). Parcerias Público Privadas e Concessões, Direção-Geral do Tesouro e Finanças Publishing.
Ng, A. and Loosemore, M., (2007). Risk allocation in the private provision of public infrastructure, International Journal of Project Management, pp. 66-76.
OECD, (2008). Public-Private Partnerships: In Pursuit of Risk Sharing and Value for
Money.
Report, (2009). European PPP Report 2009. DLA Piper.
Robinson, H., Carrillo, P., Anumba, C. J. and Patel, M., (2010). Governance and
Knowledge Management for Public-Private Partnerships, Wiley-Blackwell.
Sarmento, J., (2010). Do Public-Private Partnerships Create Value for Money for the Public Sector? The Portuguese Experience. OECD Journal on Budgeting, 2010/1, pp. 93-119.
Schwartz, G., Corbacho, A., and Funke, K., (2008). Public Investment and Public-Private
partnerships: Addressing Infrastructure Challenges and Managing Fiscal Risks, Palgrave
MacMillan.
Shaoul, J., Stafford, A., and Stapleton, P., (2006). Highway robbery? A Financial Analysis of the Design, build, financing and operation (DBFO) in UK roads. Transport
Review, 26 (3), 257-74.
Tan, W., (2007). Principles of Project and Infrastructure Finance, Taylor and Francis. Tribunal de Contas (2003), Auditoria às Concessões Rodoviárias em regime de Portagem
SCUT. [Online] Available at: <http://www.tcontas.pt/pt/actos/rel_auditoria/2003/14
2003.pdf> [Accessed 21 February 2012].
Yescombe, E.R., (2002). Principles of Project Finance, Yescombe Consulting, Ltd. Zou, P. X. W., Wang, S. and Fang, D., (2008). A life-cycle risk management framework for PPP infrastructure projects, Journal of Financial Management of Property and
26
8. Appendix
Exhibit 1. Net Payments of Public-Private Partnerships 2008-2010 (Euro million)
Source: Direção-Geral do Tesouro e Finanças.
Exhibit 2. Projected Gross Payments of Public-Private Partnerships (Euro million)
27
Exhibit 3. Weight of Public-Private Partnership Payments as a percentage of GDP
Source: Ministry of Finance.
Table 5. Sensitivity Analysis at 4.5%
Variation Beira Interior Interior Norte Algarve Costa de Prata Grande Porto Beiras Litoral & Alta Norte Litoral 50% 991.681 999.956 468.298 581.369 1.083.719 1.492.980 451.514 20% 793.345 799.965 374.638 465.095 866.975 1.194.384 361.212 15% 760.289 766.633 359.028 445.716 830.851 1.144.618 346.161 10% 727.233 733.301 343.418 426.337 794.727 1.094.852 331.111 Base case NPV 661.121 666.638 312.199 387.579 722.479 995.320 301.010 -10% 595.009 599.974 280.979 348.821 650.232 895.788 270.909 -15% 561.953 566.642 265.369 329.442 614.108 846.022 255.858 -20% 528.897 533.310 249.759 310.063 577.984 796.256 240.808 -50% 330.560 333.319 156.099 193.790 361.240 497.660 150.505 Source: Authors.
28
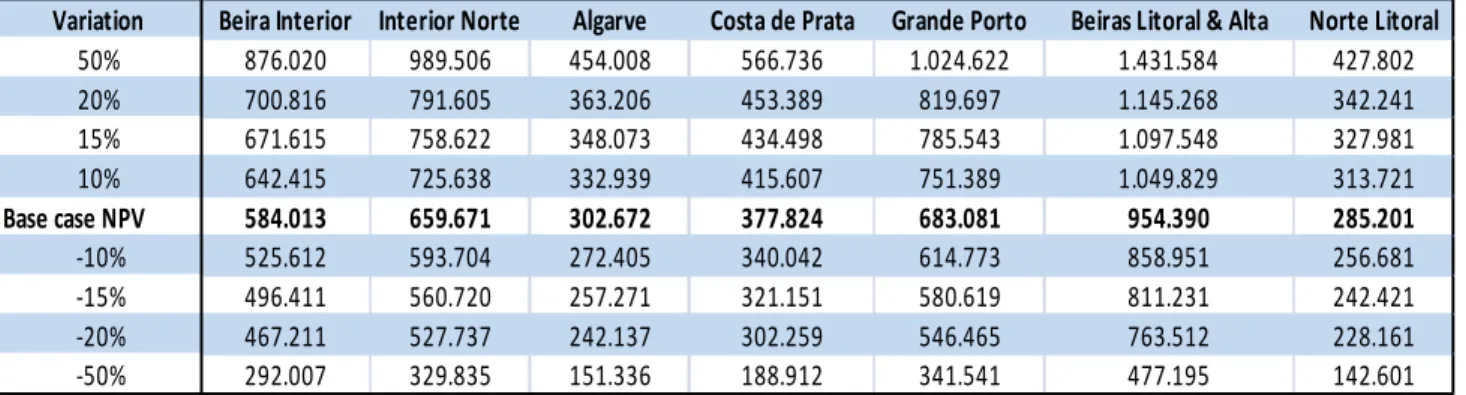
Table 6. Sensitivity Analysis at WACC
Variation Beira Interior Interior Norte Algarve Costa de Prata Grande Porto Beiras Litoral & Alta Norte Litoral 50% 876.020 989.506 454.008 566.736 1.024.622 1.431.584 427.802 20% 700.816 791.605 363.206 453.389 819.697 1.145.268 342.241 15% 671.615 758.622 348.073 434.498 785.543 1.097.548 327.981 10% 642.415 725.638 332.939 415.607 751.389 1.049.829 313.721 Base case NPV 584.013 659.671 302.672 377.824 683.081 954.390 285.201 -10% 525.612 593.704 272.405 340.042 614.773 858.951 256.681 -15% 496.411 560.720 257.271 321.151 580.619 811.231 242.421 -20% 467.211 527.737 242.137 302.259 546.465 763.512 228.161 -50% 292.007 329.835 151.336 188.912 341.541 477.195 142.601 Source: Authors.
Table 7. Sensitivity Analysis at 6%
Variation Beira Interior Interior Norte Algarve Costa de Prata Grande Porto Beiras Litoral & Alta Norte Litoral
50% 924.603 937.883 439.818 545.518 1.018.896 1.400.919 423.344 20% 739.683 750.306 351.854 436.414 815.117 1.120.736 338.675 15% 708.863 719.043 337.193 418.231 781.154 1.074.038 324.564 10% 678.042 687.781 322.533 400.047 747.190 1.027.341 310.453 Base case NPV 616.402 625.255 293.212 363.679 679.264 933.946 282.230 -10% 554.762 562.730 263.891 327.311 611.338 840.552 254.007 -15% 523.942 531.467 249.230 309.127 577.374 793.854 239.895 -20% 493.122 500.204 234.569 290.943 543.411 747.157 225.784 -50% 308.201 312.628 146.606 181.839 339.632 466.973 141.115 Source: Authors.
Table 8. Sensitivity Analysis at CAPM
Variation Beira Interior Interior Norte Algarve Costa de Prata Grande Porto Beiras Litoral & Alta Norte Litoral
50% 460.425 152.363 298.645 274.909 736.281 707.237 318.592 20% 368.340 121.891 238.916 219.927 589.024 565.789 254.874 15% 352.993 116.812 228.961 210.763 564.482 542.215 244.254 10% 337.645 111.733 219.006 201.600 539.939 518.640 233.634 Base case NPV 306.950 101.575 199.097 183.272 490.854 471.491 212.395 -10% 276.255 91.418 179.187 164.945 441.768 424.342 191.155 -15% 260.908 86.339 169.232 155.782 417.226 400.767 180.535 -20% 245.560 81.260 159.277 146.618 392.683 377.193 169.916 -50% 153.475 50.788 99.548 91.636 245.427 235.746 106.197 Source: Authors.
29
Exhibit 7. NPV-at-Risk Assessment (including Payment Risk)
Source: Authors. 1.307.958 1.242.567 601.108 860.564 762.022 1.610.192 666.497 0 200.000 400.000 600.000 800.000 1.000.000 1.200.000 1.400.000 1.600.000 1.800.000
Beira Interior Interior Norte Algarve Costa de Prata Grande Porto Beiras Litoral &
Alta Norte Litoral
O&M Risk Interest Cost Risk Capex Risk Payments Risk NPV Payments