Universidade de Lisboa
Faculdade de Ciências
Departamento de Física
Novel Approaches to Cardiac Magnetic
Resonance Postprocessing:
Pressure gradients across aortic coarctation and flow kinetic
energy within the ventricles
João Filipe Cardoso Pires Timóteo Fernandes
Dissertação
Mestrado Integrado tem Engenheira Biomédica e Biofísica
Perfil de Sinais e Imagens Médicas
Universidade de Lisboa
Faculdade de Ciências
Departamento de Física
Novel Approaches to Cardiac Magnetic
Resonance Postprocessing:
Pressure gradients across aortic coarctation and flow kinetic
energy within the ventricles
João Filipe Cardoso Pires Timóteo Fernandes
Dissertação
Mestrado Integrado em Engenheira Biomédica e Biofísica
Perfil de Sinais e Imagens Médicas
Supervisor FCUL: Prof. Rita Nunes
Orientador DHZB: Prof. Dr. Titus Kühne
"I find that the harder I work, the more luck I seem to have."
The blood flow physiology is one of the less understood cardiovascular areas, due to limited resources available in the past. Nowadays, new cardiovascular imaging techniques, such as 4D phases contrast (PC-MRI) Cardiovascular Magnetic Resonance (CMR) are emerging, increasing the quality of flow visualization and quantification.
Two of the less explored quantification parameters are the basis of this Master thesis project: Pressure differences across an aortic stenosis and visualization and quantification of the blood flow kinetic energy (KE) within the moving ventricles. To achieve this goal two postprocessing softwares were refined and applied.
To study the pressure gradient across an aortic stenosis, thirteen patients were scanned CMR prior to catheterization. Relative pressure fields were computed from PC-MRI by solving the Pressure Poisson equation. Vessel pressure field map was obtained from each voxel differences to a defined reference location with known absolute pressure (from catheterization and from non-invasive arm pressure measurements). The agreement between these techniques was determined at five measurement sites along the aorta.
To calculate and visualize the KE per time step an algorithm combined the PC-MRI flow data with a moving ventricle mask. Then the ventricle KE was plotted over the cardiac cycle. The KE was calculated within left ventricles (LV) with mitral regurgitation (MR), right ventricles (RV) with pulmonary regurgitation (PR) and healthy LV and RV. The respective curves and maps were compared. The kinetic energy study presents here the first results of a future larger project.
The pressure gradient study results show that in a clinical setting of aortic coarctation, pressure fields can accurately be computed from PC-MRI. The KE study shows that, in regurgitations cases, KE tends to be higher than in healthy ventricles.
This multi study project exemplifies how the use post-processing techniques can maximise the amount of information obtained non-invasively from the CMR.
Key Words: Blood flow, four-dimensional phase contrast MRI, Pressure Gradient,
A forma como o sangue flui dentro do corpo humano tem sido desde há muito tempo um assunto de interesse para a comunidade médico-científica. No entanto, devido aos recursos limitados é também um dos aspectos fisiológicos menos entendidos ao nível cardiovascular. Na actualidade, a introdução de novas técnicas de imagiologia, como a ultra-sonografia de Doppler ou a ressonância magnética de contraste de fase em tempo real (4D PC-MRI), tem permitido uma evolução significativa na aquisição, traduzida num muito maior nível de detalhe na sua visualização e quantificação. Esta evolução é suportada por um crescente número de investigações com maior profundidade ao nível do fluxo sanguíneo. Actualmente, com o cálculo da Angiografia Cardiovascular por Ressonância Magnética (PC-MRA) calculado a partir da imagem de PC-MRI adquirida, já é possível medir o fluxo do sangue e velocidade com resultados muito aceitáveis.
No entanto, ainda existem alguns parâmetros menos explorados ao nível do fluxo sanguíneo. Dois destes parâmetros formam a base desta dissertação de mestrado: o cálculo do gradiente de pressão no caso de uma estenose na artéria aorta; a visualização e quantificação da energia cinética, ao longo do ciclo cardíaco, do fluxo sanguíneo no interior de ventrículos saudáveis e com patologias. Dado que que estes parâmetros ainda não estão muito estudados e que para a obtenção destas medidas é necessário o uso programas de processamento de imagens de ressonância magnética cardiovascular (CMR), o primeiro grande objectivo deste projecto foi estabelecer colaborações com programadores destes programas e ajudar a aperfeiçoá-los. Tal passo tinha por objectivo a familiarização e principalmente o desenvolvimento dos programas por forma a ser possível executar as medições pretendidas, identificando e solucionando problemas devidos a processos físicos relacionados com a aquisição, erros de implementação do programa ou no tratamento das imagens. Após os programas serem melhorados, prosseguiu-se para os objectivos principais deste projecto.
O estudo do gradiente de pressão através de uma estenose na aorta apresentava como aliciante o facto de comparar esta técnica totalmente não invasiva com a técnica que é prática corrente em ambiente clinico: o cateterismo cardíaco, técnica invasiva de diagnóstico e tratamento. Ora, está estabelecido que apenas se efectua a colocação de um stent (através de cateterização) numa estenose aórtica quando o gradiente de pressão através da estenose é superior a 20mmHg. Assim sendo, muitas vezes é usada a cateterização apenas com fim de diagnosticar, pois nem sempre o gradiente é superior ao requerido clinicamente para indicação de cirurgia. Assim sendo este estudo tem como objectivo comparar os valores de pressão obtidos de forma invasiva, com os calculados com base nas imagens PC-MRA, resolvendo a equação de pressão de Poisson.
Treze pacientes (na faixa etária de 13 a 52 anos, n = 7 masculino, n = 6 do sexo feminino) com estenose na aorta foram estudados por CMR antes de se submeterem a um cateterismo cardíaco. Campos de pressão relativos foram calculados a partir da imagem de PC-MRI. Um campo de pressão absoluta ao longo de todo a aorta segmentada foi obtido pela adição da pressão relativa de cada voxel a um valor absoluto conhecido numa região predefinida da aorta. O valor absoluto foi obtido quer por cateterização (pressões dinâmicas) quer por métodos CMR baseados em medições de pressão no braço direito (pressões estáticas) equivalentes às da aorta ascendente. Seguidamente foram comparados as pressões resultantes destes dois métodos
em cinco locais de medição ao longo da aorta. Para melhor interpretação dos resultados foi feita uma análise estatística.
Em todos os 5 locais de medição estudados, os coeficientes de correlação entre as medidas variaram entre 0,86 e 0,97. O Teste de Bland-Altman demostrou boa concordância entre os gradientes de pressão de pico sistólica através da coarctação. As diferenças entre os métodos não foram significativas ( p > 0,2 ). Assim sendo, pode-se concluir com este estudo que em situações clinicas, campos de pressão podem ser calculados de forma precisa a partir de velocidades de fluxo derivados 4D- VEC - MRI. Esta técnica não-invasiva pode assim evoluir para uma alternativa ao diagnóstico com recurso à cateterização invasiva.
Uma vez que num estudo anterior (Carlsson et al.) foi estudada a evolução da energia cinética no interior de ventrículos saudáveis ao longo de um ciclo cardíaco, este estudo tem como objectivo primário desenvolver um procedimento cujos resultados sejam coerentes com os de Carlsson et al.. Em seguida, pretende também oferecer uma primeira comparação visual e quantitativa entre as energias cinéticas ventriculares de voluntários saudáveis versus pacientes com regurgitação numa válvula cardíaca (válvula mitral no caso de se considerar o ventrículo esquerdo antes e após intervenção, e válvula pulmonar no caso de se considerar o ventrículo direito antes de intervenção).
A segmentação 3D semiautomática do lúmen ventricular foi feita para cada intervalo temporal do ciclo cardíaco. Desta resultou uma máscara do respectivo ventrículo em movimento durante um ciclo cardíaco. Simultaneamente foi calculado o PC-MRA contendo a informação das velocidades do fluxo sanguíneo. Para calcular e visualizar a energia cinética per cada intervalo temporal foi desenvolvido um módulo num software de programação cujo algoritmo combina os dados de fluxo de PC-RM com uma máscara de ventrículo em movimento. Foram então comparados os gráficos e figuras obtidos entre ventrículos saudáveis e ventrículos com regurgitação valvular (quer para o ventrículo direito quer para o ventrículo esquerdo).
Estes são os primeiros resultados obtidos pelo estudo da energia cinética ventricular, dado que este projecto ainda se encontra em desenvolvimento. Ainda assim pode-se comprovar que os resultados obtidos segundo esta metodologia são coerentes com os obtidos por Carlsson et al. (ao nível dos ventrículos saudáveis). Pode-se também comprovar que ventrículos com maior volume são mais propensos a apresentar relativamente maior energia cinética. Observou-se também que a energia cinética tende a ser mais elevada em locais em que existe mais turbulência e caminhos de fluxo de sangue não lineares como as válvulas cardíacas.
Em conclusão, estas técnicas emergentes de análise de imagens cardiovasculares potenciam uma melhor compreensão do sistema cardiovascular. No futuro poderão permitir um melhor diagnóstico assim como um planeamento terapêutico personalizado de patologias cardiovasculares. Isto iria aumentar a taxa de sucesso e, por conseguinte, reduzir a principal causa patológica de mortes entre a população humana.
De notar ainda que o estudo dos gradientes de pressão através da aorta resultou já num artigo que aguarda neste momento aprovação.
Palavras-chave: fluxo sanguíneo, Ressonância magnética de contraste de fase,
Firstly I would like to thank my parents for meeting and getting alone with each other, and for giving life and education in every sense of both words to two amazing boys, specially the second one, Tiago, with who I learn to share almost everything, from ultimate challenges to a fantastic country full of smiles and special characters like Panduca, both Poohs, Dumbeca and Ibérico.
Next I would like to congratulate my 4 grandparents for connecting themselves and valorize so much the wealthy live they have. They are really an example of strength to me.
After causing so much scary moments to them, it is very important to me, to feel the faith and the believe that my godparents as well as my full (31 member) family have on me.
I have also to apologize to Gancho, Hugo, Íris and all my friends for the “not that often” lack of communication. There is a big thanks you to be given also to Ji Yiyi, Tiago Silva and João Periquito for surviving in the same house as me during 9 months. And also a special thanks for speechless support of Dworaczyk family during the weekends.
Next, I would like to refer the importance of Prof. Eduardo Ducla Soares, Prof. Alexandre Andrade, Prof. Pedro Cavaleiro Miranda and all the Institue of Biofisics and Biomedical Engeneering (IBEB) team (Prof. Pedro Almeida, Prof. Hugo Ferreira, Prof. Nuno Matela, Prof. Pedro Salvador e Prof. Rita Nunes) for building up such a reference course with a complete works plan that allows the students to learn, practice, develop self-working methods and have 2 internships that, at my view, are fundamental for introducing students to the real work developed on Biomedical field.
A very special thanks to Prof. Ritas Nunes, who besides accepting to be my coordinator, was very patient and supportive to me and to my work.
But none of this Master thesis would be possible if it was not the receptivity and vision of Prof. Dr. Titus Kühne. His friendly Boss approach always questioning my methods was from outmost importance to the evolution of the work as well was my own evolution within research area. Actually, all the Deustche Herzzentrum Berlin (DHZB) MRT team was very welcome and ready to hear my problems and help me, and therefore I am now in big debt to Dr. Nadya Al-Wakeel, Alireza Khasheei, Dr. Davide Santoro, Dr. Eugene Riesenkampff, Dr. Dhafer Al Qahtani and Lili, and to them and their families I wish everything good. Also big thanks are due to those who collaborated with our team, the MevisFlow and CAIPI teams and Leonid Goubergrits.
Note also the founding importance of ERASMUS internship projects, DHZB and specially my family for the financial support.
At last, but most importantly I would like to say “dzienkuje bardzo” to Karolina, for being sited next to me while I am writing my master thesis dissertation and mainly for offering me the best thing one can offer: LOVE!
ABSTRACT 5 RESUMO 6 ACKNOWLEDGEMENTS 8 CONTENTS 9 ACRONYM LIST 11 FIGURE LIST 12 TABLE LIST 15 MOTIVATION 16 THESIS OUTLINE 17 1 GENERAL CONCEPTS 18
1.1 ANATOMY AND PHYSIOLOGY 18
1.1.1 Heart 18
1.1.2 Aorta 19
1.2 BLOOD FLOW DIAGNOSIS AND QUANTIFICATION 20
1.2.1 Cardiac Catheterization 20 1.2.2 Angiography 22 1.2.3 CT 22 1.2.4 PET 22 1.2.5 Echocardiography 23 1.2.6 Hybrid imaging 24
1.3 CARDIOVASCULAR MAGNETIC RESONANCE IMAGING 25
1.3.1 Acquisition 28
1.3.2 Pre-processing and PC-MRA calculation 29
1.3.3 Data analysis 29
1.4 BLOOD FLOW IMAGING STATE OF THE ART 30
2 OBJECTIVES 32
2.1 SOFTWARE REFINEMENT 32
2.2 PRESSURE GRADIENT ACROSS AN AORTIC COARCTATION 32
2.3 KINETIC ENERGY WITHIN THE VENTRICLES 33
2.4 OTHER OBJECTIVES 33
3 WORK’S PLANNING 34
4.1 CMRSCANNER 37
4.2 POSTPROCESSING SOFTWARES 38
4.2.1 MevisFlow 38
4.2.2 CAIPI 42
4.2.3 MevisLab 43
5 PRESSURE GRADIENT ACROSS AN COA STUDY 44
5.1 METHODOLOGY 44
5.1.1 Statistical analysis 47
5.2 RESULTS 49
5.3 DISCUSSION 52
5.3.1 Limitations 55
6 KINETIC ENERGY WITHIN THE VENTRICLES STUDY 56
6.1 METHODOLOGY 56
6.2 RESULTS 59
6.3 DISCUSSION 65
7 CONCLUSION 69
2D ... two-dimensional 3CHle... 3 chambers view left anatomical image 3CHri ... 3 chambers view right anatomical image 3D ... three-dimensional 4D ... four-dimensional BSA ... Body Surface Area CoA ... Coarctation of the aorta CMR ... Cardiovascular Magnetic Resonance CT ...Computed tomography CTA ... Computed tomographic angiography CVD... Cardiovascular Diseases CVI ... Cardiovascular Imaging EDV ... end-Diastolic Volume EF ... Ejection Fraction ESV ... end-Systolic Volume FOV ... Field of View HR ... Heart Rate KE ... Kinetic Energy LV ... Left Ventricle MR ... Mitral Regurgitation MIP ... Maximum Intensity Projection images MRI ... Magnetic Resonance Imaging PC-MRA ... Phase Contrast Magnetic Ressonance Angiography PC-MRI ... Phase Contrast Magnetic Ressonance Imaging PR ... Pulmonary Regurgitation ROI ... Region of Interest RV ... Right Ventricle RVOT ... Right Ventricle Outflow Tract view plane SAX ... Short Axis view plane SNR ... Signal-to-noise ratio SV ... Stroke Volume
Figure 1.1 Frontal heart diagram with anatomy major landmarks and venous (blue) and arterial (red) blood flow directions through the atria, ventricles, and associated vessels.[3] ... 18
Figure 1.2 Heart ventricles cross-sectional view diagrams showing the dilated (ventricular diastole) and contracted (systolic) ventricle myocardium.[3] ... 19
Figure 1.3 Schematic frontal view of aorta artery within the human body divided in the 4 major portions: ascending thoracic aorta, aortic arch, descending thoracic aorta and abdominal aorta. In the figure are also present the associated arteries.[2] ... 19
Figure 1.4 A: Catheterization of the right side hearth cavities or pulmonary artery. The catheter is inserted into the femoral vein and advanced through the inferior vena cava, or, in antecubital or basilic vein, through the superior vena cava. B: Catheterization of the left side hearth cavities or aortic artery. The catheter is inserted into the femoral artery or the antecubital artery and advanced through the aortic different portions.[4] ... 21
Figure 1.5 Colour Doppler echocardiogram in parasternal long axis view showing mitral regurgitation (MR jet), the heart cavities: left ventricle (LV), left atrium (LA), right ventricle (RV) and aorta artery (Ao).[1] 23
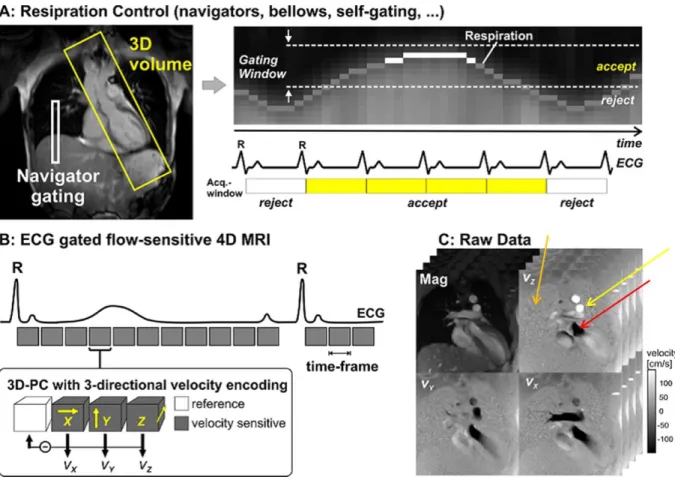
Figure 1.6 A: Data acquisition for 3D cine velocity acquisition using navigator gating for respiration control. The navigator gating control is placed above the lung and establishes a gating window for image acquisition. Therefore not all the heart beats are considered when acquiring PC-MRI images. B: Schematic illustration of ECG–gated three-directional phase-contrast MR (3D-PC) sequence used to measure blood flow. Velocity encoding was performed using four modules: a reference module and one for each of the 3 different velocity directions Vx, Vy and Vz) per time frame, also known as time step, (1 time frame establishes the PC-MRI time resolution). X, Y, and Z are the three (slice-select, phase-encode, and frequency-encode) gradient axes used. C: Raw data per slice and per time frame obtained from the four velocity vector extraction (One Magnitude image and different velocity components Vx, Vy and Vz velocity images). In this image it is possible to verify that stationary protons appear grey (orange arrow), flow in one direction appears white (yellow arrow), and flow in the opposite direction appears black (red arrow)[6] ... 26
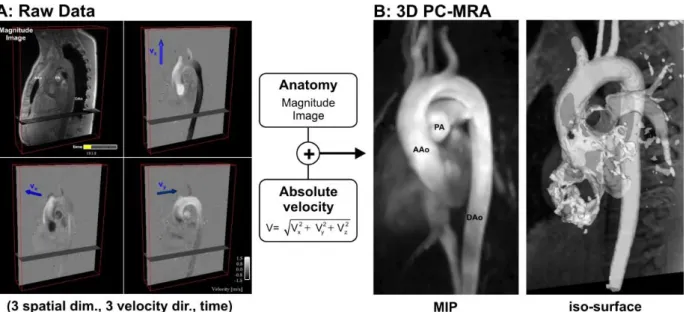
Figure 1.7 Image processing for obtaining a 3D PC-MRA of a healthy thoracic aorta. A PC-MRA image is obtained by calculating (voxel by voxel) the absolute velocity resulting from the combination of the 3 different acquired velocity components, with image masking based on the magnitude image. A: RAW data acquired from a PC-MRI with magnitude provided as reference and the 3 different velocity components Vx, Vy and Vz). B: The resulting PC-MRA images can be displayed as a maximum intensity projection (MIP) or as a semi-transparent 3D iso-surface which can be combined with 3D flow visualization.[6] ... 28
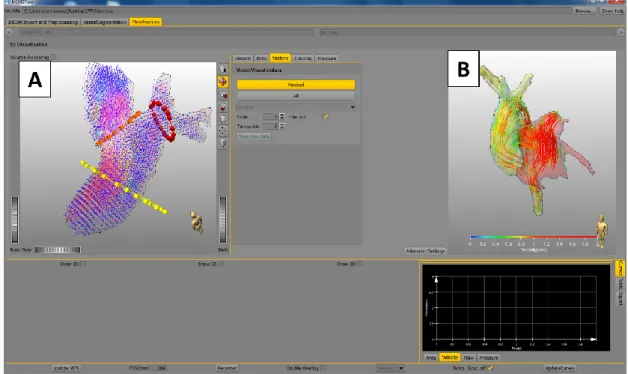
Figure 4.1 Pre-Processing menu, that allows a 4D phase-offset error correction to be made using third-order polynomials (Eddy current correction) as well as a phase unwrapping (still under development). The PC-MRA is also calculated here. ... 38 Figure 4.2 Flow analysis menu, where it is possible to draw and select the ROIs, visualize and export vector fields (A), tracking particle flow or pathlines (B), visualise the connectivity map, compute and visualize the blood flow pressure, and see and export the temporal evolution of the vessel cross-sectional Area, velocity, blood flow and pressure for a single cardiac cycle. ... 39
Figure 4.3 Vessel segmentation menu where it is possible to segment semi-automatically (based on markers and filters) several cardiovascular structures for the same image set. ... 39
Figure 4.4 After the application of the phase unwrapping algorithm, the phase wrap had not been fully corrected. ... 40
Figure 4.5 An ROI should always be kept in the same plane in which it was drawn. In this and some other cases the contour becomes 3dimentional and as a consequence it is impossible to have information (see graphic above) for a 2D contour in the time steps. ... 40
Figure 4.6 The particles emitted went outside the segmented vessel, which can happen because of a bad image acquisition or a bug in the software. ... 41
Figure 4.7 When region coloration is used for the pathlines, the colour of the pathlines should be the same as the ROI from which they are originated. In this and some other cases the streamline is either all green or has different colours (similar to what would be obtained if the ID coloration had been used for the pathlines). ... 41 Figure 4.8 Moving ventricle masks of healthy volunteers obtained with the CAIPI segmentation tool. A: LV mask of end-diastole (highest blood volume) time step B: LV mask of end-systole (lowest blood volume) time step. The A and B masks were obtained from the same patient and exemplify the moving LV masks set; C: RV mask of end-diastole (highest blood volume) time step D: RV mask of end-systole (lowest blood volume) time step. The C and D masks were obtained from the same patient and exemplify the moving RV masks set. All the masks sets have 25 different masks correspondent to the 25 time steps over a cardiac cycle. ... 42
Figure 4.9 Example of valve planes clip on a healthy LV segmentation. The 2 valve planes determined by the user (yellow regions) correspond to the mitral valve (1) and to the aortic valve (2). A: Short axis view of the LV basis, where it is possible to visualize both chosen clip planes. B: Longitudinal view of the LV, where is also possible to visualize the valve clip planes chosen. ... 43
Figure 5.1 A: MR angiography of the aorta in one representative patient. The six locations for pressure measurements are shown. B to F: CMR derived 4D colour coded pressure fields calibrated with catheter, from beginning of systole to end-diastole (B: early systole, C: peak systole, D: early diastole, E: mid diastole, F: end diastole). The shown data belong to a 46 year old female patient with re-coarctation. The peak-systolic pressure gradient across the stenosis was 19 mmHg measured by catheter and 21 mmHg measured by CMR. ... 45
Figure 5.2 Pressure profiles of the ascending and descending aorta measured by catheterization and by CMR pressure field method with catheter calibration. The pressure profiles were obtained from a 13 year old female patient with re-coarctation in the aortic arch. The pressure profiles of the ascending aorta and the descending aorta were measured in position 2 and 6 as indicated in Figure 1, panel A. Note the timing difference in peak-systolic pressures between ascending and descending aorta (arrows) ... 47
Figure 5.3 Bland-Altman plot for end-diastolic pressures measured by catheterization and CMR pressure fields in n=13 patients at different measurement locations in the ascending and descending aorta. .... 50
Figure 5.4 Bland-Altman plot for peak-systolic pressures measured by catheterization and CMR pressure fields in n=13 patients at different measurement locations in the ascending and descending aorta. .... 50
Figure 5.5 Bland-Altman plot for peak-systolic pressure gradients measured by catheterization and CMR pressure fields between two different locations in the ascending and descending aorta (location 1 and 6,
Figure 5.6 Bland-Altman plot for peak-systolic pressure gradient measured by catheterization and CMR pressure fields between two different locations in the ascending and descending aorta (location 1 and 6, Figure 1, panel A). Calibration was done with static pressures (see methods section for details). ... 51
Figure 6.1 (A) MevisLab module for KE visualization and calculation. This module was developed in this project and is divided in 3 minor steps: The first (1) consists on applying the segmented mask to the PC-MRA image in the respective time step. In the second (2) the number of voxel within the mask is calculated as well as the total volume of the mask. In the third step (3) the KE is calculated voxel by voxel together with the total KE per time step. The module outputs are the 2D colour gradient KE image (B) and the total KE and blood flow volume (C) of the masked cardiovascular structure. ... 58
Figure 6.2 A: Blood flow kinetic energy (KE) curves (in mJ) over the cardiac cycle (time normalized) within a healthy subject left ventricle (LV) obtained by Carlsson et al.in a 1.5 and a 3 Tesla CMR scanners.[5] All the remaining curves (B to D) compare a healthy subject and a patient with mitral insufficiency before and after an intervention to the respective valve. B: KE curves (in mJ) over the cardiac cycle (time normalized); C: Volume curves (in mL) over the cardiac cycle (time normalized); D: Volume normalized KE curves over the cardiac cycle (time normalized). These are the first results obtained from the presented methodology applied to LV. These are also the first ever results considering KE within a diseased LV. ... 59
Figure 6.3 Peak left ventricle (LV) systole (moment in which more blood is being ejected from the ventricle) images of 3D blood flow tracing with velocity colour scale (up) and 2D kinetic energy (KE) colour gradient in the long axis longitudinal view (down). The blood flow tracing images include a static segmentation of the LV, left atrium (LA) and aorta artery (Ao), whereas the KE include only the LV. The images on the left (A and D) were obtained from a healthy subject. The middle images (B and E) were obtained from a patient with mitral valve insufficiency before intervention. The images on the right (C and F) were also from the same patient, but after intervention. (AL: left-anterior direction according the anatomical position, HR: right-head direction according to the anatomical position of descending aorta) ... 60
Figure 6.4 Peak left ventricle (LV) diastole (moment in which less blood is being ejected from the ventricle) images of 3D blood flow tracing with velocity colour scale (up) and 2D kinetic energy (KE) colour gradient in the long axis longitudinal view (down). The blood flow tracing images include a static segmentation of the LV, left atrium (LA) and aorta artery (Ao), whereas the KE include only the LV. The left images (A and D) were obtained from a healthy subject. The middle images (B and E) were obtained from a patient with mitral valve insufficiency before intervention. The right images (C and F) were also from the same patient, but after intervention. (AL: left-anterior direction according the anatomical position, HR: right-head direction according the anatomical position descending aorta) ... 61
Figure 6.5 Peak right ventricle (RV) systole (moment in which more blood is being ejected from the ventricle) images of 3D blood flow tracing with velocity colour scale (up) and 2D kinetic energy (KE) colour gradient in the long axis longitudinal view (down). The blood flow tracing images include a static segmentation of the RV, right atrium (RA) and pulmonary artery (PA), whereas the KE include only the RV. The left images (A and C) were obtained from a healthy subject. The right images (B and D) were obtained from a patient with pulmonary valve insufficiency before intervention. (An: anterior direction according to the anatomical position, H: head direction according to the anatomical position descending aorta) ... 62
Figure 6.6 Peak right ventricle (RV) diastole (moment in which more blood is entering in the ventricle) images of 3D blood flow tracing with velocity colour scale (up) and 2D kinetic energy (KE) colour gradient in
the long axis longitudinal view (down). The blood flow tracing images include a static segmentation of the RV, right atrium (RA) and pulmonary artery (PA), whereas the KE include only the RV. The left images (A and C) were obtained from a healthy subject. The right images (B and D) were obtained from a patient with pulmonary valve insufficiency before intervention. (An: anterior direction according to the anatomical position, H: head direction according to the anatomical position descending aorta) ... 63
Figure 6.7 A: Blood flow kinetic energy (KE) curves (in mJ) over the cardiac cycle (time normalized) within a healthy subject right ventricle (RV) obtained by Carlsson et al. in a 1.5 and a 3 Tesla CMR scanner. (Carlsson et al). All the remaining curves (B to D) compare a healthy subject and a patient with pulmonary insufficiency before intervention to the respective valve. B: KE curves (in mJ) over the cardiac cycle (time normalized); C: Volume curves (in mL) over the cardiac cycle (time normalized); D: Volume normalized KE curves over the cardiac cycle (time normalized). These are the first results obtained from the presented methodology applied to RV. These are also the first ever results considering KE within a diseased RV. ... 64
Table 3.1 Work plan of the project by expectable dates and tasks. ... 35 Table 5.1 Patient characteristics and pressure gradients, * Blood pressure was measured on the right upper arm with the Riva-Rocchi (RR) method, † Gradients were measured between peak-systolic pressure values at locations 2 and 6 (Figure 5.1A), (CoA: Coarctation; Re-CoA: Re-Coarctaction) ... 49
Nowadays cardiovascular diseases are the most death causing diseases in the world, killing more than 17 million of people per year.[7] These are concerning numbers that justify the importance of studying and understanding every single detail of the cardiovascular function as well as its relation with external factors that can potentially lead to Cardiovascular Diseases (CVD). Actually this is the reason why so many grants are given and so many studies are performed worldwide about the heart, vessels and cardiovascular pathologies. This is also why there are researchers from as different backgrounds as Medicine, Biomedical Engineering, Informatics, Mathematics among others, working together to minimize this big global issue.
This work presents two studies that demonstrate new techniques or measurements such as the non-invasive calculation of the aortic pressure gradient across a coarctation and the measurement of blood flow kinetic energy (KE) with the ventricles.
The first study tries to offer an alternative for diagnostic catheterization. The pressure gradient clinically accepted in order to proceed to a stent placement intervention with catheter when the aortic coarctation is 20mmHg.[8, 9] So, many times an aortic coarctation is detected and diagnosed invasively by catheterization, but when the gradient is lower than 20mmHg no intervention is made. This means that an invasive procedure is conducted, with the inherent risks of infection, further cardiovascular issues and in a few cases even death.[10] The approach presented here aims to introduce a totally non-invasive diagnosis procedure based on CMR imaging as alternative to diagnosis by catheter.
There is relatively little knowledge concerning the blood flow behaviour inside a ventricle since it is very difficult to trace, predict or even measure the blood flow inside the biggest and constantly moving cavities of the cardiovascular system(the ventricles).[11] Therefore the second study included in this dissertation introduces a new measurement of ventricular function: blood flow KE. This measurement aims to provide a better understanding of the blood flow behaviour within healthy and non-healthy ventricles, and it is possible that in the future it may be included in CMR imaging exams to help diagnosing heart diseases for a and potentially help plan personalized treatments.
This dissertation is structured in 7 main chapters.
Chapter 1 presents the general concepts, introducing the anatomy and physiology of the heart and aorta artery, respectively the organ and vessel of the cardiovascular system that will be the basis of these dissertation studies. Following this section, a summary of the presently available techniques that can be used for blood flow analysis will be presented: Cardiac Catheterization, Angiography, Computer tomography (CT), Positron emission tomography (PET), Echocardiography and Hybrid imaging and finally cardiovascular magnetic resonance (CMR). CMR is presented in its own subchapter since it is the imaging technique that is the basis of this project. In the CMR subchapter, the basic concepts of image acquisition, pre-processing and data analysis are presented. Finally the current state of the art of blood flow imaging will be presented.
In Chapter 2 the objectives of this master thesis project are presented. Due to the new approaches used, the first objective was to make a refinement of the softwares used to obtain the intended measurements. The objectives of both studies (Pressure gradient across an aortic stenosis and KE within the ventricles) are then presented. The last subchapter of the objectives chapter presents a list of other small objectives also aimed by this work.
In Chapter 3 a table is presented detailing the project planning with the developed tasks and respective dates. In this chapter the collaborations established during the project development are also mentioned.
In Chapter 4 a small presentation of the material used during the project research is made. Firstly the characteristics of the CMR scanner used are presented. Secondly a small description of the postprocessing softwares (MevisFlow, CAIPI and MevisLab all developed by MeVis Medical Solutions AG and Fraunhofer MEVIS in Bremen, Germany) is presented, including s the main tools that were used.
In Chapter 5 the “Pressure gradient across an aortic coarctation” study is presented, divided in methodology, results and discussion.
In Chapter 6 the “Kinetic energy within the ventricles” study is described. In the methodology section of the kinetic energy study the procedure used to visualize and obtain a curve of the flow within a patient’s ventricle during a single heartbeat is presented. Here only the first results and a preliminary interpretation will be presented as this study is still under development.
1.1 Anatomy and physiology
1.1.1 Heart
The heart is the main organ of the circulatory system, since it is the one that pumps the blood through the whole organism, and thus providing all body cells with oxygen and nutrients. The Heart is a muscular organ with an approximately conical form located in the middle of the chest between the lungs.[12]
In healthy individuals the blood has to pass through the heart twice per each cardiac cycle. Anatomically, the heart is divided in two sides (left and right) and each side has two cavities: the atrium, a thin-walled and relatively small cavity where the blood enters the heart, and the ventricle, a cavity bigger and thicker than the atrium, and located just below it. The right side of the heart is responsible for transporting blood poor in oxygen and rich in carbon dioxide (CO2) from the body to the lungs (where gas exchanges that allow the
increase in O2 concentration and decrease in the CO2 concentration occur). The left side of the heart is responsible for receiving the already oxygenated blood and pumping it into the other parts of the body (Figure 1.1). The one-way flow of blood through the heart chambers on both sides of the heart valves is managed by the tricuspid and bicuspid semilunar valves. Note also that each time the heart beats (in an average adult) about 80mL of blood is expelled.[13]
Since the function of the atria collects blood and conveys it to ventricles in the same way on both sides, there is no big structural difference between them apart from the number of veins leading to them. The ventricles are, however, very different given the very significant structural differences. Since the lungs are close to the heart, the pulmonary blood vessels are relatively short andthere is not that much ventricular work needed to pump the blood through the whole Figure 1.1 Frontal heart diagram with anatomy major landmarks and venous (blue) and arterial (red) blood flow directions through the atria, ventricles, and associated vessels.[3]
body. It is therefore natural that the LV has an extremely thick muscular wall and is round in cross section whereas the RV have a thinner muscular wall (see Figure 1.2).[3]
The anatomy of the wall also influences the contraction of the ventricles. Most RV contraction occurs along its long axis from base to apex, particularly in the outer wall (free wall), with a smaller component from radial contraction of LV. This is in contrast to the systolic emptying of the LV, which involves significant radial contraction. This makes the blood flow differently in LV than in RV concerning paths, velocities or pressures within the ventricles.[11]
1.1.2 Aorta
The aorta is an elastic artery that carries the stroke volume of blood that goes out of the LV in each heart beat and for that, a healthy aorta can have diameters up to 2.5 cm (see Figure 1.3). Since it contains a high density of elastic fibbers, and relatively few smooth muscle cells the aorta can tolerate the pressure changes characteristic of the cardiac cycle. During LV systole, pressures rise rapidly and aorta expands. When the pressure drops in LV diastole, the elastic fibbers recoil to their original dimensions. Their recoil slows the pressure drops in the adjacent smaller vessels during LV diastole. Therefore, aorta helps to make blood flow. This function is important since the blood pressure has a direct effect on the blood flow behaviour: The greater the pressure oscillations, the greater
Figure 1.2 Heart ventricles cross-sectional view diagrams showing the dilated (ventricular diastole) and contracted (systolic) ventricle myocardium.[3]
Figure 1.3 Schematic frontal view of aorta artery within the human body divided in the 4 major portions: ascending thoracic aorta, aortic arch, descending thoracic aorta and abdominal aorta. In the figure are also present the associated arteries.[2]
the changes in blood flow. As a consequence, the wall characteristics of the elastic arteries are the main reason for the absence of pressure oscillations when the blood reaches the arterioles in healthy subjects.
Therefore, an aorta with some condition can raise significant cardiovascular issues. One of the most common diseases in the aorta is the Coarctation of the aorta (CoA) accounting for 5-8% of all congenital heart defects.[8] Surgical or interventional treatment of CoA is associated with low morbidity. However, Re-CoA occurs frequently and is often associated with persistent arterial hypertension and shows increased morbidity at long-term.[14]
Current treatment strategies are focussing on the elimination of pressure gradients across the site of CoA. According to clinical guidelines intervention is recommended, amongst others, at a systolic gradient of > 20 mmHg measured by catheterization in children[15] or, in adults, by catheterization or non-invasively.[8, 9]
1.2 Blood flow Diagnosis and Quantification
Both Cardiac catheterization and Cardiovascular Imaging (CVI) enclose panoply of modalities which can be chosen according to exam time, health-risk factors, price of the exam, and, essentially, the objective of the study or diagnosis. A complete description of all these modalities would need an extended report, and so here only a brief introduction is made covering their basic concepts as well as their applicability to evaluate or not blood flow and pressure.
1.2.1 Cardiac Catheterization
Cardiac catheterization is mainly a diagnostic technique which does a comprehensive intravascular examination of the function of the heart. One or more catheters are inserted into the cardiovascular system through a peripheral blood vessel either in the arm (antecubital artery or vein) or leg (femoral artery or vein) under x-ray guidance (Figure 1.4). The catheterization can be used to measure several blood functional and structural parameters as blood pressures [16], cardiac output [17] or myocardial metabolism [18] as well was be used as intravascular CVI as catheter angiography [19, 20], intravascular ultrasonography.[21]
Catheterization can also have a treatment use besides the diagnostic one. Good example of that are the heart valves replacements or the stent placement in a coarctation in elastic arteries. The combined catheterization for pressure measurements and stent implantation has been widely used in the management of both native and recurrent coarctation of the aorta in adolescents and adults, reducing the number of cardiovascular surgery. This procedure has a high success rate (around 90%).[22] However, since this is an invasive procedure, complications like femoral access vessel related, aneurysm formation, aortic dissection, and cerebrovascular accident can occur that in rare cases can even be fatal (0.3%).[16] Also the stent placement or cardiovascular surgery is only made when there is reduction of the gradient to less than 20 mmHg.[16] Thus, there are cases a catheterization is made but no intervention is needed, which increases the patient risk of further complications.
Nevertheless, given the well-established accuracy of pressure measurements, for medical decision making cardiac catheterization is still considered the clinical gold standard despite its known drawbacks concerning invasiveness, ionizing radiation exposure and costs.5
Figure 1.4 A: Catheterization of the right side hearth cavities or pulmonary artery. The catheter is inserted into the femoral vein and advanced through the inferior vena cava, or, in antecubital or basilic vein, through the superior vena cava. B: Catheterization of the left side hearth cavities or aortic artery. The catheter is inserted into the femoral artery or the antecubital artery and advanced through the aortic different portions.[4]
1.2.2
AngiographyFirst developed in University of Lisbon by Egas Moniz [23], angiography is an exam, traditionally fluoroscopic, where the blood or lymphatic vessels are imaged. This is possible by injecting a radio-opaque contrast media into the vascular system in order to get a higher contrast to X-rays between the vessels and the involving tissues, providing a 2D image of the vascularity intended.[24] It is mainly used for diagnosing a great variety of CVD where there is stenosis or enlargement of the vessels. Since it is relatively expensive and has inherent risks due to the ionizing radiation used in this modality, its use is decided according to a normative that evaluates its cost/benefit patterns.[25]
Nowadays, less invasive angiography techniques are being researched and developed for vascular imaging, such as Computed Tomographic Angiography (CTA), or Catheter Arteriography. For instance, there are already studies supporting the possibility of getting some information from blood flow velocity using CTA [26, 27], or stress myocardial perfusion.[28]
1.2.3 CT
Multi-slice cardiac computed tomography (CT) is a rapidly advancing technology that is being used for imaging the cardiovascular structures such as the heart and the vessels. Due to its inherently high spatial resolution (enabling isotropic data acquisition), fast scan speed, and tissue contrast (that can be increased by using a contrast agent), Multi-slice CT has been used in diagnosing and treatment planning of CVD. For example, it is used in the evaluation of the complete coronary vascularity or, more specifically, the aortic valve structure. As this is mostly an anatomical analysis method, there is currently no known research in CT technology specifically focusing on calculating the blood flow velocity. However there are studies that calculate a mean of the blood flow velocity by using contrast agents to reach other goals such as the xenon solubility coefficient in the human liver or regional cerebral blood flow differences in other to evaluate the risk of Alzheimer's disease.[29]
1.2.4 PET
Cardiac Positron Emission Tomography (PET) is also increasingly being applied clinically, mainly through myocardial perfusion imaging which evaluates heart muscle function over time as well as the way blood is flowing into the myocardium.[30] Compared with CT, PET offers lower radiation exposure, fewer artefacts, improved spatial resolution, a great variety of available radioisotopes, and, mainly, an improved diagnostic performance. However, the cost of
the machinery and the exams are a big issue and additional studies are necessary to further validate cost-effectiveness and also the real relative diagnosing impact of PET.[31]
It is important to notice that all of these first 3 modalities (fluoroscopic angiography, CT or PET) involve the exposure to ionizing radiation, and therefore they all present health risks.[32-34]
1.2.5 Echocardiography
This non-invasive technique is based on ultrasound and echo wave physics, offering an easy and fast assessment of
cardiovascular
components. Since it is harmless and non-invasive, can provide real time images which can focus either or both function or
anatomy of the
cardiovascular components it is the most commonly used cardiovascular modality in general clinical practice. Images can be acquired in 2D, 3D, and even in 4D which are 3D image sets that are
acquired and displayed in real time.[35] For the blood flow analysis, however, the most important aspect of echocardiogram is the 2D colour Doppler imaging (see Figure 1.5). The also named Doppler sonography is an ultrasound imaging modality that is based on the frequency deviation of the ultrasound wave caused by a reflector in motion[36], in the case of Echocardiography, Blood. The most common use of Doppler echocardiography is based on the duplex scanning imaging, which is a combination of the ultrasound images, two-dimensional B-mode, and the images resulting from Doppler that are superimposed on the two-dimensional image of B-mode. This combination allows a very complete picture, since the B-mode two-dimensional image of grey scale allows to distinguishing the different anatomical structures and the images resulting from the Doppler techniques originate from a colour gradient for assessing the blood velocity.[36]
Figure 1.5 Colour Doppler echocardiogram in parasternal long axis view showing mitral regurgitation (MR jet), the heart cavities: left ventricle (LV), left atrium (LA), right ventricle (RV) and aorta artery (Ao).[1]
of various cardiac structures and blood that circulates in them. This enables the diagnosis of a variety of diseases such as congenital defects[37], hypertrophic cardiomyopathy[38], coronary artery disease[39, 40], intracranial occlusive disease intracranial occlusive disease [41] or the determination of systolic and left ventricular diastolic functions [42, 43], among others. However, when applied to measure the severity of a stenosis in the aorta, the Doppler echocardiography tends to overestimate the aortic pressure gradient and measurements are sometimes difficult to obtain due to the posterior position of the aorta, particularly in the adult patient.[8, 44]
1.2.6 Hybrid imaging
Besides the use of individual CVI focusing on a single objective, the potential of using cardiac hybrid imaging has also been studied. Hybrid approaches may in some cases allow a more comprehensive diagnosis of CVD since it becomes possible to combine both morphological and functional information.[45, 46] The goal is to obtain a more accurate and less/non-invasive imaging scan that can be used in diagnosis and/or treatment planning. Applications for blood flow analysis are under research, using hybrid methods such as the fusion of PET and CT[47, 48], PET and MRI [49, 50], either CT or PET with CTA [46, 51], and photoacoustic imaging, a new biomedical imaging modality that combines high-contrast based on spectroscopic optical imaging with the good spatial resolution of ultrasound imaging.[52, 53]
1.3 Cardiovascular Magnetic Resonance Imaging
(CMR) provides a more comprehensive evaluation of cardiac physiology and anatomy than Echocardiography. This is possible due to the combination of well-established characteristics of MRI with available approaches for reducing the difficulties caused by heart and breathing motions. MRI is also very flexible regarding the choice of imaging planes, avoiding problems related to the unpredictable anatomical planes of the heart. CMR actually makes it possible to non-invasively view the heart and cardiovascular tree from practically any angular direction, which does not happen with any other imaging technique.[54] CMR also allows as outputs static or cine images.
Therefore with a CMR scan it is possible to analyse the cardiovascular anatomy, as well as the function of heart cavities and vessels. As a consequence CMR is suited for visualization and diagnosis of a wide range of congenital and acquired cardiovascular problems, such as coronary artery disease, cardiac insufficiency due to inflammation, or valve problems.[55-59] One of the most important features of CMR is to allow visualizing and quantifying blood flow velocity within the heart and vessels in 3D due to phase contrast MRI and over time (4D) due to the combination of phase contrast MR imaging with the ability of cardiac cine imaging to produce images throughout the cardiac cycle.[60] In order to provide final images which are not affected by artefacts related to respiratory chest movement, this motion must be monitored either using navigators, respiratory bellows or self-gating (see Figure 1.6A).[61] From now on in this dissertation, when mentioning phase contrast MRI (PC-MRI) the inclusion of cardiac cine imaging will be assumed. It is important, at this point to introduce the physics behind PC-MRI.
The applications of gradient pulses induce phase shifts in moving protons that are directly proportional to their velocity along the direction of the gradients. For accurate quantification of phase shift due to moving protons, a reference image is acquired separately so that phase shifts induced by other uncontrollable factors, such as magnetic field inhomogeneities, can be subtracted to from the pulse induced images (see Figure 1.6B). Repeating the acquisition for 3 orthogonal directions, it is possible to obtain phase maps which encode velocity (Vx, Vy, Vz), with phase shifts within the range of ±180°. This means that, for each pixel, the measured phase (RAW format) depends on the velocity of the spins. As a result, stationary protons appear grey, spins which flow in the direction of the sensitising gradients appear brighter, and spins which move in the opposite direction appear darker (see arrows in Figure 1.6C). The peak velocity encoding (VENC) value is defined by the user.
Figure 1.6 A: Data acquisition for 3D cine velocity acquisition using navigator gating for respiration control. The navigator gating control is placed above the lung and establishes a gating window for image acquisition. Therefore not all the heart beats are considered when acquiring PC-MRI images. B: Schematic illustration of ECG– gated three-directional phase-contrast MR (3D-PC) sequence used to measure blood flow. Velocity encoding was performed using four modules: a reference module and one for each of the 3 different velocity directions Vx, Vy and Vz) per time frame, also known as time step, (1 time frame establishes the PC-MRI time resolution). X, Y, and Z are the three (slice-select, phase-encode, and frequency-encode) gradient axes used. C: Raw data per slice and per time frame obtained from the four velocity vector extraction (One Magnitude image and different velocity components Vx, Vy and Vz velocity images). In this image it is possible to verify that stationary protons appear grey (orange arrow), flow in one direction appears white (yellow arrow), and flow in the opposite direction appears black (red arrow)[6]
The amplitudes of the flow-sensitizing gradients are calculated so that the peak velocity encoding (VENC) is defined by the user and corresponds to a phase shift of 180°. Given this, the velocity, v, within each voxel can then be determined by the mean of the protons phase difference, ΔΦ, accrued during one time step (temporal resolution), using the formula:
ΔΦ= γ* Δm*v
where γ is the gyromagnetic ratio and Δm denotes the difference of the first moment of the gradient-time curve. The closer the VENC is to the maximum expected velocity (ideal VENC), the more precise is the measurement. Therefore there are clinical guidelines for Venc determination. Some these values are presented next[62]:
Venc setting for normal aorta : 200 cm / s Venc setting for aortic coarctation : 400 cm / s
Venc setting for normal mitral valve : 150 cm / s Venc setting for mitral stenosis : 300 cm / s Venc setting for normal tricuspid : 100 cm / s Venc setting for tricuspid stenosis : 200 cm / s
It is important to notice that if VENC is set too low compared to the maximum blood flow, velocity encoding results in aliasing or phase wrap (also known as wrap-around) as indicated by an inverted signal flow where the intensity signal has a maximum brightness correspondent to phase shifts very close to ±180°.
Another problem when a very low VENC setting is selected is that the entire flow information in the background will present significant levels of noise. Another problem is that setting a low VENC implies using stronger gradients to cover the same phase interval (±180°), and so stronger Eddy currents are induced when the gradients are switched on or off.[62] Nevertheless, it has been reported that if the VENC is set at no more than three times the ideal value, the peak velocity measurements show deviation less than 10%, a clinically acceptable level of error.[63] Other sources of in PC-MRI acquisitions other than inadequate VENC values include deviation of the imaging plane during data acquisition (e.g., cardiac or respiratory motion), inadequate temporal or spatial resolution, and field inhomogeneity (e.g., susceptibility artefact from metallic implants). Therefore, depending on the structure of interest, PC-MRI parameters should be set in order to minimize potential sources of error.[64]
Several image data sets can be acquired from of PC-MRI by processing the RAW data[62]:
Phase images presenting the actual 4D flow measurement with a grey background correspondent to the stationary tissue. The positive flow (coinciding with the gradient direction) is presented in white while the negative flow will be black;
Magnitude reconstructed images which represent pure anatomical information regarding the structures where the blood flows
Re-phased images representing reconstructed image from the RAW data with anatomy and flow emphasis. This kind of image, known as phase contrast magnetic resonance angiography (PC-MRA), provides the flow velocity profiles and is the type most used in this dissertation The PC-MRA images can be displayed as maximum intensity projection (MIP) images or as a semi-transparent 3D iso-surface which can be combined with 3D flow visualization (See Figure 1.7).
Velocity and flow information can be obtained using commercial softwares that allow the user to define 2D or 3D ROIs in the vessel’s lumen or within an intracardiac region sampled throughout the cardiac cycle. It is therefore important to understand the acquisition, visualization and quantification of these image sets as well as the potential applications of PC-MRA.
1.3.1 Acquisition
Although the theoretical principles for 3D and 4D velocity mapping have been known for several decades [65-67], until recently only 2D plane images have been clinically used. These techniques require an operator to correctly align the planes of acquisition and presents other well-known limitations.[68, 69] However, studies have reported that instead of storing the raw information in a 2D segmented k-space, it is possible to store the raw information obtained from the phase contrast gradient echo sequence in a 3D segmented k-space.[70] This allows the combination of 3D spatial encoding, three-directional velocity encoding and CMR cine (4D-VEC-MR) and as a consequence makes it possible to acquire complex 4D blood flow path lines and velocities, which is more notable especially in intracardiac pathologies such as congenital heart defects or acquired valvular diseases.[70]
Unfortunately this type of acquisition takes very long (approximately 10 minutes for a whole heart 4D measurement on a 1.5 Tesla MRI scanner) as it is necessary to synchronise the image acquisition with the respiratory and cardiac movements.[71] In other to reduce the
Figure 1.7 Image processing for obtaining a 3D PC-MRA of a healthy thoracic aorta. A PC-MRA image is obtained by calculating (voxel by voxel) the absolute velocity resulting from the combination of the 3 different acquired velocity components, with image masking based on the magnitude image. A: RAW data acquired from a PC-MRI with magnitude provided as reference and the 3 different velocity components Vx, Vy and Vz). B: The resulting PC-MRA images can be displayed as a maximum intensity projection (MIP) or as a semi-transparent 3D iso-surface which can be combined with 3D flow visualization.[6]
acquisition time while avoiding artefacts, it is common to use ECG triggers as illustrated in Figure 1.6B) [6] and monitored by CMR navigators [72] (Figure 1.6A) or self-gating techniques.[73] The consequences are that actually 30 to 60 % of the acquired data is rejected, depending on the regularity of the respiration and also on the existence or not of arrhythmias. The efficiency can be increased and the overall scan time reduced by changing the acquisition strategy. One option which is under investigation is the use of spiral k-space trajectories (spiral 4D flow).[74]
1.3.2 Pre-processing and PC-MRA calculation
In order to avoid offset errors in PC-MRA calculation due to Eddy Currents or phase wraps it is necessary to do a pre-processing step before analysing the 4D data. This Pre-Processing step consists in two parts: in the first part the non-moving tissues surrounding the heart are excluded, based on a low intensity tissues detected by the PC-MRI. This leads to a reduction of the Eddie Currents artefact. Secondly, it is applied an algorithm that proceeds to phase unwrapping in a small area with phase wraps in one of the phase encoded vector fields (in the tool used during this project, this feature was not fully operational). This step must be adapted to the CMR system, protocol and anatomic region of interest (ROI).[75, 76]
After the Pre-Processing, the PC-MRA can be calculated. This calculation allows the identification of vascular boundaries without additional measures. This means that it becomes more intuitive for users to segment blood structures based on contrast between regions where blood is circulating versus regions where there is no blood in circulation. In the case of the heart, its boundaries are in constant movement through the cardiac cycle. Since, in the calculation of PC-MRA, the cavities wall motion is not included, the ventricle’s boundaries estimated from the PC-MRA correspond to a mean of the wall position and are therefore smaller than the maximum volume of the ventricle in diastole.(Figure 1.7B).[6]
1.3.3 Data analysis
The first aspect when processing 3D CMR blood flow images is getting a visual image of the blood flow (pathlines and/or streamlines), the velocities vector field, and with some softwares the connectivity map or the blood flow pressure maps.[77]
It is important to quantify the visualized parameters regarding blood flow measurements. Based on PC-MRA data sets it is possible, with the appropriate software tools, to obtain the
Evaluation of blood flow, velocity, area of specified ROI’s [78]; Pressure differences [77, 79];
Wall shear stress [80];
Vessel elastic properties [81]; Turbulence intensity.[82]
Given the potential of 4D velocity acquisition, several studies have been emerging in order to associate characteristics of the blood flow in the heart and big vessels with the diagnosing and analysis of the progression of a cardiovascular disease or condition that might change the blood fluid dynamics.[83, 84]
1.4 Blood Flow Imaging state of the art
As there are so many different Cardiovascular Imaging (CVI) techniques and sub-techniques, it cannot be said that the global state of the art is dominated by a single CVI modality. Instead, It is useful to consider the state of the art for each different measurement that can be made. This work will only focus on the state of the art of blood flow analysis.
Even considering that CT provides fast 3D anatomical scans with very good spatial resolution, being able to detect the propagation of a contrast agent over time, it still does not provide more than an approximate estimate for the velocity of blood flow. As a consequence this is not the best imaging technique for blood flow analysis.
Alternatively, Doppler echocardiography can be employed to directly measure regional blood flow velocities in a 2D plane. Therefore this is the imaging modality which is more widely and routinely used for blood flow analysis and pathology diagnosing. When compared with CMR, and more precisely with PC-MRI this modality has some advantages that include the scan price and time, the amount of detectors available and the fact that it can be used in patients with pacemakers or metallic implants. It is also the best method to specifically image the exact location of one of the heart valves due to the thinner and more mobile leaflets compared with 4D CMR velocities mapping.
However, Doppler ultrasound does not allow the measurement nor the detection of non-regional blood structures in a single measurement as possible with CMR. It is also not possible to obtain 3D images. Studies have also shown that with Doppler ultrasound, peak velocities can be overestimated by as much as 25%.[85] Mean flow in large vessels can also be overestimated due to assume as constant velocity over the whole vessel area. In contrast, with PC-MRI it is possible to measure the variation of flow within the vessel. PC-MRI therefore has been found superior to
Doppler sonography for evaluation of mean flow.[86] In fact, CMR still has other potential advantages such as the retrospective analysis of the blood flow at any location and in any direction within the image volume. Further possibilities include measuring shear rates, pressure gradients, turbulence or even blood flow KE. However, the use of CMR compared to other techniques has some drawbacks including the long duration of the CMR 4D exam and complicated postprocessing, the moving boundaries of the heart cavities and the limited knowledge available. Therefore, before real clinical diagnosing and predictive value of flow measurements can be established, there is still the need for further investigation, including large studies with imaging performed before and after interventions, therapies or following the progression of different conditions.[6] Solutions to overcome the extensive duration of the 4D blood flow velocity mapping are currently under research and include:
Combination with other image techniques such as echo-planar imaging and radial imaging [87, 88];
2.1 Software Refinement
Flow analysis based on PC-MRA is a recent research area which is currently being explored. Therefore it is natural that there not yet available on the market extensively tested softwares; as a consequence, when using the ones that are currently available on clinical datasets, problems naturally arise which require tweaking the software. This is actually the main reason for the establishment of cooperations between developers and researchers which allows the development of better softwares/analysis tools and also the increase of knowledge on this research area.
In this project the MevisFlow software for blood flow analysis based on PC-MRA was mostly used. A more detailed description of this software is provided in the Material section (4.2.1). In order to reduce problems that could appear when developing the project, and also to have a better accuracy in the results, testing and refining this analysis tool from a clinical point of view was set as a first objective. The aim was to use all the relevant features of the program on a selected group of PC-MRA datasets, representative of the type of data analysed within this project. When problems or missing measurements were detected, an analysis of the causes was made and the information (screenshots, videos or working directories) sent to the developers in order to correct any problems and/or include new measurements. This interaction was stronger at the beginning of the project, but it also extended throughout the whole duration of the project.
2.2 Pressure gradient across an aortic coarctation
Cardiac Magnetic Resonance (CMR) provides high-quality anatomic information of the aorta. However, flow velocities using 2-dimensional velocity encoded cine magnetic resonance imaging (VEC-MRI) were reported to underestimate pressure gradients.[89] Four-dimensional VEC-MRI (4D-VEC-MRI) provides time resolved blood flow velocities in a 3-dimensional volume that can cover the entire aorta. From these velocity fields, dynamic pressure differences along the course of a vessel (4D pressure fields) can be computed by solving the Pressure-Poisson equation.[90-93] Briefly, the Pressure-Poisson equation is derived from the momentum equation of the Navier-Stokes equations for incompressible fluids by applying the divergence operator. The
validity of 4D pressure fields has been systematically evaluated on phantom and initial human studies.[90]
The goal of this study was to investigate the accuracy of this method in a clinical setting in patients with CoA. In this context it was investigated the agreement between VEC-MRI based 4D pressure fields and cardiac catheterization as the clinical gold standard.
2.3 Kinetic energy within the ventricles
One of the possible measurements that can be made from PC-MRA is actually the Kinetic Energy (KE) and the KE loss, which has the potential to become an important measurement to consider in future diagnosing and follow up of pathologies, especially within the heart. Actually The question of the maintenance of KE of blood flowing in the heart, forming loops, within the heart by loops has been recently been under discussion [94, 95], but it is commonly agreed that it this issue is connected with flow inertia.[96] Therefore the first attempts to have an idea about investigate KE within the heart was by studying invasively the pressure decay of LV and from then measure the inertia force.[96, 97] Up to now, a single study has been carried out in order to non-invasively visualize and quantify the KE within the ventricles using CMR.[5]
The main objective of the present study is to visualize and to quantify the amount of KE lost within the ventricles (both LV and RV) and to compare the energy curves of healthy ventricles with patients with conditions in the respective valve (Mitral valve in the LV study and pulmonary valve in the RV study). Since this is a blood flow parameter that has not been explored [5], the software used does not allow a direct KE measurement. It was therefore necessary to develop a procedure in order to accurately calculate the KE more quickly and in a more direct way. It was then necessary to collect datasets from both patient and control groups and analyse the results. The last objective within this topic was to create distributions and comparison curves to facilitate the visualization of the results.
2.4 Other objectives
In order to complement the main objectives while taking advantage of the available data sets, other objectives were also defined, involving collaboration with other members of the team:
![Figure 1.1 Frontal heart diagram with anatomy major landmarks and venous (blue) and arterial (red) blood flow directions through the atria, ventricles, and associated vessels.[3]](https://thumb-eu.123doks.com/thumbv2/123dok_br/15185333.1016303/18.892.384.782.359.766/figure-frontal-diagram-landmarks-arterial-directions-ventricles-associated.webp)


![Figure 1.5 Colour Doppler echocardiogram in parasternal long axis view showing mitral regurgitation (MR jet), the heart cavities: left ventricle (LV), left atrium (LA), right ventricle (RV) and aorta artery (Ao).[1]](https://thumb-eu.123doks.com/thumbv2/123dok_br/15185333.1016303/23.892.313.791.346.740/figure-doppler-echocardiogram-parasternal-regurgitation-cavities-ventricle-ventricle.webp)