ANDREIA CRISTINA SÁ GOMES
EFFECT OF UNSATURATED FATTY ACIDS UPON
CATECHOLAMINE HANDLING BY ADRENAL CHROMAFFIN
CELLS
Dissertação de Candidatura ao grau de
Mestre em Bioquímica da Universidade
do Porto
Orientador – Professora Doutora Laura
Virgínia Pereira Teixeira Ribeiro
Categoria – Professor auxiliar
Afiliação – Departamento de Bioquímica
da Faculdade de Medicina da
Universidade do Porto
iii
Agradecimentos
Ao finalizar o Mestrado em Bioquímica, quero deixar uma palavra de agradecimento a todas as pessoas que me apoiaram ao longo deste percurso e colaboraram para a realização deste trabalho.
Em primeiro lugar, gostaria de agradecer à minha orientadora, Professora Doutora Laura Ribeiro, pela oportunidade e total disponibilidade oferecida, bem como por todos os conselhos e apoio científico que me transmitiu na discussão e orientação deste projeto.
A todo o Departamento de Bioquímica da Faculdade de Medicina da Universidade do Porto agradeço o acolhimento, a ajuda e simpatia. Em especial, ao Gustavo e à Marisa, agradeço a preciosa ajuda no desenvolvimento deste projeto.
Agradeço à Doutora Maria João Pinho, do Departamento de Farmacologia e Terapêutica da Faculdade de Medicina da Universidade do Porto, ao Professor Doutor Rui Medeiros, e muito especialmente à Dra. Ana Luisa, do Instituto Português de Oncologia do Porto, pela ajuda e apoio que gentilmente me deram na quantificação dos níveis de RNAm através de PCR em tempo real.
À Reitoria da Universidade do Porto e ao Banco Santander, agradeço o financiamento que concederam no âmbito do projeto IJUP 179/2010 que permitiu a realização deste trabalho.
Aos veterinários e técnicos do matadouro “Central Carnes” de Famalicão, local onde obtivemos as glândulas suprarrenais de Boi, pela disponibilidade e simpatia com que sempre nos receberam. Sem o seu contributo este trabalho não seria possível.
Não poderia terminar sem agradecer aos meus pais e ao meu irmão: Muito, muito obrigada pelo inquestionável apoio, motivação e paciência. Sem o vosso amparo nada seria possível.
Por fim, a todos os meus amigos, agradeço toda a boa disposição e ânimo. Em especial ao Sérgio: Obrigada por todos os miminhos, e pelo apoio, carinho e compreensão demonstrados nesta fase importante da minha vida
v
General contents
Agradecimentos ... iii General contents ... v Abstract ... vii Resumo ... ixOral communications under the scope of this thesis ... xi
Contents ... xiii
List of tables ... xv
List of figures ... xv
vii
Abstract
Overwhelming evidence clearly shows that the prevalence of obesity is dramatically increasing worldwide, and is associated with an increased risk of cardiovascular (CV) disease and metabolic disorders. The optimal dietary strategy for the prevention of chronic diseases remains a challenging and a highly relevant preventive health issue. Adrenaline (AD) and noradrenaline (NA), the main mediators of the sympathoadrenomedullary system, play crucial roles in the regulation of metabolic and CV homeostasis. Interestingly enough, relatively to metabolic syndrome, AD and NA seem to behave very differently: whereas NA levels positively correlate with obesity and CV risk, AD shows an inverse association with CV mortality.
Fatty acids are not only an important direct source of energy but they also play key roles in regulating a range of physiological responses and the dysfunction of their metabolism can impair nervous control of energy homeostasis. The typical western diet is overloaded with omega-6 fatty acids and contains insufficient omega-3 fatty acids, and this dietary imbalance in fatty acids is a fundamental underlying cause of many chronic diseases including CV disease. In line with this, omega-3 fatty acids are usually associated with cardioprotective benefits. On the other hand, consumption of trans fatty acids, even at low levels of intake, significantly increases the risk of coronary events. Although fatty acids can have marked effects on neurosecretion, very limited information is available concerning the effect of these molecules on catecholamines (CA) handling by adrenal chromaffin cells.
The aim of this work was to investigate the effect of several fatty acids on CA synthesis and secretion from chromaffin cells. Tyrosine hydroxilase (TH) and phenylethanolamine N-methyltransferase (PNMT) expression was also evaluated under the same conditions. For that purpose, the effect of chronic (24 hours) exposure to monounsaturated, trans and polyunsaturated fatty acids upon the above parameters was investigated, using bovine adrenal chromaffin cells. CA in cells and liquids were quantified by HPLC and mRNA levels of both enzymes were analyzed by relative quantification using quantitative real-time PCR.
With the exception of oleic acid, all the unsaturated fatty acids tested influenced CA handling by adrenal chromaffin cells. Our results suggest that these fatty acids affected, through different pathways, the cellular content and release of CA, regardless both the number of carbon atoms and the localization of the first double bound. The fatty acids of omega-6 series differently affected CA handling: arachidonic acid seemed to impair the vesicular transport of CA and linoleic acid had the opposite effect, i.e. seemed to increase
viii
this function, whereas γ-linolenic acid selectively impaired the availability of AD by interfering with its synthesis and release. Within the omega-9 fatty acids, elaidic acid, the 9-trans oleic acid isomer, behaved similarly to γ-linolenic acid, whereas, as previously mentioned, oleic acid was devoid of effect. Eicosapentaenoic and docosahexaenoic acids, belonging to omega-3 series, did not differentiate between AD and NA, and were able to impair both CA synthesis and release.
Further studies are required to identify and characterize the intracellular responses involved in the actions of these unsaturated fatty acids over CA responses. That knowledge, together with data obtained from “in vivo” studies, might help to sustain future nutritional recommendations in order to improve health.
Key-words: Catecholamines, adrenaline, noradrenaline, bovine chromaffin cells,
ix
Resumo
A prevalência da obesidade está a aumentar drasticamente em todo o mundo, estando associada a um risco aumentado de doença cardiovascular (CV) e alterações metabólicas. A procura de estratégias dietéticas que ajudem a prevenir estas doenças crónicas continua a ser um desafio extremamente importante. A adrenalina (AD) e a noradrenalina (NA), os principais mediadores do sistema simpatoadrenomedular, desempenham efeitos marcados no metabolismo energético e na homeostasia CV. Curiosamente, a AD e a NA parecem comportar-se de modo muito diferente na síndrome metabólica: enquanto os níveis de NA se associam positivamente com a obesidade e o risco CV, a AD apresenta uma associação inversa com a mortalidade CV.
Os ácidos gordos são, não só uma importante fonte de energia, mas também exercem funções cruciais na regulação de várias respostas fisiológicas, e a alteração do seu metabolismo pode prejudicar o controlo central da homeostasia energética. A dieta típica ocidental apresenta uma sobrecarga de ácidos gordos ómega-6 e contem ácidos gordos ómega-3 em quantidade insuficiente, e este desequilíbrio dietético em ácidos gordos é uma causa importante subjacente a muitas doenças crónicas, incluindo doenças CV. De acordo com isto, os ácidos gordos ómega-3 estão geralmente associados a benefícios cardioprotetores. Por outro lado, o consumo de ácidos gordos trans, mesmo em baixas quantidades, aumenta significativamente o risco de eventos coronários. Apesar dos ácidos gordos poderem ter vários efeitos na neurosecreção, sabe-se ainda pouco sobre o efeito destas moléculas na disponibilidade de catecolaminas (CA) em células cromafins adrenais.
O objetivo deste trabalho foi investigar o efeito de vários ácidos gordos na síntese e libertação de CA a partir de células cromafins. Além disso, avaliou-se a expressão da hidroxílase da tirosina (TH) e da feniletanolamina N-metil transférase (PNMT) nas mesmas condições experimentais. Para tal, usando células cromafins adrenais de Boi, avaliou-se o efeito da exposição crónica (24h) a ácidos gordos monoinsaturados, trans e polinsaturados nos parâmetros referidos acima. As CA nas células e líquidos foram quantificadas por HPLC e os níveis de RNAm das duas enzimas foram avaliados por quantificação relativa, usando PCR quantitativo em tempo real. À exceção do ácido oleico, todos os ácidos gordos insaturados afetaram a disponibilidade de CA nas células cromafins. Os nossos resultados sugerem que estes ácidos gordos afetam, através de diferentes mecanismos, o conteúdo celular e a libertação de CA, independentemente do número de átomos de carbono e da localização da primeira ligação dupla. Os ácidos gordos da série ómega-6 regularam de forma distinta as CA: o efeito do ácido araquidónico foi compatível com uma inibição do
x
transportador vesicular, o ácido linoleico pareceu aumentar a sua função e o ácido γ-linolénico afetou seletivamente os níveis de AD, reduzindo a sua síntese e libertação. Na série ómega-9, o ácido elaídico, o isómero trans-9 do ácido oleico, comportou-se de forma semelhante ao γ-linolénico, enquanto o oleico, como referido anteriormente, não teve qualquer efeito. Os ácidos eicosapentaenóico e docosahexaenóico, da série ómega-3, não tiveram um efeito diferencial nas duas CA, reduzindo a síntese e libertação de ambas. Estudos posteriores serão necessários para identificar e caracterizar as respostas intracelulares envolvidas nas ações dos ácidos gordos insaturados sobre a disponibilidade de CA. Este conhecimento, juntamente com dados obtidos em modelos “in vivo”, poderá ajudar a fundamentar recomendações nutricionais no sentido de melhorar a saúde.
Palavras-chave: Catecolaminas, adrenalina, noradrenalina, células cromafins de Boi,
xi
Oral communications under the scope of this thesis
A.Gomes, G. Correia, M. Moz, M. Coelho, A.L. Teixeira, R. Medeiros, F. Leite, D. Torres and L. Ribeiro. “Regulation of adrenaline and noradrenaline handling by adrenal chromaffin cells: role of unsaturated fatty acids”. XI Congress of Nutrition and Food, Centro de Congressos da Alfândega, Porto. May 2012.
A. Gomes, G. Correia, M. Moz, M. Coelho, A. L. Teixeira, R. Medeiros, F. Leite, D. Torres, L. Ribeiro “Effect of fatty acids upon catecholamine handling by adrenal chromaffin cells”. 5th Meeting of Young Researchers. Reitoria da Universidade do Porto, Porto. February 2012.
xiii
Contents
Chapter I - Introduction ... 1
1. Chromaffin cells in adrenal gland ... 3
1.1. Adrenal gland ... 3
1.2. Chromaffin cells ... 3
1.2.1. Biosynthesis and metabolism of catecholamines ... 4
1.2.1.1. Catecholamine biosynthesis ... 4
1.2.1.2. Catecholamine metabolism ... 5
1.2.2. Regulation of catecholamine handling ... 7
1.2.3. Adrenergic receptors ... 9
1.1.3.1. α-Adrenoceptors ... 10
1.1.3.2. β-Adrenoceptors ... 10
2. Fatty acids ... 11
2.1. Omega-3 fatty acids ... 12
2.2. Omega-6 fatty acids ... 13
2.3. Omega-9 fatty acids ... 14
2.4. Cellular uptake of fatty acids ... 15
3. Catecholamines and metabolic syndrome ... 16
4. Aim……… ... 16
Chapter II – Materials and Methods ... 19
1. Preparation of adrenal medullary cells ... 21
2. Cell culture ... 21
3. In vitro experiments ... 22
3.1. Chronic treatment ... 22
3.2. Studies on catecholamine handling ... 22
4. Determination of catecholamines by high pressure liquid chromatography with electrochemical detection ...22
5. Determination of enzymatic expression by quantitative real-time PCR ... 23
6. Determination of cell viability ... 25
7. Determination of proteins ... 25
8. Calculations and statistics ... 25
9. Materials ... 26
Chapter III– Results ... 27
1. Catecholamine total content ... 29
2. Catecholamine cellular content ... 30
3. Catecholamine basal release ... 32
4. Catecholamine KCl-stimulated release ... 33
5. TH and PNMT mRNA levels ... 35
Chapter IV – Discussion ... 37
Chapter V –Conclusion and Future Perspectives ... 43
xv
List of tables
Table 1. Classification of fatty acids. ... 11
Table 2. Primer sequences and annealing temperature used for quantitative real-time PCR ... 24
List of figures Figure 1. Catecholamine biosynthesis pathway ... 5
Figure 2. Metabolism of catecholamines ... 6
Figure 3. Mechanisms for maintaining the intracellular content of catecholamines ... 7
Figure 4. Full fusion of exocytosis ... 9
Figure 5. Structure of adrenergic receptors ... 10
Figure 6. Metabolic pathways of omega-3, omega-6 and omega-9 fatty acids synthesis. ... 12
Figure 7.Chemical structure of omega-3 fatty acids ... 13
Figure 8. Chemical structure of omega-6 fatty acids. ... 14
Figure 9. Chemical structure of omega-9 fatty acids ... 15
Figure 10. Fatty acid transport across the cell membrane ... 16
Figure 11. Layers obtained after centrifugation with chloroform in RNA extraction ... 23
Figure 12. Catecholamine total content in bovine chromaffin cells after chronic treatment (24 hours) with eicosapentaenoic acid, docosahexaenoic acid, oleic acid and elaidic acid ... 29
Figure 13. Catecholamine total content in bovine chromaffin cells after chronic treatment (24 hours) with Υ-linolenic acid, linoleic acid and arachidonic acid ... 30
Figure 14. Catecholamine cellular content in bovine chromaffin cells after chronic treatment (24 hours) with eicosapentaenoic acid, docosahexaenoic acid, oleic acid, elaidic acid, Υ-linolenic acid, linoleic acid and arachidonic acid ... 31
Figure 15. Catecholamine basal release in bovine chromaffin cells after chronic treatment (24 hours) with eicosapentaenoic acid, docosahexaenoic acid, oleic acid and elaidic acid ... 32
Figure 16. Catecholamine basal release in bovine chromaffin cells after chronic treatment (24 hours) with Υ-linolenic acid, linoleic acid and arachidonic acid ... 33
Figure 17. Catecholamine KCl-stimulated release in bovine chromaffin cells after chronic treatment (24 hours) with eicosapentaenoic acid, docosahexaenoic acid, oleic acid, elaidic acid, Υ-linolenic acid, linoleic acid and arachidonic acid... 34
Figure 18. Comparison of mRNA levels of tyrosine hydroxilase and phenylethanolamine N-methyltransferase in control conditions and after chronic treatment (24 h) with linoleic acid, elaidic acid, eicosapentaenoic acid, γ-linolenic acid and docosahexaenoic acid (at 100 μM), by quantitative real-time RT-PCR ... 35
Figure 19. Comparison of mRNA levels of tyrosine hydroxylase and phenylethanolamine N-methyltransferase in control conditions and after chronic treatment (24 h) with oleic acid (at 100 μM), by quantitative real-time PCR. ... 36
Figure 20. Comparison of mRNA levels of tyrosine hydroxylase and phenylethanolamine N-methyltransferase in control conditions and after chronic treatment (24 h) with linoleic acid, elaidic acid, eicosapentaenoic acid, Υ-linolenic acid and docosahexaenoic acid (at 100 μM), by quantitative real-time PCR ... 36
xvii
List of abbreviations
AA Arachidonic acid
AAAD L-aromatic amino acid decarboxylase
AD Adrenaline
ATP Adenosine-5'-triphosphate
BH4 Tetrahydrobiopterin
CA Catecholamines
Ca2+ Calcium ion
cAMP Cyclic adenosine monophosphate
cDNA Complementary DNA
CO2 Carbon dioxide
COMT Catechol O-methyltransferase
COOH Carboxylic group
COX Cyclooxygenase
DA Dopamine
DAG Diacylglycerol
DDC Dopa decarboxylase
DEPC Diethylpyrocarbonate
DHA Docosahexaenoic acid
DHMA 3,4-dihydroxymandelic acid
DHPG 3,4-dihydroxyphenylglycol
DMSO Dimethyl sulfoxide
DNA Deoxyribonucleic acid
DNAse Deoxyribonuclease DOPA Dihydroxyphenylalanine DOPAL 3,4-dihydroxyphenylacetaldehyde DOPEGAL 3,4-dihydroxyphenylglycolaldehyde DTT Dithiothreitol DβH Dopamine-β-hydroxylase EA Elaidic acid
EDTA Ethylenediamine tetraacetic acid
EP1R Prostaglandin EP receptor 1
EP3R Prostaglandin EP receptor 3
EPA Eicosapentaenoic acid
FABPpm Plasma membrane fatty acid binding protein
FATP Six fatty acid transport proteins
GAPDH Glyceraldehyde-3-phosphate dehydrogenase
GPCR G protein-coupled receptors
H+ Hydrogen ion
HDL High-density lipoproteins
HPLC-ED High pressure liquid chromatography with electrochemical detection
IL Interleukin
IP3 Inositol trisphosphate
IP3R Inositol trisphosphate receptor
KCl Potassium chloride
xviii
LACS Long-chain acyl-CoA synthetase
LCFA Long-chain fatty acids
LDL Low-density lipoproteins
MAO Monoamine oxidase
Mg2+ Magnesium ion
MHPG 3-methoxy-4-hydroxyphenylglycol
MN Metanephrine
MOPEGAL 3-methoxy-4-hydroxyphenylglycolaldehyde
mRNA Messenger ribonucleic acid
MTT 3-(4,5-dimethylthiazol-2-yl)-2,5-diphenyl tetrazolium bromide
NA Noradrenaline
Na+ Sodium ion
NET Noradrenaline transporter
NH2 Amine group
NM Normetanephrine
NSF N-ethylmaleimide sensitive fusion protein
OA Oleic acid
PCR Polymerase chain reaction
PGE Prostaglandin E PI-3-kinase Polyphosphoinositol-3-kinase PKC Protein kinase C PLC Phospholipase C PNMT Phenylethanolamine N-methyltransferase qRT-PCR Quantitative real-time PCR
RNA Ribonucleic acid
RNAse Ribonuclease
RNaseOUT Ribonuclease inhibitor
SNAP-25 Synaptosome-associated protein of 25 KDa
SNARE Soluble NSF attachment receptor
TH Tyrosine hydroxylase
Tyr L-Tyrosine
VLDL Very-low-density lipoprotein
VMA Vanillylmandelic acid
VMAT Vesicular monoamine transporter
Introduction
INTRODUCTION
3
1. Chromaffin cells in adrenal gland
1.1. Adrenal gland
Adrenal glands are located in the upper pole of each kidney and are surrounded by adipose tissue. In humans, each gland weights between 6 and 10g and has approximately 5 by 3 cm. These glands are composed by two embryological different regions: cortex and medulla (1). Adrenal Cortex, which develops from mesoderm, is separated in three anatomic zones: glomerulosa, fasciculate and reticularis, respectively, the outer, intermediate and inner region of adrenal cortex (1-3). Adrenal Medulla is mainly constituted by chromaffin cells which derive from neural crest (4) and differentiate into: adrenergic or noradrenergic chromaffin cells, small intensely fluorescent cells, correspondent to the small granule cells observed by electron microscopy, and ganglionic neurons, either noradrenergic or cholinergic (3, 5).
1.2. Chromaffin cells
Chromaffin cells, the major cell type of the adrenal medulla, are arranged in cords around the blood capillaries (6). The term "chromaffin" is based on the yellow-brownish colour when cells are stained with chromic acid. Chromium salts oxidize and polymerize catecholamines (CA) resulting in a brownish-yellow colour (7).
Adrenergic and noradrenergic chromaffin cells synthesize mainly the CA: noradrenaline (NA) and adrenaline (AD) from tyrosine (Tyr). NA is also synthesized in the central nervous system and sympathetic postganglionic neurons, whereas almost all of the AD is synthesized in the adrenal medulla (3). Among species, the ratio of adrenergic and noradrenergic cells is variable. For instance, rat chromaffin cells are predominantly adrenergic cells (80 ± 85%). In human and bovine glands, 75% of chromaffin cells are adrenergic, and the rabbit has a small proportion of noradrenergic cells. The relative proportion of these cells can reproduce distinct species-specific physiological needs (5).
CA are synthesized by chromaffin cells, co-stored in large dense-core secretory granules with enkephalin, neuropeptide Y, atrial natriuretic factor, chromogranins, and tissue plasminogen activator and released directly into the circulation by exocytosis (6). Once in the bloodstream, CA act on target cells through binding to adrenergic receptors, exerting crucial roles in both homeostatic regulation and synchronized response to stress (the “fight-or-flight” response). The “fight-or-flight” response, firstly described by Walter Cannon (8), leads to an
INTRODUCTION
4
increase of heart rate, contractility and vascular tone, an increase of blood flow to skeletal muscle, a suppression of insulin release and mobilization of glucose from liver. A long exposure to stressors can be harmful to health. In fact, high plasmatic CA levels are involved with several features of metabolic syndrome and cardiovascular disease (9).
1.2.1. Biosynthesis and metabolism of catecholamines
1.2.1.1. Catecholamine biosynthesis
The biosynthesis of CA (Figure 1) begins by the conversion of the amino acid Tyr to dihydroxyphenylalanine (DOPA). Tyr is a non-essential amino acid, which can be obtained from diet or from hydroxylation of phenylalanine in liver. Tyr, after uptake by adrenal chromaffin cells, is converted in cytosol to DOPA by tyrosine hydroxylase (TH), the rate-limiting step of CA synthesis (10). TH is a soluble cytoplasmic enzyme which use tetrahydrobiopterin (BH4) as cofactor and molecular oxygen in the reaction that originates DOPA, dihydrobiopterin and water (11). The next step is the synthesis of dopamine (DA) from DOPA, catalyzed by a nonspecific enzyme, L-aromatic amino acid decarboxylase (AAAD), also known as dopa decarboxylase (DDC), which uses pyridoxal phosphate as cofactor.
After its synthesis, DA is stored in large dense-core secretory granules and converted into NA by dopamine-β-hydroxylase (DβH). This enzyme is co-released with NA and AD by exocytosis (12).
The last enzymatic step of CA biosynthesis pathway is catalyzed by the soluble cytoplasmic enzyme phenylethanolamine N-methyltransferase (PNMT), which uses S-adenosyl-methionine as cofactor, for the conversion of NA to AD (13).
INTRODUCTION
5
Figure 1. Catecholamine biosynthesis pathway.
In catecholamine synthesis, tyrosine hydroxylase catalyzes the conversion of the amino acid tyrosine to DOPA. Then, DOPA is converted to dopamine by dopa decarboxylase. In chromaffin granule, dopamine is converted to noradrenaline by dopamine-β-hydroxylase. Finally, in the cytoplasm, phenylethanolamine N-methyltransferase catalyzes the conversion of noradrenaline to adrenaline.
1.2.1.2. Catecholamine metabolism
Monoamine oxidase (MAO) and catechol O-methyltransferase (COMT) are the two enzymes responsible for CA metabolism. MAO is mainly associated with mitochondrial surface and plays an important role in cytoplasmatic CA metabolization by deamination. On the other hand, COMT, predominantly localized in the cytoplasm, requires Mg2+ for transferring a methyl group from S-adenosylmethionine to the 3-hydroxyl group of the A
INTRODUCTION
6
catechol ring of CA, originating normetanephrine (NMN) from NA and metanephrine (MN) from AD (14).
In CA metabolism, NA and AD are initially deaminated by MAO to dihydroxyphenylglycolaldehyde (DOPEGAL). Then, this aldehyde is reduced to 3,4-dihydroxyphenylglycol (DHPG) by aldehyde reductase, or, otherwise, undergoes oxidation by the action of aldehyde dehydrogenase originating the 3,4-dihydroxymandelic acid (DHMA) (Figure 2 A).
On the other hand, AD and NA can be methylated by COMT, respectively, to MN and NMN (Figure 2 B). NMN and MN are oxidized by MAO, and originate hydroxyphenylglycolaldehyde (MOPEGAL). MOPEGAL is reduced to 3-methoxy-4-hydroxyphenylglycol (MHPG) by aldehyde reductase, or it can also be oxidized to vanillylmandelic acid (VMA). In addition, DOPEGAL can be converted to DHPG by aldehyde reductase. DHPG is converted to MHPG by COMT. Finally, MHPG is converted to MOPEGAL, and is oxidized to VMA (14, 15).
Figure 2. Metabolism of catecholamines.
A) Pathways of oxidative deamination of catecholamines to their corresponding biogenic aldehyde intermediates and acid derivate or alcohol metabolites. B) Pathways of NA metabolism to vanillylmandelic acid. DβH: dopamine β-hidroxylase; PMNT: phenylethanolamine N-methyltransferase; MAO: monoamine oxidase; COMT: catechol-O-methyltransferase; ALD: aldehyde dehydrogenase; AR: aldehyde reductase; ADH: alcohol dehydrogenase; DA: dopamine; NA: noradrenaline; AD: adrenaline; DHMA: 3,4-dihydroxymandelic acid; DOPAL, 3,4-dihydroxyphenylacetaldehyde; DOPET: 3,4-dihydroxyphenylethanol; DOPAC: dihydroxyphenylacetic acid; DOPEGAL: dihydroxyphenylglycolaldehyde; NMN: normetanephrine; DHPG: 3,4-dihydroxyphenylglycol; MHPG: 3-methoxy-4-hydroxyphenylglycol; MOPEGAL: 3-methoxy-4-hydroxyphenylglycolaldehyde; VMA: vanillylmandelic acid. Thick arrows indicate predominant mechanism of degradation. Adapted from Eisenhofer et al. (14).
INTRODUCTION
7 1.2.2. Regulation of catecholamine handling
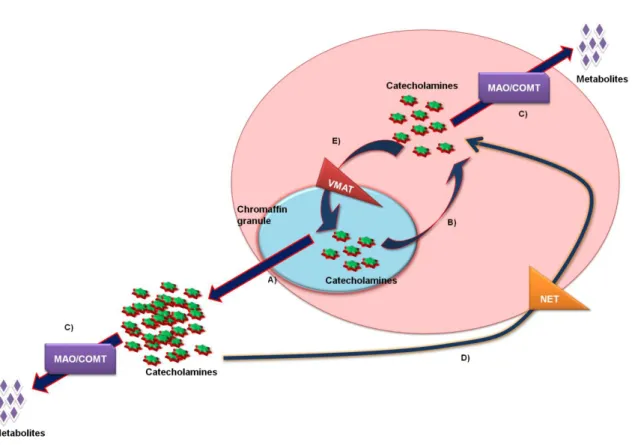
Figure 3. Mechanisms for maintaining the intracellular content of catecholamines.
A) release of catecholamines by exocytosis, B) passive output of catecholamines to cytoplasm (leakage); C) metabolism of catecholamines; D) reuptake of catecholamines by membrane transporters (e.g. NET), E) uptake of catecholamines from the cytoplasm to the chromaffin granules by vesicular monoamine transporters (VMATs). Adapted from Eisonhefer et al. (16).
Several mechanisms regulate CA intracellular content: (1) CA storage; (2) leakage; (3) CA re-uptake and (4) CA release (basal release and exocytosis).
Generally, low concentrations of CA are free in the cytosol and can be metabolized by MAO and COMT. However, this metabolization process occurs before and independently of exocytosis. After the conversion of Tyr, both NA and AD can be stored in chromaffin granules (Figure 3 E). These granules contain very high concentrations of CA, ascorbic acid, adenosine-5'-triphosphate (ATP), acidic proteins (chromogranins) and DβH. The vesicular monoamine transporters (VMATs), located in chromaffin granules membranes, have 12 transmembrane domains with N- and C-terminal in the cytoplasm (17). The CA capture into secretory granules, is an ATP-dependent process associated with a proton pump (18).
Leakage is another mechanism that regulates the intracellular content of CA, and is characterized by a passive exit of CA from granules into cytoplasm (Figure 3 B). Leakage is balanced by the re-entry of about 90% of CA into chromaffin granules by VMATs (16).
INTRODUCTION
8
After release, about 90% of CA are re-captured into the chromaffin cells by the membrane transporter NET (Figure 3 D). The released CA enter bloodstream and/or are metabolized. In rat and human chromaffin cells, this transporter is only present in adrenergic cells but is responsible for the re-uptake of both CA (19). CA levels influence the expression of this transporter: high concentrations of CA increase the number of transporters, and low concentration of CA lead to a decrease of their density (20).
The secretory content (including CA and peptides, among others) of chromaffin granules is released by exocytosis (Figure 3 A and Figure 4). A strong stimulation provokes the release of about 200 chromaffin granules per cell (calculated average for a single cell) (21). CA are released through two types of exocytosis: constitutive or regulated. Constitutive exocytosis is a continuous process that occurs without any stimulus, whereas the regulated exocytosis occurs after an external stimulus, which leads to an increase of intracellular Ca2+ (22). ‘‘Full fusion’’ exocytosis, ‘‘kiss-and-run’’ exocytosis and piecemeal degranulation are the three forms of exocytosis already described (21).
In chromaffin cells, acetylcholine released by the splanchnic nerve is the main physiologic secretagogue for CA release, exerting this effect through binding to muscarinic and nicotinic receptors. Activation of nicotinic receptors leads to extracellular Ca2+ and Na+ entrance into the cells, causing a slight membrane depolarization and leading to the opening of Na+ voltage sensitive channels. This event causes a large cytoplasmic membrane depolarization, inducing the opening of several types of voltage-dependent Ca2+ channels thus increasing intracellular Ca2+ from the extracellular compartment (5, 23, 24). On the other hand, activation of muscarinic receptors leads to the production of inositol trisphosphate (IP3) and diacylglycerol (DAG) after activation of phospholipase C (PLC). Afterwards, IP3 stimulates the release of sequestered Ca2+ in stores, leading to an increased concentration of cytoplasmatic Ca2+ (5). Ca2+ together with DAG can then activate protein kinase C (PKC), which plays an important role in the regulation of exocytosis, through its involvement in the phosphorylation of proteins responsible for vesicle docking, priming and fusion (25).
In the resting state, the network of filamentous actin which forms the cellular cytoskeleton prevents the traffic of chromaffin granules to the plasma membrane. (26). The increase of intracellular Ca2+ levels leads to the disruption of this cytoskeleton, allowing exocytosis (27).
In chromaffin cells, exocytosis is an extremely regulated mechanism (5). Besides acetylcholine, several other agents regulate CA release, such as other nicotinic or muscarinic agonists, bradykinin, angiotensin II, histamine, ATP, depolarization by KCl, among others.
INTRODUCTION
9
Figure 4. Full fusion of exocytosis.
A) Full fusion exocytosis. After stimulation, plasma membrane calcium channels open, allowing an influx of Ca2+.
Consequently, the secretory granules move up to the plasma membrane, dock and prime for fusion. After fusion catecholamines are released.
B) Anchoring process of chromaffin granules. Watching closely, the secretory granule is docked at plasma membrane
between two Ca2+ channels. Both syntaxin and SNAP-25 (plasma membrane proteins) and the synaptobrevin (a vesicle protein)
constitute an essential complex for fusion. Ca2+ sensor, which triggers fusion, is synaptotagmin. The release can be influenced by more than one calcium channel because synaptotagmin can be detached from the calcium channel. Adapted from Matthews, G. (23).
1.2.3. Adrenergic receptors
After release, CA exert their physiologic effects by activation of the plasma membrane receptors, adrenergic receptors or adrenoreceptors (28). Adrenoreceptors belong to the superfamily of G protein-coupled receptors (GPCR) (15). These receptors are single proteins, with an extracellular amine terminal (NH2) (with glycosylation sites) and an intracellular carboxylic terminal (COOH) (with phosphorylation sites). These receptors have seven transmembrane domains interconnected by three extracellular hydrophobic loops and three intracellular loops. Both second and third intracellular loops are linked to G proteins subunits (15) (Figure 5).They are divided in two major classes: α and β.
INTRODUCTION
10
Figure 5. Structure of adrenergic receptors.
The structure of this receptor is characterized by an extracellular NH2 terminal, intracellular COOH and seven transmembrane
domains in hydrophobic helix, which are interconnected by three extracellular hydrophobic loops and three intracellular loops. Adapted from García-Sáinz et al. (29).
1.2.3.1. α- Adrenoreceptors
α-adrenoreceptors include two subclasses: α1 and α2. α1-adrenoreceptors can stimulate polyphosphoinositide hydrolysis leading to the formation of IP3 and DAG. As
mentioned before, IP3 promotes the release of sequestered Ca2+ from intracellular stores, which increases the cytoplasmatic concentration of free Ca2+ and the activation of various calcium-dependent protein kinases, and DAG activates PKC. α1-adrenoreceptors have been also found to activate mitogen-activated kinases (MAPK) and polyphosphoinositol-3-kinase (PI-3-kinase) (29, 30). α2-adrenoreceptors inhibit adenylyl cyclase activity and cause intracellular cAMP levels to decrease. α2-adrenoreceptors inhibition of adenylyl cyclase occurs through the mediation of the inhibitory regulatory protein, Gi, that couples to α2-adrenoreceptors inhibiting adenylyl cyclase. In addition, some of the effects of α2-adrenoreceptors are independent of their ability to inhibit adenylyl cyclase; for instance activation of potassium channels and closing of calcium channels. These actions may be mediated by G proteins of the Gi/Go class (28).
1.2.3.2. β-Adrenoreceptors
CA binding to the three β-adrenoreceptors subtypes (β1, β2 and β3), results in activation of adenylyl cyclase and increased conversion of ATP to cAMP. Activation of this enzyme is mediated by the stimulatory coupling protein, Gs. cAMP is the major second messenger of β-adrenoceptors activation (28).
In the scope of this work, it is relevant to highlight in this section that in humans, CA are responsible for the mobilization of lipids from adipose tissue. Indeed, lipolysis, the process through which triglycerides are hydrolyzed into glycerol and fatty acids, results from
INTRODUCTION
11 the balance between the lipolytic effect of β-adrenergic receptors and the antilipolytic effect of α2-adrenergic receptors (31).
2. Fatty acids
As reviewed before (32), fatty acids can be classified by chain length and double bound number (Table 1).
Table 1. Classification of fatty acids. Adapted from Pilz, S. et al. (32).
Chain length (number of carbons)
Short-chain fatty acids: < 8 carbons Medium-chain fatty acids: 8 – 12 carbons Long-chain fatty acids: 13 – 22 carbons Very-long-chain fatty acids: > 22 carbons
Double bound number
Saturated fatty acids (SFA)
Monounsaturated fatty acids (MUFA) Polyunsaturated fatty acids (PUFA)
From a nutritional point of view, fatty acids can be classified as essential or non-essential. The essential fatty acids are not synthesized in the body and are mostly obtained from diet, whereas non-essential fatty acids can be synthesized by human body from other fatty acids (Figure 6).
The type and quantity of dietary fat is a significant risk factor for cardiovascular disease and some cancers, with the result that health organizations generally recommend reducing the intake of saturated fatty acids in favor of more mono- and poly-unsaturated fatty acids (33).
For instance, the typical Western diet is overloaded with omega-6 fatty acids and contains insufficient omega-3 fatty acids. The ratio of omega-6 to omega-3 fatty acids is generally >10:1, whereas on a primitive human diet it was closer to 1:1 (33). This imbalance in dietary fatty acids is associated with many chronic diseases including cardiovascular diseases and some cancers (34).
INTRODUCTION
12
Figure 6. Metabolic pathways of omega-3, omega-6 and omega-9 fatty acids synthesis.
Polyunsaturated linoleic and α-linolenic acids are essential fatty acids. Omega-3 and omega-6 fatty acids are polyunsaturated whereas omega-9 oleic and elaidic acid are monounsaturated fatty acids. The desaturase enzymes allow the formation of double bond and the elongation process consists in adding carbon atoms. Through elaidinisation, oleic acid is converted to its trans isomer, elaidic acid. Adapted from Beaudoin et al. (35).
2.1. Omega – 3 fatty acids
Eicosapentaenoic acid (EPA) and docosahexaenoic acid (DHA), highly present in Western diet, are abundantly present in eggs, white meet such as chicken and turkey, and plant oils, flesh of fatty fish and oily fish. They are also available as supplements, such as fish oils (containing 30% - 50% of omega-3 fatty acids) or concentrated pharmaceutical preparations (34, 36). Both EPA and DHA are non-essential fatty acids since they are synthesized from alpha-linolenic acid, an essential fatty acid (Figure 6).
Omega-3 α-Linolenic acid (18:3 n-3) Octadecatetraenoic acid (18:4 n-3) Eicosatetraenoic acid (20:4 n-3) Eicosapentaenoic acid (20:5 n-3) Docosopentaenoic acid (22:5 n-3) Docosahexaenoic acid (22:6 n-3) Omega-6 Linoleic acid (18:2 n-6) γ-Linolenic acid (18:3 n-6) Di-homo-γ-Linolenic acid (20:3 n-6) Arachidonic acid (20:4 n-6) Δ-6 desaturase Elongation Δ-5 desaturase Elongation Δ-4 desaturase Stearic acid (18:0) Oleic acid (18:1 n-9) Elaidic acid (18:1 n-9) Elaidinisation Δ-9 desaturase Omega-9 Saturated fatty acid
INTRODUCTION
13 EPA and DHA consumption is associated with cardioprotective benefits due to their multiple physiological effects on lipids, blood pressure, vascular function, cardiac rhythms, platelet function and inflammatory responses (36-38). They also alter insulin sensitivity and decrease tumor growth and metastasis (37). In fact, as reviewed before, omega-3 fatty acids revealed several beneficial effects on cardiovascular system, through their involvement in various intracellular mechanism: regulation of Ca2+ channels, phospholipid degradation and eicosanoids production (39).
From a biochemical point of view, in omega-3 family the position of the first double-bond occurs between the third and the fourth carbon counting from the methyl end (omega end). DHA has twenty two carbon atoms and six cis double bonds (22:6 n-3) (Figure 7 B), whereas EPA has twenty carbon atoms and five cis double bonds (20:5 n-3) (Figure 7 A).
Figure 7. Chemical structure of the omega-3 fatty acids: A) eicosapentaenoic acid B) docosahexaenoic acid.
2.2. Omega – 6 fatty acids
Linoleic acid (LA) is the major omega-6 fatty acid found in Western diet. It is present in vegetable oils as soybean, safflower, and rapeseed oils, among others. LA is an essential fatty acid, mostly obtained from diet. Both γ-linolenic acid (γ-LIN) and arachidonic acid (AA) can be synthesized from LA and can be also found in Western diet, being present in meat, poultry and eggs.
The role of omega-6 fatty acids in cardiovascular disease prevention remains controversial. These fatty acids are implicated in a higher susceptibility for lipoproteins (low-density lipoproteins (LDL) and very low-(low-density lipoproteins (VLDL)) oxidation, a possible mechanism linking an enriched diet in omega-6 fatty acids and cardiovascular diseases (34). On the contrary, some authors have reported that the replacement of saturated fatty acids content with omega-6 fatty acids decrease plasma cholesterol levels and blood pressure and can reduce the risk for cardiovascular diseases (34, 40, 41). In spite of this controversy, one of the main concerns regarding the dietary intake of omega-6 fatty acids is their conversion
INTRODUCTION
14
into eicosanoids, a family of mediator molecules involved in immune and inflammatory responses. As a matter of fact, AA is a precursor of prostaglandin E2 (PGE2) and leukotrienes B4, which exert marked inflammatory effects. However, higher intakes of these fatty acids do not seem to be associated with elevated inflammatory markers levels (40). Nonetheless, the competition between omega-6 and omega-3 metabolism results in a reduced production of anti-inflammatory molecules from omega-3 polyunsaturated fatty acids. In fact, some researchers recommend reducing dietary omega-6 polyunsaturated fatty acids intake in order to prevent adverse effects on health, in particular pro-inflammatory responses (40).
Biochemically, omega-6 fatty acids have the first unsaturation between the sixth and the seventh carbon counting from the omega end. LA has two cis double bonds and eighteen carbon atoms (18:2 n-6) (Figure 8 A), γ-LIN has eighteen carbon atoms and three
cis double bonds (18:3 n-6) (Figure 8 B) and AA has twenty carbon atoms and four cis
double bonds (20:4 n-6) (Figure 8 C).
Figure 8. Chemical structure of the omega-6 fatty acids: A) linoleic acid, B) γ- linolenic acid and C) arachidonic acid.
2.3. Omega – 9 fatty acids
Oleic acid (OA), the major fatty acid present in olive oil, has been regarded as having protective effects against oxidative stress and immune and inflammatory responses (42).
Trans fatty acids have been shown to have a significant adverse influence on serum
lipids and lipoproteins levels and inflammation, increasing cardiovascular risk (43-45). Trans fatty acids gained popularity as a mean of replacing saturated fatty acids in diet, but now are
INTRODUCTION
15 believed to be nutritionally unnecessary. Trans fatty acids can be obtained from natural and artificial sources. In the rumens of ruminant animals, trans fatty acids are formed naturally by microflora (an isomerase converts the configuration cis into trans). Thus, dairy and meat products contain small amounts of these molecules (2-9% of total fat) (44). Artificial trans fatty acids are produced from partial hydrogenation of liquid vegetable oils and are present in a variety of products, such as modified vegetables oils, both sweet and salty snacks, sauces, instantaneous soups and fast foods (45).
Elaidic acid (EA) is the isomer with higher concentration in industrial sources of trans fatty acids, representing 80-90% of total trans fatty acids in foods (45).
Omega-9 fatty acids are monounsaturated with the double bond between the ninth and the tenth carbon counting from the methyl end. OA has one cis double bond and eighteen carbon atoms (18:1 n-9) (Figure 9 A), whereas EA has the same number of carbon atoms but a trans double bond (18:1 n-9) (Figure 9 B). The double bonds in trans fatty acids present a linear shape with the hydrogen atoms in opposite sides of the molecule, originating a more rigid configuration which requires a melting point around room temperature, highly desirable in food industry (46).
Figure 9. Chemical structure of the omega-9 fatty acids: A) oleic acid and B) elaidic acid.
2.4. Cellular uptake of fatty acids
A great amount of evidences suggest that long-chain fatty acids enter cells by a protein-mediated saturable uptake thought to contribute to the majority of cellular long-chain fatty acids capture (Figure 10). Several proteins have been implicated in cellular fatty acids uptake including: scavenger receptor CD36 (47); plasma membrane fatty acid binding protein (FABPpm); six fatty acid transport proteins (FATP); long-chain acyl-CoA synthetase
INTRODUCTION
16
(LACS) (48). The mechanisms implicated in the regulation of these transporters are currently under study.
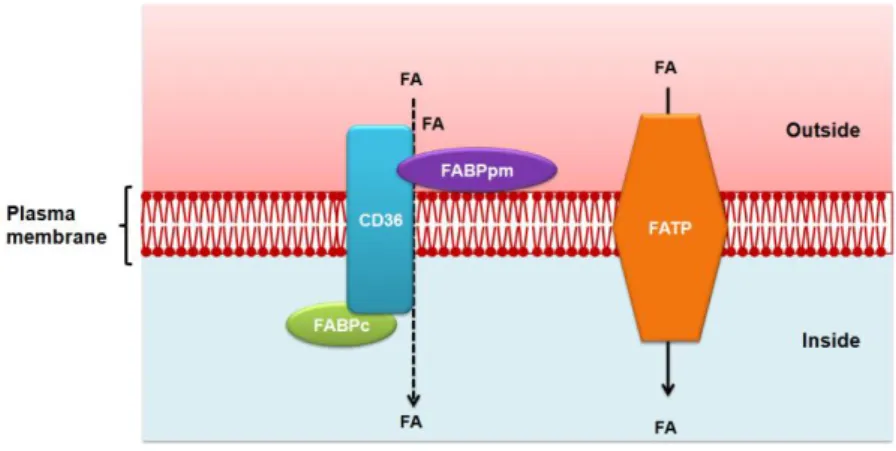
Figure 10. Fatty acid transport across the cell membrane.
CD36, alone or together with peripheral membrane protein accepts fatty acids at the cell surface to increase their local concentration and increase fatty acids diffusion. It is also possible that CD36 actively transports fatty acids across the membrane. Long-chain fatty acids are transported by fatty acid transport proteins. Once at the inner side of the membrane, fatty acids are bound by plasma membrane fatty acid binding protein. FATP: fatty acid transport proteins; FABPpm: plasma membrane fatty acid binding protein; FABPc: cytosolic fatty acid binding protein; FA: fatty acids.
3. Catecholamines and metabolic syndrome
In obesity and associated morbidities, the mechanisms underlying the parallel activation of the sympathetic nervous system and of adrenal medulla activity are complex and not clearly understood (49). However, evidence collected throughout the last two decades has unequivocally shown that major features of the metabolic syndrome (e.g. hypertension, visceral obesity and diabetes) are associated with markers of sympathetic overdrive (50-52). CA have many effects on glucose and lipid metabolism leading to impaired glucose tolerance and insulin resistance. Indeed, CA stimulate liver glycogenolysis and gluconeogenesis and inhibit insulin sensitivity and glucose uptake in the skeletal muscle. On the other hand, in humans, CA are responsible for the mobilization of lipids from adipose tissue. Indeed, lipolysis results from the balance between the lipolytic effect of β-adrenergic receptors and the antilipolytic effect of α2-adrenergic receptors (31). Fatty acids are important as metabolic substrates and as structural components of biological membranes. However, they also function as signaling molecules, regulating a large range of physiological responses (53). Fatty acids overload or dysfunction of their metabolism could contribute to development of obesity and/or type 2 diabetes in predisposed subjects. To date, although
INTRODUCTION
17 some studies (54, 55) reported that fatty acids can have profound effects on neurosecretion, very little is known about the effect of these molecules on CA handling by adrenal chromaffin cells. Interestingly enough, it has already been shown that some saturated fatty acids differently affect CA handling by adrenal chromaffin cells (56).
4. Aim
This work aimed to investigate the effect of several fatty acids on CA synthesis and secretion from chromaffin cells. For that purpose, the effect of chronic exposure to monounsaturated, polyunsaturated and trans fatty acids on the CA cellular content and release was investigated, using bovine adrenal chromaffin cells. The effect of these molecules on TH, the rate limiting enzyme of the CA synthesis, and on PNMT, the enzyme that converts NA to AD, expression was also evaluated.
Materials and Methods
MATERIALS AND METHODS
21
1. Preparation of adrenal medullary cells
Bovine adrenal glands were obtained from a local slaughterhouse and were processed for cell culture within 2 hours of slaughter, being transported to the laboratory in ice-cold Ca2+–Mg2+ -free Buffer A1 .The chromaffin cells were isolated by digestion with collagenase A as described by Livett et al. (57, 58) with some modifications.
Briefly, the adrenal glands were trimmed of fat and washed with Ca2+–Mg2+ -free Buffer A. The buffer was injected into the adrenal vein in order to wash the remaining blood from the gland. The adrenal glands were digested with a Ca2+–Mg2+-free Buffer A containing 0.25% collagenase A and 0.01% DNAse I. Five ml of this solution was injected into the adrenal vein of each gland. This procedure was repeated every 15 minutes with the glands incubated at 37 °C in Ca2+–Mg2+ -free Buffer A. After 45 minutes, the digested medullary tissue was mechanically separated from the adrenal cortex and incubated in Buffer A, containing collagenase A, for 30 minutes at 37 °C. Subsequently, cells were filtered through a 200 μm nylon mesh. Afterwards, filtered cells were centrifuged 3 × at 1000 g for 3 minutes and washed with Ca2+–Mg2+ -free Buffer A in order to remove the collagenase A/DNAse. At last, they were filtered through a 100 μm nylon mesh.
2. Cell culture
Bovine chromaffin cells were cultured in Dulbecco's Modified Eagle's medium (nutrient mixture F-12 Ham (1:1), supplemented with 10% fetal calf serum, 2 nM L-glutamine, 15 mM HEPES, 10 µM cytosine arabinoside, 100 units/ml penicillin, 100 mg/ml streptomycin and 0.25 µm/ml amphotericin B).
The dispersed cells were plated in collagen-coated 24-well plastic culture dishes (2 cm2; Æ 15.6 mm) at a density of 4-5 x 10⁵-106 cells/well and incubated at 37 °C in an atmosphere consisting of 5% CO2 in air and with 99% of relative humidity. The day of cell
preparation and cell seeding was described as day 0. Culture medium was replaced every 24 hours and, for the experiments, cells were used after 4 days in culture. 24 hours before experiment, culture medium was made free of fetal calf serum (59).
1
Ca2+–Mg2+
-free Buffer A:154 mM NaCl, 2.6 mM KCl, 0.85 mM KH2PO4, 2.15 mM K2HPO4, 10 mM glucose and 12.7 mM HEPES, pH 7.4
MATERIALS AND METHODS
22
3. In vitro experiments
3.1. Chronic treatment with fatty acids
After 4 days in culture, and before the studies on CA handling, cells were incubated for 24 hours (chronic exposure) with ethanol or DMSO (controls), linoleic acid (18:2n-6; 50-100 µM), γ-linolenic acid (18:3n-6; 50-50-100 µM), docosahexaenoic acid (22:6n-3; 50-50-100 µM), eicosapentaenoic acid (20:5n-3; 50-100 µM), arachidonic acid (20:4n-6; 50-100 µM), oleic acid (18:1n-9, cis; 100 µM) or oleic acid's trans isomer, elaidic acid (18:1n-9, trans; 50-100 µM). The tested concentrations of fatty acids (50-50-100 µM) are considered to be within the range of physiological concentrations (60). Fatty acids were dissolved with either ethanol or DMSO (0.1% (v/v)).
3.2. Studies on catecholamine handling
After the chronic treatment with the several fatty acids, cells were pre-incubated for 10 min, at 37 °C in order to study basal release. Initially, the culture medium was removed and cells were washed with medium at 37 °C. Afterwards, cells were incubated for 15 minutes in the absence (control) or presence of KCl (50mM). Incubation was stopped by rinsing the cells with ice-cold medium (4° C). At last, cells were solubilized with 0.3 ml 0.1% (v/v) Triton X-100 (in 5 mM Tris.HCl, pH 7.4) and placed at 37°C overnight.
4. Determination of catecholamines by high pressure liquid chromatography
with electrochemical detection
CA cellular content and release were determined by high pressure liquid chromatography with electrochemical detection (HPLC-ED) using the methodology described by Soares-da-Silva et al. (61).
The HPLC system consists in a pump (Gilson model 302; Gilson Medical Electronics, Villiers le Bel, France) connected to a manometer (Gilson model 802 C) and an ODS 5 µm steel column (Biophase; Bioanalytical Systems, West Lafayette, IN, USA), 25 cm long. The samples were injected by an automatic injector (Gilson model 321), connected to a Gilson diluter (model 401). The mobile phase consisted in a degassed solution of citric acid (0.1 mM), 1-octanesulfonic acid sodium salt (OSA) (0.5 mM), ethylenediaminetetraacetic acid
MATERIALS AND METHODS
23 (EDTA) (0.17 mM), dibutylamine (1mM), methanol (8% v/v) and was adjusted to pH 3.5 with perchloric acid, being pumped at a rate of 1 ml/min.
The CA detection was performed electrochemically with a carbon electrode, an electrode Ag/AgCl and an amperometric detector (Gilson model 141). The detector cell was
adjusted to 0.75 V.The originated current was monitored via software Gilson HPLC 172. The
lower limits of CA detection varied from 350 to 1000 fmol.
5. Determination of enzymatic expression by quantitative real-time PCR
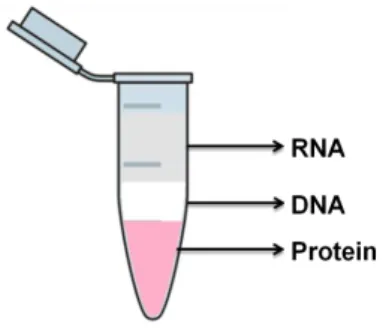
After a 24 hours treatment with the several fatty acids, total RNA was extracted from cells using the Tripure isolation reagent, according to manufacturer’s instructions. After removing the culture medium, Tripure was added and the lysate was transferred to an eppendorf tube. Three layers were obtained after the chloroform addition (Figure 11).
Figure 11.Layers obtained after centrifugation with chloroform in RNA extraction, by Tripure.
The first layer, corresponding to RNA, was isolated and treated with isopropanol for RNA precipitation and was washed with ethanol (75% ethanol in diethylpyrocarbonate (DEPC)). Afterwards, five micrograms of RNA were used as template for complementary DNA production through the incubation with SuperScript-II reverse transcriptase (200 U/µl) at 65 °C with 50 ng/µl random hexamers, 10 mmol/l per deoxyribonucleotide triphosphate, 40 U/µl RNase inhibitor. After, 5X First-Strand Buffer (250 mM Tris-HCl, pH 8.3 at room temperature; 375 mM KCl; 15 mM MgCl2), 0.1M DTT and RNaseOUT™(40 U/µl) were added
and incubated at 25° C during 2 minutes. Reverse Transcriptase SSII was included, incubating at 25° C during 10 minutes, followed by 50 minutes at 42° C and 70° C for 15 minutes. Samples were incubated with 1 µl RNAse H for 20 min at 37 °C.
With exception of AA treatment, after cDNA synthesis, TH and PNMT mRNA expression levels were analyzed by relative quantification using quantitative real-time PCR
MATERIALS AND METHODS
24
(qRT-PCR) with SYBR Green I detection. The qRT-PCR was performed in a StepOne™ qPCR machine (Applied Biossystems™) and glyceraldehyde-3-phosphate dehydrogenase (GAPDH) was used as endogenous control to normalize the results. The default thermocycler conditions have been used for all genes: 10 minutes of pre-incubation at 95° C followed by 40 cycles for 15 seconds at 95° C and one minute at 60° C. The quantification reactions were carried out in 20 µl volumes in a 48-well plate (Applied Biossystems™) containing 300 nM of forward and reverse primers, 1X FastStart universal SYBR green master (ROX) (Roche™) and aproximadely 21µl of cDNA. The data analysis was carried out using the StepOne™ Software version 2.2 (Applied Biossystems™) with the same baseline and threshold set for each plate, in order to generate threshold cycle (Ct) values for both genes in each sample.
In the case of AA, qRT-PCR was carried out using a LightCycler (Roche, Nutley, NJ, USA). Twenty microliter reactions were set up in microcapillary tubes using 0.5 µmol/L of each primer and 4 µl of SYBR Green master mix (LightCycler FastStart DNA MasterPlus SYBR Green I). Cycling conditions were as follows: denaturation (95°C for 5 min), amplification and quantification [95°C for 10 s, annealing temperature for 10 s, and 72°C for 10 s, with a single fluorescence measurement at the end of the 72°C for 10 s segment] repeated 55 times, a melting curve program [(annealing temperature +10)°C for 15 s and 95°C with a heating rate of 0.1°C/s and continuous fluorescence measurement], and a cooling step to 40°C for 30 s. Data were analyzed using LightCycler® 4.05 analysis software (Roche, Mannheim, Germany). The amount of mRNA of each studied gene was normalized to the amount of mRNA of the housekeeping gene (GAPDH).
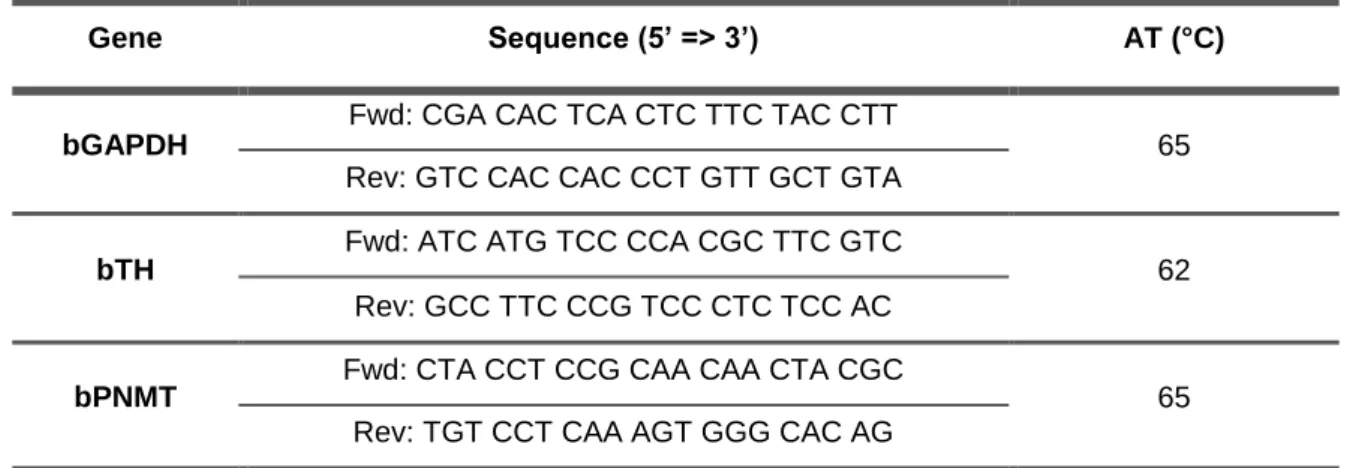
Table 2. Primer sequences and annealing temperature (AT) used for quantitative real-time PCR
Gene Sequence (5’ => 3’) AT (°C)
bGAPDH
Fwd: CGA CAC TCA CTC TTC TAC CTT
65 Rev: GTC CAC CAC CCT GTT GCT GTA
bTH
Fwd: ATC ATG TCC CCA CGC TTC GTC
62 Rev: GCC TTC CCG TCC CTC TCC AC
bPNMT Fwd: CTA CCT CCG CAA CAA CTA CGC 65 Rev: TGT CCT CAA AGT GGG CAC AG
bTH, bovine tyrosine hydroxylase; bPNMT, bovine phenylethanolamine N-methyltransferase; bGAPDH, bovine glyceraldehyde-3-phosphate dehydrogenase; Fwd, forward; Rev, reverse.
MATERIALS AND METHODS
25
6. Determination of cellular viability
The effect of chronic exposure to fatty acids on cell viability was assessed by MTT [3-(4,5-dimethylthiazol-2-yl)-2,5-diphenyl tetrazolium bromide] method. MTT method is based on the activity of a mitochondrial dehydrogenase which cleaves an yellow dye (MTT), forming purpur crystals of formazan, this reaction occuring only in viable cells. The amount of product formed was determined spectrophotometrically (62).
Initially, culture medium was removed and cells were incubated during 3 hours with MTT. After this time, extracellular medium was discharged and dimethyl sulfoxide (DMSO) added in order to solubilize formazan compounds. The absorbance was read at 540 nm, and the results were expressed as a percentage of control (62).
7. Determination of proteins
After solubilization of cells with 0.3 ml 0.1% (v/v) of Triton X-100 (in 5 mM Tris.HCl; pH 7.4), protein content was determined as described by Bradford (63), with human serum albumin as standard.
8. Calculations and statistics
The release of CA into the medium was calculated during periods A and B, corresponding to the first 10 min and to the following 15 min incubation periods, respectively. Release of CA from bovine adrenal chromaffin cells into the incubation medium during periods A or B was expressed as total, which corresponds to the amount of CA released into the medium in relation to the total cellular content of CA at the beginning of the release period. Basal release corresponds to release (expressed as % total) during period A. CA release, under different experimental conditions, is expressed as the percentage of basal release, or as the percentage of respective controls. Arithmetic means are given with SEM. For comparison between two groups, Student's t-test was used.
Regarding qRT-PCR, data analysis was carried out using the computer software SPSS for Windows (version 19). The relative expression was determined using the 2-ΔΔCt method (64), and expression values were normalized to GAPDH. The 2-ΔΔCt method, along with Student’s t-test or Mann-Whitney U test, were used in order to evaluate statistical
MATERIALS AND METHODS
26
differences in the normalized expression of the targets analyzed among the different experimental conditions tested.
The P value obtained was considered statistically significant under 0.05.
9. Materials
EPA (eicosapentaenoic acid), DHA (docosahexaenoic acid); LA (linoleic acid); Υ-LIN (Υ linolenic acid); AA (arachidonic acid); OA (oleic acid); EA (elaidic acid), MTT (Methylthiazolyldiphenyl-tetrazolium bromide), Dulbecco's Modified Eagle's medium/F12, OSA, Tris (tris-(hydroxymethyl)-aminomethane hydrochloride), fetal calf serum, L-glutamine, HEPES, cytosine arabinoside, penicillin, streptomycin, amphotericin B, inhibitor of RNAses, pargyline, perchloric acid, collagenase A, ascorbic acid (Sigma, St. Louis, MO, USA); Albumin, EDTA, Titron X-100, methanol, citric acid, D (+) glucose (Merck, Darmstadt, Germany); SuperScript™ II Reverse Transcriptase, RNAse H, GAPDH, SYBR Green I detection, chloroform (Invitrogen, Life Technologies, USA); Tripure isolation reagent (Roche Diagnostics, Germany).
Results
RESULTS
29 In order to assess whether unsaturated fatty acids alter CA handling by bovine chromaffin cells, these cells were maintained in culture for four days and then submitted to mono- , trans- and polyunsaturated fatty acids exposure for 24 hours. After these treatments, the following parameters were evaluated: CA total and cellular content, basal and KCl-stimulated release and mRNA levels of TH and PNMT.
Under control conditions, the average cellular content at the end of the experiments was found to be 604 33 and 228 21 nmol/mg protein for AD and NA, respectively. Basal release (expressed as % of the total amine content), during 10 minutes of pre-incubation, was 15 1 % and 14.5 1 % for AD and NA, respectively. The release of AD and NA was increased by excess KCl respectively to about 331 25 % and 295 36 % of control. MTT assays showed that chronic treatment with the several fatty acids at 50 and 100 µM did not interfere with cellular viability.
1. Catecholamine total content
Regarding the CA total content (including cellular content plus release), representing the total production of CA, we observed that EA, γ-LIN and LA, at the same concentration (100 µM), significantly decreased the content of AD and did not affect NA levels. The AD total content achieved after EA, γ-LIN and LA treatments (n=4-8) was respectively 725 84 nmol/mg protein, 427 57 nmol/mg protein and 127 18 nmol/mg protein.
Figure 12. Catecholamine total content in bovine chromaffin cells after chronic treatment (24 hours) with eicosapentaenoic acid
(A) (n=15–16), docosahexaenoic acid (B) (n=13–16), oleic acid (C) (n=7–8) and elaidic acid (D) (n=7–8), at 50 µM and 100 µM. After this treatment, cells were pre-incubated for 10 min and incubated during 15 min under different experimental conditions. EPA: eicosapentaenoic acid; DHA: docosahexaenoic acid; OA: oleic acid; EA: elaidic acid; AD: adrenaline; NA: noradrenaline; CA: catecholamines. Results are presented as arithmetic means ± SEM. * P < 0.05, compared with control.
RESULTS
30
LA was the most potent fatty acid in this effect: 127 18 nmol/mg protein (n=4) vs 560 132 nmol/mg protein (n=12) in control conditions. (Figure 12 D and Figure 13 A, B). DHA (Figure 12 B) and AA (Figure 13 C), in both concentrations, were able to significantly decrease AD and NA total content. On the contrary, Figure 12 (A and C), shows that neither EPA nor OA significantly affected total content of CA.
Figure 13. Catecholamine total content in bovine chromaffin cells after chronic treatment (24 hours) with Υ-linolenic acid (A) (n=4–8), linoleic acid (B) (n=8–12) and arachidonic acid (C) (n=10–20), at 50 µM and 100 µM. After this treatment, cells were pre-incubated for 10 min and incubated during 15 min under different experimental conditions. Υ-LIN: Υ-linolenic acid; LA: linoleic acid; AA: arachidonic acid; AD: adrenaline; NA: noradrenaline; CA: catecholamines. Results are presented as arithmetic means ± SEM. * P < 0.05, compared with control.
2. Catecholamine cellular content
In good agreement with what was observed for CA total content, EA and LA, at both concentrations, diminished the cellular content of AD and did not affect NA. For both fatty acids, this reduction was concentration dependent. When the higher concentration of EA and LA was used, AD cellular content was greatly reduced respectively to about 51% and 14%, in comparison with controls (Figure 14 D and F). γ-LIN was also able to promote a decrease of AD cellular content, but only at a concentration of 100 µM (Figure 14 E). AA was the only fatty acid that affected the cellular content of both CA, leading to a decrease of their content (Figure 14 G). The highest reduction in AD and NA cellular contents, respectively to 28% and 22% of control, was achieved with the lower concentration (50 µM) of this fatty acid. On the other hand, EPA, DHA and OA, did not significantly modify CA cellular content (Figure 14 A, B and C).
RESULTS
31
Figure 14 Catecholamine cellular content in bovine chromaffin cells after chronic treatment (24 hours) witheicosapentaenoic acid (A) (n=15–16), docosahexaenoic acid (B) (n=13–16), oleic acid (C) (n=7–8), elaidic acid (D), (n=7–8) Υ-linolenic acid (E) (n=4–8), linoleic acid (F) (n=8–12) and arachidonic acid (G) (n=10–20), at 50 µM and 100 µM. After this treatment, cells were pre-incubated for 10 min and incubated during 15 min under different experimental conditions. EPA: eicosapentaenoic acid; DHA: docosahexaenoic acid; OA: oleic acid; EA: elaidic acid; γ-LIN: γ-linolenic acid; LA: linoleic acid; AA: arachidonic acid; AD: adrenaline; NA: noradrenaline; CA: catecholamines. Results are presented as arithmetic means ± SEM. * P < 0.05, compared with control.
RESULTS
32
3. Catecholamine basal release
In relation to basal release, AA and EA did not differentiate between AD or NA, but had opposite effects over both amines: AA significantly augmented their basal release in the same degree (to about 171% and 173%, respectively for AD and NA) (Figure 16 C), whereas EA inhibited the release of these amines (by about 28% and 51%, respectively for AD and NA) (Figure 15 D).
The chronic exposure to EPA and DHA lead to a significant reduction of NA basal release, respectively to about a maximum of 72% and 62% of control (n=13-15) (Figure 15, respectively A and B), but had no effect over AD. Contrary to the above fatty acids, γ-LIN, at the lowest concentration used, was able to selectively decrease the release of AD to about 71% of control (n=8) (Figure 16 A). On the other hand, as can be seen respectively in Figures 16 B and 15 C, LA and OA did not change the basal release of both CA.
Figure 15. Catecholamine basal release in bovine chromaffin cells after chronic treatment (24 hours) with eicosapentaenoic
acid (A) (n=15–16), docosahexaenoic acid (B) (n=13–16), oleic acid (C) (n=7–8) and elaidic acid (D) (n=7–8), at 50 µM and 100 µM. After this treatment, cells were pre-incubated for 10 min and incubated during 15 min under different experimental conditions. EPA: eicosapentaenoic acid; DHA: docosahexaenoic acid; OA: oleic acid; EA: elaidic acid; AD: adrenaline; NA: noradrenaline; CA: catecholamines. Results are presented as arithmetic means ± SEM. * P < 0.05, ** P = 0.072, compared with control.