Research Work
Effect of Low Glycemic Index Diets (with Canola Oil) on Glucose Control, Blood Lipids and Body Weight Measures in Non-Insulin Dependent Diabetics
Efeito de dietas de baixo índice glicémico (com Óleo de Colza) no controlo glicémico em diabéticos tipo 2
Author: Júlio Medeiros Rego
Coordinator: Teresa Maria de Serpa Pinto Freitas do Amaral (PhD) Co-coordinator: Cyril W. Kendall (PhD)
1.º Ciclo em Ciências da Nutrição
Faculdade de Ciências da Nutrição e Alimentação da Universidade do Porto Risk Factor Modification Center, St Michael’s Hospital, 2012
BMI- Body Mass Index.
CHD- Coronary Heart disease.
CRP- C-Reactive Protein.
CVD- Cardiovascular Disease. HbA1c- Glycated Hemoglobulin. HDL- High Density Lipoprotein. HWF diet- High Wheat Fiber diet. LDL- Low Density Lipoprotein.
LGI diet- Low Glycemic Index diet with canola bread. MUFA- Mono Unsaturated Fatty Acids.
Net Carbs- Digestible carbohydrates. PhD- Doctoral degree.
PUFA- Poly Unsaturated Fatty Acids. SD- Standard Deviation.
Abstract in English
Introduction: Studies show that low glycemic index diets decreases the incidence
of type 2 diabetes and mono unsaturated fatty acids benefits glycemic control and cardiovascular heath, but more evidence is needed to consolidate those findings.
Objective: To assess the effects of low glycemic diets with canola oil on glycemic
control, blood lipids and body weight measures on patients with type 2 diabetes.
Design, Setting and Participants: A clinical trial performed at a Canadian
research center of 61 participants with type 2 diabetes on antihyperglycemic medications. The participants were randomly assigned to the low glycemic index diet with canola oil (LGI diet) group or high wheat fiber diet (HWF diet) group for 3 months between March 2011 and March 2012.
Intervention: Low glycemic index diet with canola oil or high wheat fiber diet
dietary advice.
Results: The cholesterol decreased 0.32mmol/L on LGI diet and increased
0.08mmol/L on HWF diet, with a significant difference between treatments (p=0.003), the low density lipoprotein (LDL) decreased 0.26mmol/L on LGI diet and increased 0.09mmol/L on HWF diet, with a significant difference between treatments (p=0.003). The reduction in the dietary glycemic index was associated with an HbA1c’s decrease only for participants on LGI diet (p=0.01).
Conclusion: Compared with the HWF diet, the LGI is more effective effect on
Abstract in Portuguese
Introdução: Estudos mostram que dietas de baixo índice glicémico reduzem a
incidência de diabetes tipo 2 e os ácidos gordos mono insaturados beneficiam o controlo glicémico e a saúde cardiovascular, mas são necessárias mais evidências para consolidar estes achados.
Objetivo: Avaliar os efeitos de dietas de baixo índice glicémico com óleo de colza
no controlo glicémico, lípidos do sangue e medidas do peso corporal em pacientes com diabetes tipo 2.
Desenho, Local, Participantes: Ensaio clínico que ocorreu num centro de
investigação canadiano com 61 participantes com diabetes tipo 2 a tomar medicamentos antihiperglicimiantes. Entre Março de 2011 e de 2012 os participantes foram aleatoriamente distribuídos pelo grupo da dieta de baixo índice glicémico com óleo de colza ou pelo grupo da dieta rica em fibra por 3 meses.
Intervenção: Aconselhamento nutricional sobre a dieta de baixo índice glicémico
com óleo de colza ou a dieta rica em fibra.
Resultados: O colesterol decresceu 0.32mmol/L na dieta LGI e aumentou
0.008mmol/L na dieta HWF, com uma diferença significativa entre tratamentos (p=0.003). A lipoproteína de baixa densidade (LDL) decresceu 0.26mmol/L na dieta LGI e aumentou na dieta HWF, com uma diferença significativa entre tratamentos (p=0.003). A redução do índice glicémico da dieta foi associada com a redução da HbA1c somente nos participantes da dieta LGI (p=0.01).
Conclusão: Comparado com a dieta HWF, a dieta LGI é mais eficiente na
Key-words in English
Glycemic index, Canola oil, Type 2 diabetes, Dietary advice.
Key-words in Portuguese
Índice Glicémico, Óleo de Colza, Diabetes tipo 2, Aconselhamento nutricional.
Index
Abstract in English and Portuguese ... ii
Key-words in English and Portuguese ... ii
Introduction ... 1
Aims ... 3
Material (or Population) and Methods ... 3
Results... 6
Discussion and Conclusions ... 13
Acknowledgementes ... 13
References ... 17
Anex ... 19
Introduction
Diabetes is a chronic disease of the metabolism affecting 366 million people worldwide in 2011, of which 90% suffered from diabetes type 2 and in 2010,
Portugal spent 1850 million euros for 991 000 people with diabetes(1). Therefore
diabetes is a huge health problem that has a large impact on the health care
economy of many countries and there is a need for implementing good nutritional
strategies to prevent new cases and to improve the management of diabetes with
the aim of preventing the long term complications(2).
Diabetes is a risk factor for cardiovascular disease (CVD) due to the damage provoked by high blood glucose, to the heart and blood vessels, increasing the odds of myocardial infarction, stroke and kidney failure. CVD is the major cause of death in people with diabetes. The abnormal high blood glucose level can also damage the nerves, making the patient loose sensibility, develop ulcerations, potentially leading to amputation of lower limbs. The eyes can suffer damages because of diabetes, high levels of blood glucose damages the retina of
the eye and can lead to vision loss(3).
Nutrition therapy can improve glycemic control with reductions of HbA1c
(Glycated Hemoglobulin) of 1-2%(4, 5), but in this study the aim is to assess the
effects of a particular type of diet, the low glycemic index diet .There is a paucity
of studies about this type of diet and its benefits on type 2 diabetes are not completely accepted by the scientific community due to some studies that do not
show an evident benefit from low glycemic index diets(6, 7), being important to
conduct more studies about it in order to support or deny positive effects of the low glycemic diet in type 2 diabetic people.
Therefore the aim is to assess the effects of canola oil as a part of a low glycemic index diet (LGI diet) on glycemic control, weight measurement and blood lipids in type 2 diabetic people controlled by oral medications and with HbA1c levels between 6.5% and 8.5%.
The glycemic index is an indexing of carbohydrates containing foods. It is calculated as the glycemic response of a fixed amount, 50g of available carbohydrate from a test food in comparison with the response from the same amount of available carbohydrate from a standard food that can be white bread or
a glucose solution(8, 9). A low glycemic index diet is characterized by slowly
absorbed carbohydrates, which result in lower blood glucose rises(8).
Studies show that low glycemic index diets are associated with a decreased incidence of type 2 diabetes, improvements of glycemic control, for example the
reduction of HbA1c levels(10, 11) and a growing evidence of an association with the
reduction of cardiovascular disease risk factors, not only diabetes(12) and weight
(13-15)
, but serum lipids levels improvement(8).
The canola oil has been the target of many controversies and there is a dearth of studies concerning its effects on health. Canola oil is a rich source of monounsaturated fatty acids (MUFA), which is associated with a positive impact on diabetes and heart health by lowering fasting glucose and increasing fasting
pro-insulin and HDL(15-18).
The test diet has a special component, canola oil bread to assess the effects of canola oil on glycemic control and CVD risk factors.
The control diet selected was the HWF diet (High Wheat Fiber), which is also associated with health benefits. A high consumption of fiber improves plasma lipid profiles, which can have a protective effect against heart disease and stroke
and has a protective effect against insulin resistance, obesity and colon cancer(19,
20)
.
Aims
The aim of this study was to test the effects of the consumption of canola oil, as part of a low glycemic diet, on glycemic control in type 2 diabetes by assessing the HbA1c and the blood glucose and on CVD risk factors like blood lipids and blood pressure.
The specific aim was to assess the effects of this diet on glycemic control, blood lipids, weight control and waist circumference measurement.
Methods Participants
To participate in the study, the subjects had to be otherwise healthy men or women, with type 2 diabetes for at least 6 months, have HbA1c between 6.5 and 8.5% at recruitment and at the visit prior to randomization and had to be taking blood glucose lowering medications. Also subjects had to have a family doctor in Ontario.
Participants were recruited from advertisements that were posted in a local newspaper and in the subway and asked to respond to a questionnaire by telephone in order to check their eligibility and out of 1182 responses, 755 participants were considered potentially eligible.
All potentially eligible participants identified by telephone questionnaire were invited to attend an information session at the Risk Factor Modification Center, St Michael’s Hospital, Toronto, Ontario, Canada, where all clinical activity during the study took place. Four hundred and twenty seven attended the
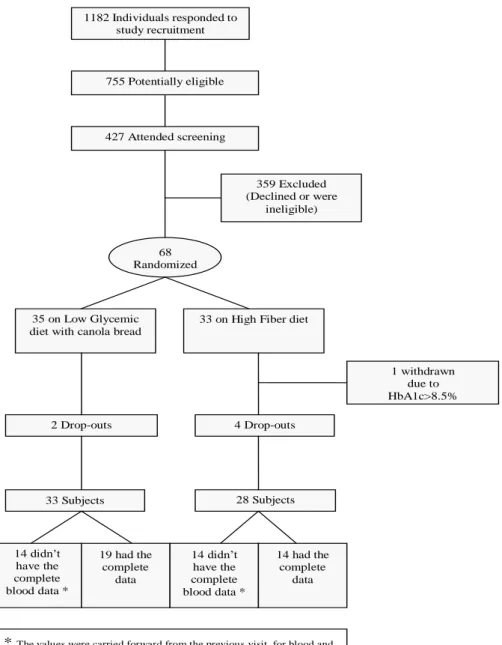
screening visit and 359 participants were excluded due to declining or ineligibility after blood tests, leaving this study with a number of 68 participants to be randomized (Figure 1). The recruitment started on March 2011 and is ongoing. For the purpose of the present study, the data included was up to the end of March 2012.
Figure 1. Flow of Participants
1182 Individuals responded to study recruitment advertisements 755 Potentially eligible 427 Attended screening 359 Excluded (Declined or were ineligible) 68 Randomized 35 on Low Glycemic diet with canola bread
33 on High Fiber diet
2 Drop-outs 4 Drop-outs 33 Subjects 28 Subjects 14 didn’t have the complete blood data * 19 had the complete data 14 didn’t have the complete blood data * 14 had the complete data
* The values were carried forward from the previous visit, for blood and anthropometric data.
1 withdrawn due to HbA1c>8.5%
The participants were randomized in one of the two diets, 35 in the LGI diet (test diet) and 33 for HWF diet (control diet). In the control diet one subject was excluded from the sample due to HbA1c >8.5% during the study, for the purpose of analysis 2 participants LGI diet and 4 on HWF diet were excluded, because they dropped out on week 0.
Protocol
This study was a randomized, parallel study with 2 treatments, a low glycemic index diet with canola bread and a HWF diet of 3 months duration. The participants came first to the screening visit, fasting, to give a blood sample, be weighed, to get blood pressure and hip and waist circumference measure, to give the signed forms that were provided during the information session and to answer questions about their medical history. Then subjects were informed of their eligibility by telephone calls and those who were eligible attended the pre study visit (week -2), at this visit the participants did all the measurements again and gave a blood sample. They also received more information about the diets and received a 7 day food record, a scale to weigh the food that they consumed and some advice on how to fill out the record.
During the study if any subject showed an HbA1c increased to more than 8.5% on 2 successive occasions, or if blood glucose was below 3.6mmol/L and this was not explained by a missed meal or vigorous physical activity, then the patient would be referred to his/her doctor for a reduction in diabetic medication.
At week 0 they were randomized to one of the two diets, obtained the same measures as in the previous visits, gave their completed food record, received the bread for their diet and started following the dietary advice. After this visit subjects
came for further five clinic visits (2, 4, 8, 10 and 12) to do the same as in week 0, except in week 2, on which participants did not give a blood sample. Participants were also asked to give a 24h urine sample at weeks 0 and 12 and received dietary advice during all their visits.
Dietary Interventions
The participants were provided with a checklist with either LGI or HWF food options and with a list of food that they should avoid.
In the LGI diet, the dietitians emphasized the consumption of the bread enriched with canola oil provided by the study, breakfast cereals (Red River Cereal (hot cereal made of bulgur and flax), oatmeal (large flakes), oat bran and All Bran Buds with psyllium), pulses, pasta, parboiled rice, sweet potato, bulgur, barley, 3 servings of fruits (berries, orange and apple), 5 or more servings of vegetables (excluding potato), 2-3 servings of low fat dairy products and 2 servings of meat/fish or alternatives.
In the HWF diet, the participants were provided with whole wheat bread, they were advised to choose breakfast cereals rich in fiber (Fibre 1 Crunchy Original, Bran flakes, Shredded Wheat etc.), brown rice, whole wheat couscous instead of parboiled rice or pasta and to avoid pulses and the fruits of the other diet. Also in both diets they were advised to avoid nuts and other foods rich in monounsaturated fat as well as food rich in fat and/or sugar.
The checklists provided to participants were completed every day until the end of their participation in the study. This information was useful to assess adherence to the diet. Also 7-day diet records were completed before each visit.
Statistical analyses
In order to achieve the results the calculations made were means, standard deviations (SD), standard errors (SE) and the difference within treatment by calculating the p-value for one tailed tests and between treatments by calculating the p-value for two tailed tests for dietary, blood and anthropometric variables, as well as the significance of the difference by Student t test. A p value below 0.05 was considered statistical significant. Was also calculated r (correlation factor) between several items, using Microsoft Office Excel 2003 and their respective
p-value through a website(21).
The values from week 0 were used as baseline and the mean between the week 8, 10 and 12 was used as the end value, for 28 participants who did not complete the study, their last values were carried forward. The data analyses were made by using Microsoft Office Excel 2003.
Results
In the LGI diet there were 33 participants, 57.6% were man, with an
average age of 60 years (SD=8 years) and a BMI of 30kg/m2 (SD=5). In the HWF
diet group, 53.6% were men, with an average age of 60 years old (SD=11 years) and their average BMI was of 29 (SD=5). On both groups most participants had a European background, 39.4% in the LGI diet and 42.9% in the HWF diet and similar diabetes duration, 9 years with a SD of 7 years in the LGI diet and 8 years with a SD of 6 years in the HWF diet (Table 1).
There were differences on some variables between treatments at baseline; fasting glucose, HbA1c, lipid levels and the average weight of the participants
were relatively higher on subjects randomized to the LGI diet, but the differences were only significant for HbA1c (Table 1).
Table 1. Baseline Characteristics of Study Participants
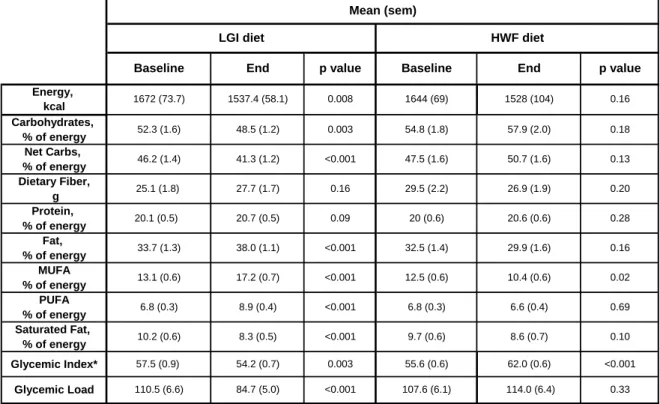
Also there were some differences at baseline between treatments for the nutritional profile, but none of those differences reached statistical significance (Table 2).
At the end of the study there were significant differences between treatments with p<0.001. It occurred on the percentage of carbohydrates and net carbs (digestible
LGI diet HF diet
(n=33) (n=28) Age, mean (SD), y Sex Male 19 (57.6) 15 (53.6) Female 14 (42.4) 13 (46.4) Ethnicity African 3 (9.1) 1 (3.57) European 13 (39.4) 12 (42.86) Far Eastern 4 (12.1) 4 (14.28) Hispanic 0 (0) 1 (3.57) Indian/South Asian 7 (21.2) 5 (17.86) Other white/Caucasian 3 (9.1) 5 (17.86) Other 3 (9.1) 0 (0) Weight, mean (SD), kg BMI, mean (SD) Glucose, mmol/L HbA1c, mean (SD), % Lipids, mean (SD), mmol/L Cholesterol 4.30(1.27) 4.01(1.01) 0.33 LDL 2.41(0.97) 2.18(0.77) 0.32 HDL 1.26(0.34) 1.19(0.27) 0.44 Triglycerides 1.40(0.77) 1.40(0.71) 0.97 Total cholesterol/HDL 3.50(0.82) 3.47(1.00) 0.91 Duration of diabetes, mean (SD), y 0.99 0.76 9(7) p value 0.24 0.95 0.20 0.04 7.44(0.63) 7.11(0.59) 8(6)
To convert HDL and LDL to mg/dL, divide by 0.0259; Triglycerides, divide by 0.0113; Fasting glucose, divide by 0.0555. BMI- Body Mass Index; HbA1c- Glycated Hemoglobin A1c; LDL- Low Density Lipoprotein; HDL- High Density Lipoprotein. Characteristics 7.8 (1.62) 7.3 (1.2) 85 (20) 79 (14) 30 (5) 29 (5) Number (%) of participants 60 (8) 60 (11)
carbohydrates) consumed by participants, which was higher on HWF diet than on LGI diet and also on glycemic index and glycemic load of the diet that were higher on HWF diet than on LGI diet. The opposite occurred for the percentage of fat, MUFA and PUFA that were higher on LGI diet and the differences were also significant with p<0.001 (Table 2).
Concerning the significance of the difference between the two treatments, the difference of the carbohydrates’ percentage reached significance (p=0.006), also the difference of fat’s percentage was significant (p=0.001) and the differences of the percentages of net carbs, MUFA, and PUFA were significant with a p<0.001, as well as the difference between glycemic index and glycemic load (Table 2).
Table 2. Nutritional Intake on HWF and LGI diet (n=61), Comparison
Between The Two Treatments.
Between baseline and end, on LGI diet there was a significant decrease on energy consumption (p=0.008), percentage of carbohydrates (p=0.003),
Energy, kcal Carbohydrates, % of energy Net Carbs, % of energy Dietary Fiber, g Protein, % of energy Fat, % of energy MUFA % of energy PUFA % of energy Saturated Fat, % of energy Mean (sem) <0.001 0.24 p-value** 0.83 0.006 <0.001 10.4 (0.6) <0.001 <0.001 0.05 0.95 0.001 <0.001 54.2 (0.7) 6.6 (0.4) 8.6 (0.7) End HWF diet LGI diet
1528 (104) 1537.4 (58.1) 57.9 (2.0)
29.9 (1.6)
84.7 (5.0) * Glucose based. **between treatments (end-baseline). sem- standard error mean
0.75 114.0 (6.4) <0.001 26.9 (1.9) 27.7 (1.7) 48.5 (1.2) p value 0.94 <0.001 20.6 (0.6) 47.5 (1.6) 50.7 (1.6) O.12 46.2 (1.4) 0.56 32.5 (1.4) 33.7 (1.3) 0.53 0.95 20 (0.6) 6.8 (0.3) 6.8 (0.3) 29.5 (2.2) 25.1 (1.8) Glycemic Index* 55.6 (0.6) 57.5 (0.9) Glycemic Load 107.6 (6.1) 110.5 (6.6) p value 54.8 (1.8) 52.3 (1.6) 9.7 (0.6) 10.2 (0.6) 20.1 (0.5) 12.5 (0.6) 13.1 (0.6) 0.49 0.92 0.71 <0.001 <0.001 Baseline 0.78 0.31 1644 (69) 1672 (74)
HWF diet LGI diet
<0.001 0.75 0.91 <0.001 <0.001 41.3 (1.2) 20.7 (0.5) 38.0 (1.1) 17.2 (0.7) 8.9 (0.4) 8.3 (0.5) 0.51 0.08 62.0 (0.6)
percentage of net carbs (p<0.001) and saturated fat with a p<0.001, also the glycemic index and the glycemic load of the diet decreased with significance, the first one with a p=0.003 and the other with a p<0.001. Still on the test diet, there was an increase in dietary fiber consumption although it was not significant and on the percentage of fat consumed (p=0.001), MUFA and PUFA with a p<0.001 (Table 3).
Table 3- Nutritional Intake in HWF and LGI diet (n=61), Comparison Within
Treatments.
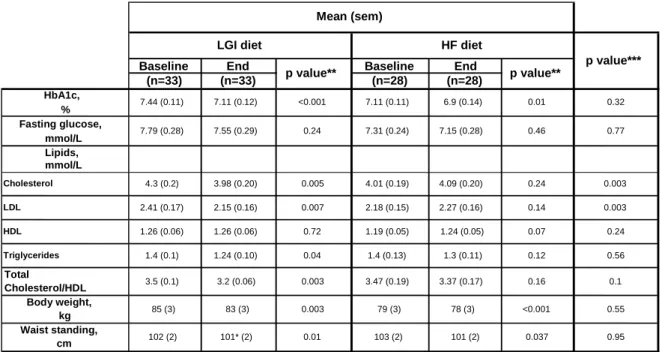
According to the Figure 2, the HbA1c decreased on both treatments.
It decreased 0.33% on LGI diet (p=0.0004) and 0.11% on HWF diet (p=0.0097),
but the difference was not significant between treatments (p=0.324) (Table 3). On
average, the participants experienced a decrease of 0.24mmol on blood glucose/L on LGI diet and of 0.16mmol/L on HWF diet (Figure 2), but the differences within
Energy, kcal Carbohydrates, % of energy Net Carbs, % of energy Dietary Fiber, g Protein, % of energy Fat, % of energy MUFA % of energy PUFA % of energy Saturated Fat, % of energy * Glucose based. Mean (sem) 54.8 (1.8) 55.6 (0.6) 6.8 (0.3) 9.7 (0.6) 10.2 (0.6) <0.001 57.5 (0.9) 0.003 32.5 (1.4) 12.5 (0.6) 47.5 (1.6) 114.0 (6.4) 62.0 (0.6) 20.6 (0.6) 107.6 (6.1) 0.33 End 1537.4 (58.1) 48.5 (1.2) 41.3 (1.2) 27.7 (1.7) 20.7 (0.5) 8.6 (0.7) 1644 (69) 0.10 <0.001 10.4 (0.6) 0.02 6.6 (0.4) 0.69 1528 (104) 0.16 57.9 (2.0) 0.18 6.8 (0.3) 50.7 (1.6) 0.13 26.9 (1.9) 0.20 0.28 29.9 (1.6) 0.16 29.5 (2.2) 20 (0.6) <0.001 84.7 (5.0) 8.3 (0.5) 54.2 (0.7) HWF diet End p value Baseline 20.1 (0.5) 110.5 (6.6) 33.7 (1.3) 38.0 (1.1) <0.001 13.1 (0.6) <0.001 <0.001 0.09 17.2 (0.7) 8.9 (0.4) LGI diet Baseline p value 1672 (73.7) Glycemic Index* Glycemic Load 0.008 52.3 (1.6) 0.003 46.2 (1.4) <0.001 25.1 (1.8) 0.16
LGI diet (p=0.24) and HF diet (p=0.46) and between treatments (p=0.77) were not significant (Table 3).
In terms of lipids, participants on LGI diet experienced a significant drop of 0.32mmol/L on cholesterol (p=0.005), contrasting with the participants on HWF diet who experienced a rise of 0.008mmol/L, that did not reach significance (p=0.24) (Table 3). The difference between treatments was significant (p=0.003). About LDL the same happened, on LGI diet there was a significant decrease, but this time of 0.26mmol/L (p=0.007) and on HWF diet there was a rise, in this case of 0.009mmol/L (p=0.141) and the difference between treatment was also significant (p=0.003) (Figure 2 and Table 3). On HDL, both diets led to its increase between week 0 and week 12 (Figure 2). But on LGI diet there was not any change in the level of HDL (1.26mmol/L) between baseline and end with a p value of 0.72, on HWF diet that was a rise of 0.05mmol/L (p=0.065) and the difference between treatments was not significant (p=0.24) (Table 3).
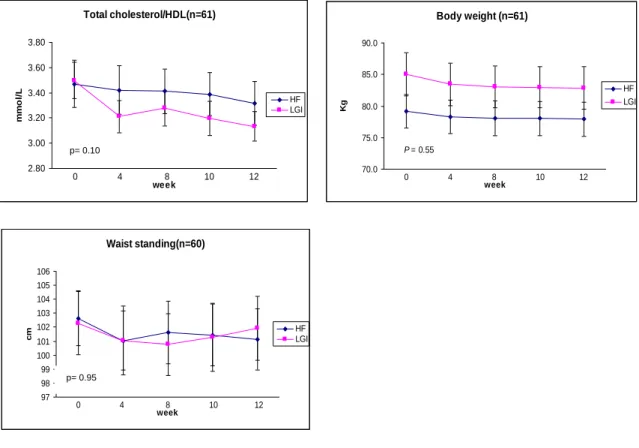
There was a decrease of triglycerides in both arms (Figure 2), participants on LGI diet showed a significant decrease of 0.16mmol/L (p=0.04) and on HWF diet, participants achieved a decrease of 0.09mmol/L (p=0.12), but without difference between treatments (Table 3). Total cholesterol/ HDL decreased significantly 0.3mmol/L on LGI diet (p=0.003) and decreased without significance 0.1mmol/L on HWF diet (p=0.164), the difference between treatments was not significant (0.10) (Table 3).
Concerning weight, participants experienced a loss (Figure 2) with significant difference within each diet, on LGI diet the participants lost 2kg (p=0.009) and on HWF diet they experienced a smaller drop of 1kg (p=0.00004), but the difference between treatments (p=0.29) was not significant (Table 3).
There was a significant drop on waist circumference on both diets, on LGI diet the average drop was of 1cm (p= 0.013) and on HF diet the average drop was of 2cm (p=0.032). Between treatments the difference did not reach significance (p=0.995) (Table 3).
Table 4. Mean Study Measurements and Significance of Differences within
and Between Treatments (n=61)
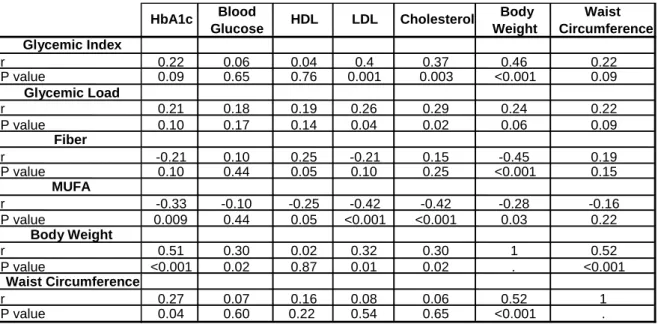
Concerning the correlations, the data shows that the increase of the glycemic index of the diet increased the HDL (p=0.001), the cholesterol (p=0.003) and the body weight (p<0.001). In terms of its effects on HbA1c no relation was found using the data from both treatments in the correlation, but using only the values from the LGI diet the positive correlation reached significance (Fig.3). The results showed that an increase on the glycemic load of the diet provokes a rise on LDL (p=0.04) and cholesterol (p=0.02) concentrations.
Baseline End Baseline End
(n=33) (n=33) (n=28) (n=28) HbA1c, % Fasting glucose, mmol/L Lipids, mmol/L Total Cholesterol/HDL Body weight, kg Waist standing, cm
To convert HDL and LDL to mg/dL, divide by 0.0259; Triglycerides, divide by 0.0113; Fasting glucose, divide by 0.0555.
78 (3) <0.001 0.55
p value*** HF diet
3.37 (0.17) 0.16
85 (3) 83 (3) 0.003 79 (3)
* n=32 ** within treatment *** between treatment
Mean (sem) 7.11 (0.11) 6.9 (0.14) 0.01 0.037 7.44 (0.11) 7.11 (0.12) <0.001 102 (2) 101* (2) 0.32 0.1 7.79 (0.28) 7.55 (0.29) 0.24 7.31 (0.24) 7.15 (0.28) 0.46 0.77 0.95 103 (2) 101 (2) 0.01 p value** p value** LGI diet HDL Cholesterol 4.3 (0.2) 3.98 (0.20) 4.01 (0.19) 4.09 (0.20) 0.24 3.5 (0.1) 3.2 (0.06) 0.003 3.47 (0.19) 0.003 LDL 2.41 (0.17) 2.15 (0.16) 0.007 2.18 (0.15) 2.27 (0.16) 0.14 0.003 0.005 1.26 (0.06) 1.26 (0.06) 0.72 1.19 (0.05) Triglycerides 1.4 (0.1) 1.24 (0.10) 0.04 1.4 (0.13) 0.56 1.24 (0.05) 0.07 0.24 1.3 (0.11) 0.12
High fiber consumption was associated with a greater decrease on weight (p<0.001). An increase on the consumption of MUFA contributed for the decrease of the HbA1c (p=0.009), HDL (p=0.05), LDL (p<0.001), cholesterol (p<0.001) and body weight (p=0.03).
The weight loss was associated with the decrease on HbA1c (p<0.01) blood glucose (p=0.02), also on LDL (p=0.01) and cholesterol (p=0.02) and waist circumference (p<0.001). And an association between the waist circumference decrease and the decrease of HbA1c (p=0.04) and body weight (p<0.001) was found.
Table 5- Effect of Glycemic Index, Glycemic Load, Fiber, MUFA, Body
Weight and Waist Circumference on outcomes of the two treatments.
Discussion and Conclusion
At baseline participants showed no significant difference between treatments besides fiber intake, which was higher on HWF diet, but at the end of
Blood Body Waist
Glucose Weight Circumference
Glycemic Index r 0.22 0.06 0.04 0.4 0.37 0.46 0.22 P value 0.09 0.65 0.76 0.001 0.003 <0.001 0.09 Glycemic Load r 0.21 0.18 0.19 0.26 0.29 0.24 0.22 P value 0.10 0.17 0.14 0.04 0.02 0.06 0.09 Fiber r -0.21 0.10 0.25 -0.21 0.15 -0.45 0.19 P value 0.10 0.44 0.05 0.10 0.25 <0.001 0.15 MUFA r -0.33 -0.10 -0.25 -0.42 -0.42 -0.28 -0.16 P value 0.009 0.44 0.05 <0.001 <0.001 0.03 0.22 Body Weight r 0.51 0.30 0.02 0.32 0.30 1 0.52 P value <0.001 0.02 0.87 0.01 0.02 . <0.001 Waist Circumference r 0.27 0.07 0.16 0.08 0.06 0.52 1 P value 0.04 0.60 0.22 0.54 0.65 <0.001 .
The number of participants for waist circumference is 60 and for the other items is 61.
the study there were more significant differences between the two diet groups and some of the differences (PUFA, MUFA, Glycemic Index and Glycemic Load) showing an effective dietary intervention.
In terms of HbA1c, since there was a significant decrease in the two diets, the difference between treatments was not significant being these results the
opposite of several studies concerning low glycemic diets(22, 23). Fasting glucose
differences did not also reach significance between treatments, but although there was a decrease within each treatment, the differences were not significant in
opposition of what was expected based on a previous study(22).
About lipids, this study shows that the LGI diet was more effective than the HWF diet on lowering the LDL and cholesterol, although it did not show a clear benefit on HDL as some authors previously showed with low glycemic index
diets(22, 24). And both triglycerides and total cholesterol/HDL decreased with
significant difference within LGI diet, but comparing with HWF diet it was not possible to prove a significant benefit from LGI diet.
On body measurements, the LGI diet provoked a higher decrease than the HWF diet, but the difference between the two diets were not significant, so it does not prove that the test diet has a greater effect on weight loss than the control diet,
in opposition of a previous study(22) and about the waist circumference
measurement, HWF diet had a greater decrease on the average size, but once more the difference between treatments was not significant.
About correlations, this study shows that the decrease on the glycemic
index of the diet decreases body weight as some studies showed before (13, 25),
and decreases HbA1c as several studies support (14, 22). An increase on fiber
supported by several authors (19, 20, 26). As studies showed before, a high MUFA
consumption resulted on a decrease of the HbA1c (27), HDL, LDL(28), cholesterol(28)
and body weight (15, 16). The weight loss contributed for a decrease on HbA1c as
was showed before(29) and like defended by some authors decreased the LDL and
cholesterol levels(30). And the results show that a waist circumference reduction
also provoked a decrease on HbA1c.
In one hand, according to our knowledge this is the first study conducted about low glycemic diets with canola oil and in which subjects had to go through strict criteria of selection in order to participate in the study. In the other hand, filling out food records proved to be a challenge for most participants and could affect the accuracy of those records, but all efforts were made to help all participants with that task.
The reduced number of participants and the fact that a large number of participants had their values carried forward for blood data could also have an influence on the results. Although the LGI diet proved to bring benefits on glucose control, blood lipids and body weight measurements, these effects were similar to those of HWF diet, excepting for LDL and cholesterol. The test diet proved to have a better effect on blood lipids management than the control diet, showing benefits from the consumption of canola oil.
Through correlations was possible to show the beneficial effect of the reduction of the glycemic index from the diet on HbA1c and weight and the benefits from MUFA consumption on HbA1c, blood lipids and weight loss. Hereupon new studies are in need to support or refute the benefits of low glycemic index diets, specifically the LGI diet.
Acknowledgments
After those four years of study I have al lot of memories of the plenty good moments that I had and for that I have to thank all people that made part of those moments. So in first place I would like to thank my friends from UAC and UP, specially my friends from TUSA, my friends «Açorianos» from my course, Ana Alves, João Bento, Luisa Ponte and Sónia Oliveira.
A special thanks to my parents, brother and the rest of the family, specially the Medeiros family that lives in Canada, to Dr. Cyril Kendal for accepting me for this internship and to all people that worked with me and guided me in RFMC, specially Livia Augustin, Sandy Mitchell and Xavier Gusmini.
I also want to thank my coordinator from Portugal, Dra Teresa Amaral for her patience and crucial help. This is the end of the best chapter of my life until now, once more thanks to you all, cannot wait for what comes next.
References
1. Boavida JMea. Diabetes: Factos e Números 2011 Relatório Anual do
Observatório Nacional de Diabetes Portugal. 2012:55.
2. Berard LDea. Canadian Diabetes Association 2008 Clinical Practice
Guidelines for the Prevention and Management of Diabetes in Canada. Canadian Journal of Diabetes. 2008; 32:215.
3. Federation ID. Complications of Diabetes. 2011
4. Pi-Sunyer FX, Maggio CA, McCarron DA, Reusser ME, Stern JS, Haynes
RB, et al. Multicenter randomized trial of a comprehensive prepared meal program in type 2 diabetes. Diabetes Care. 1999; 22(2):191-97.
5. Franz MJ, Monk A, Barry B, McClain K, Weaver T, Cooper N, et al.
Effectiveness of Medical Nutrition Therapy Provided by Dietitians in the Management of Non–Insulin-Dependent Diabetes Mellitus: A Randomized, Controlled Clinical Trial. Journal of the American Dietetic Association. 1995; 95(9):1009-17.
6. Brand-Miller J, Hayne S, Petocz P, Colagiuri S. Low–Glycemic Index Diets
in the Management of Diabetes. Diabetes Care. 2003; 26(8):2261-67.
7. Wolever TM, Gibbs AL, Mehling C, Chiasson J-L, Connelly PW, Josse RG,
et al. The Canadian Trial of Carbohydrates in Diabetes (CCD), a 1-y controlled trial of low-glycemic-index dietary carbohydrate in type 2 diabetes: no effect on glycated hemoglobin but reduction in C-reactive protein. The American Journal of Clinical Nutrition. 2008; 87(1):114-25.
8. Jenkins DJ, Wolever TM, Taylor RH, Barker H, Fielden H, Baldwin JM, et al.
Glycemic index of foods: a physiological basis for carbohydrate exchange. The American Journal of Clinical Nutrition. 1981; 34(3):362-6.
9. Esfahani A, Wong JMW, Mirrahimi A, Srichaikul K, Jenkins DJA, Kendall
CWC. The Glycemic Index: Physiological Significance. Journal of the American College of Nutrition. 2009; 28(4 Supplement 1):439S-45S.
10. Jenkins DJ, Kendall CW, Augustin LS, Franceschi S, Hamidi M, Marchie A,
et al. Glycemic index: overview of implications in health and disease. The American Journal of Clinical Nutrition. 2002; 76(1):266S-73S.
11. Barclay AW, Petocz P, McMillan-Price J, Flood VM, Prvan T, Mitchell P, et
al. Glycemic index, glycemic load, and chronic disease risk—a meta-analysis of observational studies. The American Journal of Clinical Nutrition. 2008; 87(3):627-37.
12. Chiu C-J, Liu S, Willett WC, Wolever TMS, Brand-Miller JC, Barclay AW, et
al. Informing food choices and health outcomes by use of the dietary glycemic index. Nutrition Reviews. 2011; 69(4):231-42.
13. Esfahani A, Wong JMW, Mirrahimi A, Villa CR, Kendall CWC. The
application of the glycemic index and glycemic load in weight loss: A review of the clinical evidence. IUBMB Life. 2011; 63(1):7-13.
14. Miller CK, Headings A, Peyrot M, Nagaraja H. A behavioural intervention
incorporating specific glycaemic index goals improves dietary quality, weight control and glycaemic control in adults with type 2 diabetes. Public Health Nutrition. 2011; 14(07):1303-11.
15. Schwingshackl L, Strasser B, Hoffmann G. Effects of monounsaturated fatty
acids on cardiovascular risk factors: a systematic review and meta-analysis [Meta-Analysis
Review]. Ann Nutr Metab. 2011; 59(2-4):176-86.
16. Paniagua JA, de la Sacristana AG, Sánchez E, Romero I, Vidal-Puig A,
Berral FJ, et al. A MUFA-Rich Diet Improves Posprandial Glucose, Lipid and GLP-1 Responses in Insulin-Resistant Subjects. Journal of the American College of Nutrition. 2007; 26(5):434-44.
17. Iggman D, Gustafsson IB, Berglund L, Vessby B, Marckmann P, Risérus U.
Replacing dairy fat with rapeseed oil causes rapid improvement of hyperlipidaemia: a randomized controlled study. Journal of Internal Medicine. 2011; 270(4):356-64.
18. Kendall CWC. Replacing dairy fat with rapeseed (canola) oil improves
hyperlipidaemia – editorial. Journal of Internal Medicine. 2011; 270(4):343-45.
19. Kaczmarczyk MM, Miller MJ, Freund GG. The health benefits of dietary
fiber: Beyond the usual suspects of type 2 diabetes mellitus, cardiovascular disease and colon cancer. Metabolism. (0)
20. Riccioni G, Sblendorio V, Gemello E, Di Bello B, Scotti L, Cusenza S, et al.
Dietary Fibers and Cardiometabolic Diseases. International Journal of Molecular Sciences. 2012; 13(2):1524-40.
21. Soper D. Statistical Calculators version 3.0 Beta. 2006
22. Jenkins Da KCCM-EG, et al. Effect of a low–glycemic index or a high–
cereal fiber diet on type 2 diabetes: A randomized trial. JAMA: The Journal of the American Medical Association. 2008; 300(23):2742-53.
23. Rosén LAH, Östman EM, Björck IME. Postprandial glycemia, insulinemia,
and satiety responses in healthy subjects after whole grain rye bread made from different rye varieties. 2. Journal of Agricultural and Food Chemistry. 2011; 59(22):12149-54.
24. Abete I, Goyenechea E, Zulet MA, Martínez JA. Obesity and metabolic
syndrome: Potential benefit from specific nutritional components. Nutrition, Metabolism and Cardiovascular Diseases. 2011; 21, Supplement 2(0):B1-B15.
25. Marsh K, Barclay A, Colagiuri S, Brand-Miller J. Glycemic Index and
Glycemic Load of Carbohydrates in the Diabetes Diet. Current Diabetes Reports. 2011; 11(2):120-27.
26. Lattimer JM, Haub MD. Effects of Dietary Fiber and Its Components on
Metabolic Health. Nutrients. 2010; 2(12):1266-89.
27. Schwingshackl L, Strasser B, Hoffmann G. Effects of Monounsaturated
Fatty Acids on Glycaemic Control in Patients with Abnormal Glucose Metabolism: A Systematic Review and Meta-Analysis. Annals of Nutrition and Metabolism. 2011; 58(4):290-96.
28. Berry EM, Eisenberg S, Haratz D, Friedlander Y, Norman Y, Kaufmann NA,
et al. Effects of diets rich in monounsaturated fatty acids on plasma lipoproteins--the Jerusalem Nutrition Study: high MUFAs vs high PUFAs. The American Journal of Clinical Nutrition. 1991; 53(4):899-907.
29. Wing Rr KRELHNMGWBD. LOng-term effects of modest weight loss in type
ii diabetic patients. Archives of Internal Medicine. 1987; 147(10):1749-53.
30. Dattilo AM, Kris-Etherton PM. Effects of weight reduction on blood lipids
and lipoproteins: a meta-analysis. The American Journal of Clinical Nutrition. 1992; 56(2):320-8
Anex
Figue 2. Mean Study Measurements in Participants on LGI diet and HWF diet
HbA1c (n=61) 6.500 6.700 6.900 7.100 7.300 7.500 week % HF LGI 0 4 8 10 12 Fasting glucose(n=61) 6.30 6.80 7.30 7.80 8.30 week m m ol /L HF LGI 0 4 8 10 12 Cholesterol(n=61) 3.50 3.70 3.90 4.10 4.30 4.50 week m m o l/ L HF LGI 0 4 8 10 12 LDL-C(n=61) 1.70 1.90 2.10 2.30 2.50 2.70 week m m o l/ L HF LGI 0 4 8 10 12 HDL-C(n=61) 1.07 1.12 1.17 1.22 1.27 1.32 1.37 week m m o l/ L HF LGI 0 4 8 10 12 Triglycerides(n=61) 1.00 1.10 1.20 1.30 1.40 1.50 1.60 week m m o l/ L HF LGI 0 4 8 10 12 p= 0.32 p= 0.77 P = 0.003 P = 0.003 p= 0.24 p= 0.56
Figure 3. Correlation between baseline changes on Glycemic Index and HbA1c on
LGI diet. Total cholesterol/HDL(n=61) 2.80 3.00 3.20 3.40 3.60 3.80 week m m o l/ L HF LGI 0 4 8 10 12 Body weight (n=61) 70.0 75.0 80.0 85.0 90.0 week Kg HF LGI 0 4 8 10 12 P = 0.55 Waist standing(n=60) 97 98 99 100 101 102 103 104 105 106 week cm HF LGI 0 4 8 10 12 p= 0.95 p= 0.10