Assessing forest species biogeophysical suitability by
spatial multicriteria analysis: a study case for the Centro
region of Portugal
Natália Roque1, Isabel Navalho1, Cristina Alegria1, 2, Teresa Albuquerque 3, Luís Quinta-Nova1, 4
a Polytechnic Institute of Castelo Branco, School of Agriculture, Quinta da Senhora de Mércules, Apartado 119, 6001-909 Castelo Branco, Portugal.
b CERNAS - Centro de Estudos de Recursos Naturais, Ambiente e Sociedade, Polytechnic Institute of Castelo Branco, Agriculture School, Castelo Branco, Portugal.
c Polytechnic Institute of Castelo Branco, Technology School, Castelo Branco, Portugal. e GeoBioTec - Geobiociências, Geoengenharias e Geotecnologias, University of Aveiro, Aveiro, Portugal.
Abstract. It is generally agreed that the choice of the most suitable uses based
in soil and climatic factors, complemented with socio-economic criteria, promotes sustainable use of rural land. There are, however, different methodologies for defining soil suitability to agroforestal systems or natural and seminatural ecosystems, including agricultural uses, forest plantations, agroforestry areas and priority areas for conservation. Many of these methods rely on decision support systems based on multicriteria spatial analysis. In this study it was intended to determine the different levels of suitability for the most representative forest species in the central region of Portugal. For that purpose a set of climatic, soil and topographic variables based in a geographic information system, soil and biogeographic mapping were used. A stochastic approach was undertaken in order to estimate several bioclimatic indices and the associated spatial uncertainty. Results were duly discussed and addressed in this framework. In the end, forest species suitability evaluation was performed using the Analytic Hierarchy Process (AHP), methodology that allows the exploitation of natural fitness of the territory, contributing to a reflection on the adequacy of current and future occupations face the carrying capacity of the environment. The use of this methodology will be important as a supporting tool to public administration agents that work in forestry planning and management.
1 Introduction
Understanding the spatial relationships between the different territorial functions through the establishment of relations of continuity and connectivity between the elements under consideration, together with geographical and alphanumeric information allows the realization of spatial analysis to determine the degree of functionality of each element in analysis (Guiomar et al. 2007).
Multicriteria analysis is an alternative assessment tool, particularly interesting when you explore the various possible combination of criteria, allowing consider different scenarios assessment. To Roy (1996) it is a mathematical tool that allows you to compare different alternatives or scenarios, based on various criteria, in order to help decision-makers chosing an alternative.
The Analytic Hierarchy Process (AHP) is one of the methods of multi-criteria spatial analysis more widely used, developed in the 1970s by Thomas L. Saaty (Steiguer et al., 2003). This process is based on mathematics and psychology and provides a comprehensive and rational framework for structuring a decision problem, allowing the representation and quantification of its elements, in order to relate these elements with general objectives and evaluate alternative solutions (Saaty, 1980).
The AHP decomposes a problem, question or decision, in all the variables that constitute it, in a scheme of criteria and sub-criteria, then making pairwise comparisons between them (Antunes, 2012). The comparison between criteria is made using a scale of 1 to 9, wherein 1 is equaly preferred and 9 to highly preferred (Saaty, 1980).
The AHP reverts comparisons on numerical values that can be processed and compared to the full extent of the problem. The weight of each factor allows the evaluation of each of the elements within the defined hierarchy. This conversion capability of empirical data in mathematical models distinguish the AHP other decision-making techniques (Saaty, 1980).
The Multicriteria Spatial Decision Analysis has been widely applied in various studies in different fields, many of which are published and are cited by many authors as processes of relevant decision making. This is the case of Kangas et al. (2000) referring to the use of GIS in the decision-making process through the multicriteria analysis in the planning of forest resources conservation actions, allowing actions are directed by the determination of the priority areas.
Quinta-Nova and Roque (2014) developed a model based on multicriteria spatial analysis AHP in order to determine the suitability levels for agroforestry uses of the sub-region of Beira Interior Sul. The criteria used were the soil potential, slope and aspect. The authors note that this analysis identified the areas where the use of land shall be subject to a conversion and/or a change of management. Thus having endogenous variables such as soil, climate and terrain elevation was intended to determine the suitability of various forest species based on an AHP model to evaluate the different levels of agroforestry suitability in the Centro region of Portugal.
2 Materials and methods
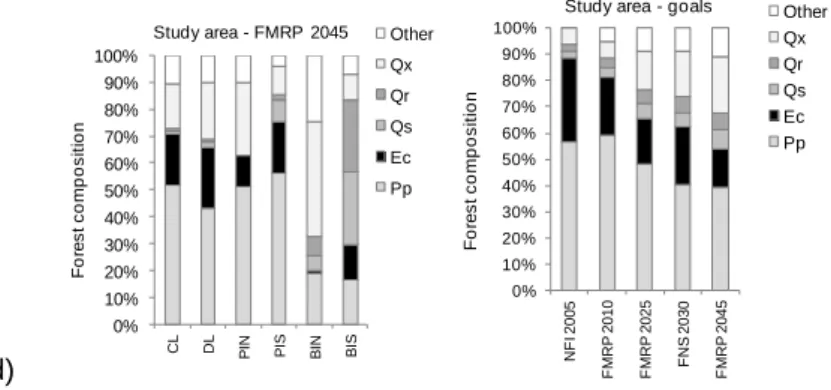
2.1 Study areaThe study area is the center region of Portugal (Fig.1a) which is divided in six forest management regions (CL – Centro Litoral; DL – Douro e Lafões; PIN – Pinhal Interior Norte; PIS – Pinhal Interior Sul; BIN – Beira Interior Norte; and BIS – Beira Interior Sul) (ICNF, 2015). Forest area in the center region of Portugal (Fig. 1b,c) is mainly composed by maritime pine (Pinus pinaster Aiton) (544.585ha; 51%), eucalyptus (Eucalyptus globulus Labill.) (357.805 ha; 34%), oaks (e.g. Quercus pyrenaica Willd., Quercus faginea Lam. e Quercus robur L.) (52.585 ha; 5%) and cork oak (Quercus suber L.) (45.221ha; 4%). The remaining forest area is ocuppied by holm oak (Quercus rotundifolia Lam.), stone pine (Pinus pinea L.), chestnut (Castanea sativa Mill.), acacia (Acacia sp.), other broadleaved and other coniferous (AFN, 2010).
For each one of the six management regions referred to above there is a correspondent Forest Management Regional Plan (FMRP) (ICNF, 2015) that propose forest composition goals for 2010, 2025 and 2045. Additionally, the National Strategy for Forests (FNS) (DR, 2006) proposes also forest composition goals for 2030 by forest management region. In that view, for the study area these official documents propose an important decrease of eucalyptus area, a slightly decrease of maritime pine area and a strong increase of oaks areas (Fig. 1d). Therefore, having in consideration both the current distribution of forest species over the study area and forest composition goals for the future, six forest species were selected, namely: maritime pine, eucalyptus, Pyrenean oak, cork oak, Portuguese oak and holm oak. Afterwards, these species biogeophysical suitability was assessed in order to support future landscape planning.
0 50,000 100,000 150,000 200,000 250,000 300,000 CL DL PIN PIS B IN BIS A re a ( h a )
Study area - NFI 2005 Other
Qx Qr Qs Ec Pp 0% 10% 20% 30% 40% 50% 60% 70% 80% 90% 100% CL DL PIN PIS B IN BIS F o re s t c o m p o s it io n
Study area - NFI 2005 Other
Qx Qr Qs Ec Pp 0% 10% 20% 30% 40% 50% 60% 70% 80% 90% 100% CL DL PIN PIS B IN BIS F o re s t c o m p o s it io n
Study area - FMRP 2010 Other
Qx Qr Qs Ec Pp 0% 10% 20% 30% 40% 50% 60% 70% 80% 90% 100% CL DL PIN PIS B IN BIS F o re s t c o m p o s it io n
Study area - FMRP 2025 Other
Qx Qr Qs Ec Pp 0% 10% 20% 30% 40% 50% 60% 70% 80% 90% 100% CL DL PIN PIS B IN BIS F o re s t c o m p o s it io n
Study area - FNS 2030 Other
Qx Qr Qs Ec Pp a) b) c) d) d)
Figure 1. Study area: a) Forest management regions (ICNF, 2015); b) Forest area (ha) in 2005
by forest management region (NFI – National Forest Inventory) (AFN, 2010); c) Forest composition (%) in 2005 (NFI) (AFN 2010); d) Forest composition goals (FMRP – Forest Management Regional Plans and FNS –National Strategy for Forests) for 2010, 2025, 2030 and 2045 by forest management region and for the all study area (DR, 2006; ICNF, 2015).
2.2 Bioclimatic analysis
For the development of bioclimatic maps were used climatic data (Pp, Tp, Tmax, Tmin, T, M e m) calculated from temporal series corresponding to climatological normal of the period between 1981 and 2010 referring to 32 stations, located in Portugal and Spain (Figure 2).
0% 10% 20% 30% 40% 50% 60% 70% 80% 90% 100% CL DL PIN PIS BIN BIS F o re s t c o m p o s it io n
Study area - FMRP 2045 Other
Qx Qr Qs Ec Pp 0% 10% 20% 30% 40% 50% 60% 70% 80% 90% 100% N F I 2 0 0 5 F M R P 2 0 1 0 F M R P 2 0 2 5 F N S 2 0 3 0 F M R P 2 0 4 5 F o re s t c o m p o s it io n
Study area - goals Other
Qx Qr Qs Ec Pp
Legend: Forest species - Pp – Pinus pinaster Ait., Ec – Eucalyptus sp., Qs – Quercus suber L., Qr –
Quercus rotundifolia Lam., Qx –Quercus pyrenaica Willd., Quercus faginea Lam. and Quercus robur
L Forest management regions - CL – Centro Litoral; DL – Douro e Lafões; PIN – Pinhal Interior Norte; PIS – Pinhal Interior Sul; BIN – Beira Interior Norte; and BIS – Beira Interior Sul.
Figure 2. Location of weather stations used in the preparation of the mapping of bioclimatic
indices.
The methodology now proposed results from the development of maps at the national level, corresponding to each of the attributes to be used in the calculation of bioclimatic indices (Figura 3).
Since the study variables can be assumed to be regionalized variables (Matheron, 1970), we began the study of the attributes by variogram analysis. The variogram is a vector function, applicable to regionalized variables (Matheron, 1970), whose argument is the distance vector h which quantifies the variance of the increments of the first order function (Soares, 2000). Experimental estimation function from the set of experimental data carried out by applying the formula:
𝛾(ℎ) = 1 2𝑁(ℎ)∑ [𝑍(𝑥𝑖) − 𝑍(𝑥𝑖+ ℎ)] 2 𝑁(ℎ) 𝑖=1 (1) Where Z(xi) and Z(xi + h) are the numerical values of the observed variable at the points xi and xi + h, and N(h) is the number of pairs for a distance h. It is therefore the average of the squared value of the differences between all pairs of points existing in the geometrical field, spaced a distance h (Journel and Huijbregts, 1978).
The study of the variogram graphic behavior provides a description of the structure of the spatial variation of the variable (Chica, 2005). The nugget effect (Co), summarizes the behavior at the origin (Co), that is, the farther away from zero the more random is the behavior of the variable. The other two parameters are the platform (C1) and the amplitude (a) that define the area of influence and the percentage of the total variance that will be used in the subsequent process of interpolation or stochastic simulation.
The variogram study made to the study variables, did not allow to modeling possible geometric anisotropy, and so were set omnidirectional models whose parameters are summarized in Figure 5.
For the next step of interpolation was used ordinary kriging - KO (Journel e Huijbregts, 1978; Soares, 2000).
The KO estimator of the found value is a linear weighting of experimental values Z(xi) by unknown λi coefficients (Chica, 2005):
𝑍𝐾𝑂(𝑥) = ∑ λ𝑖 𝑛
𝑖=𝑙
Figure 3. Representation of cartography at a national level, of the attributes used in the
calculation of the bioclimatic indices (Pp, Tp, Tmax, Tmin, T, M e m). It is also showed the omnidirectional variogram, and the corresponding adjusted theoretical models in geostatistical modeling by Ordinary Kriging.
Subsequently we calculated the following indices using map algebra: continentality index (Ic = Tmax-Tmin); termicity index (It = 10*(T+M+m) and ombrotermic index (Io = Pp/Tp). The SpaceStat 4.0.14 software (Biomedware) and ArcMap 10 (ESRI) were used in the calculation process. The bioclimatic map was obtained by the combination of three indices (Ic, It and Io) in a geographical analysis function which groups the different ranges of each climatic domain in a new entry that groups in different combinations.
2.3 Diagnostic features of soil to the forest tree species
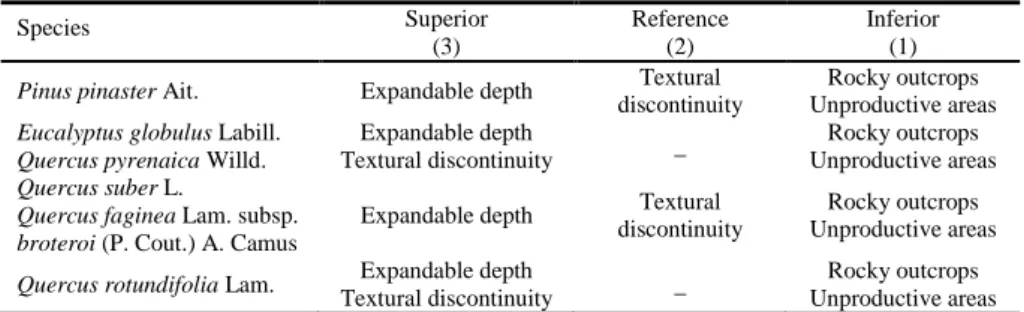
The species studied were the maritime pine (Pinus pinaster Ait.), eucalyptus (Eucalyptus globulus Labill.), cork oak (Quercus suber L.), holm oak (Quercus rotundifolia Lam.), Portuguese oak (Quercus faginea Lam. subsp. broteroi (P. Cout.) A. Camus) and the Pyrenean oak (Quercus pyrenaica Willd.). Based on the methodology developed by Ferreira et al. (2001), the soil units present in the study area were classified in “diagnostic features” according to the soil conditions for the development of forest species considered (Table 1). To each soil family was assigned the corresponding diagnostic feature according to the limitation on forest development.
Table 1. Species soil diagnosis characteristics (Correia and Oliveira, 2003; Dias et al., 2008).
Species Superior (3) Reference (2) Inferior (1)
Pinus pinaster Ait. Expandable depth Textural discontinuity
Rocky outcrops Unproductive areas
Eucalyptus globulus Labill. Expandable depth
Textural discontinuity _
Rocky outcrops Unproductive areas
Quercus pyrenaica Willd. Quercus suber L.
Expandable depth Textural discontinuity
Rocky outcrops Unproductive areas
Quercus faginea Lam. subsp. broteroi (P. Cout.) A. Camus
Quercus rotundifolia Lam. Expandable depth
Textural discontinuity _
Rocky outcrops Unproductive areas
The development of soil interpretative maps and bioclimatic maps for each species relied on the definition of three suitability classes, considering a reference class. In the case of soil, the reference class is characterized by no constraints to the development and growth of the tree species. Compared with the reference class, the upper and lower than the reference classes have respectively less and more restrictions for the survival, growth and development of forest species (Dias et al., 2008).
The themes of diagnostic features and bioclimate were reclassified following the methodology defined by Ferreira et al . (2001) and Dias et al . (2008) into three classes: higher than the reference (3); reference (2); lower than the reference (1), giving the most limiting classification.
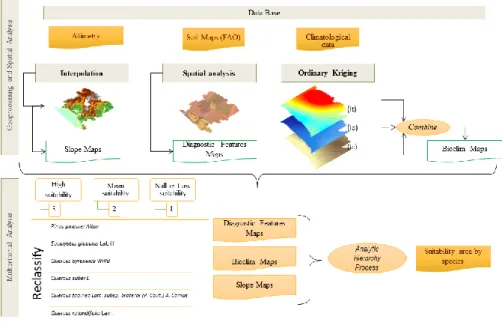
The interpretative model of methodological procedures performed is presented in Figure 4, where we present the working lines: i) Interpolation and geoprocessing for determining slope, to ii ) Spatial analysis to determine the diagnostic features regarding forest use and iii ) stochastic modeling using KO to calculate It, Ic and Io indices.
2.4 AHP pairwise comparison
Determination of criterion weights are crucial in multicriteria analysis. The AHP is a mathematical method for this purpose when analyzing complex decision problems (Saaty, 1980). It derives the weights through pairwise comparisons of the relative importance between each two criteria. Through a pairwise comparison matrix, the AHP calculates the weight value for each criterion (wi) by taking the eigenvector corresponding to the largest eigenvalue of the matrix, and then normalizing the sum of the components to a unity.It is necessary to verify the consistency of the matrix after obtaining the weight values.
The consistency is judged on the basis of a consistency ratio CR. The determination of CR value is critical. In our case study, we adopted a standard CR threshold value of 0.10 which has been widely used as a measure of the consistency in a set of judgments of AHP applications in literature. If CR <0.10, it deems that the pairwise comparison matrix has acceptable consistency and the weight values calculated are valid and can be utilized.
3 Results
3.1 Bioclimatic Indices
The aim of Bioclimatology is to determine the relationship between precipitation and temperature values and the geographical distribution of species and plant communities. The water availability in soil determines the distribution of plant species within the limits defined by air temperature, and water is the factor that most influences the physiology and plant morphology. The mapping of the calculated bioclimatic indices - Ic Io It - are presented in Figure 5, showing the zoning consistent with the Portuguese Centro region.
Figure 5. Modeling (Climatic normals 1981/2010): a) continentality index; b) ombrotermic
index; c) termicity index.
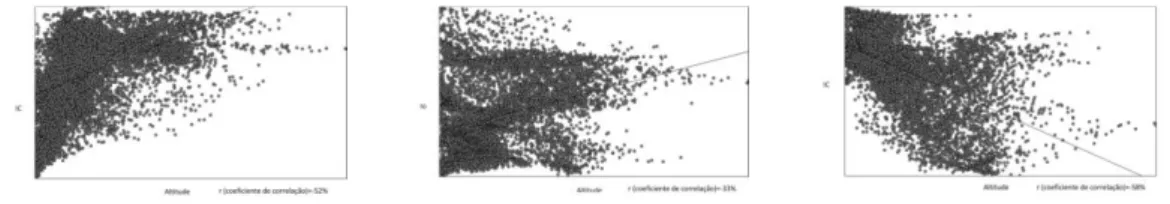
The contribution of the altitude in calculating the indices proved unpromising since the correlation coefficients (r) were not very significant (Figure 6). The continentality index shows a value of r of -58 %. Therefore in future works will be used methods of stochastic simulation using altitude as auxiliary variable, in order to characterize the associated spatial uncertainty.
Figure 6. Correlation coefficients: a) continentality index; b) ombrotermic index; c) termicity
index.
3.2 Multicriteria Spatial Analysis using AHP
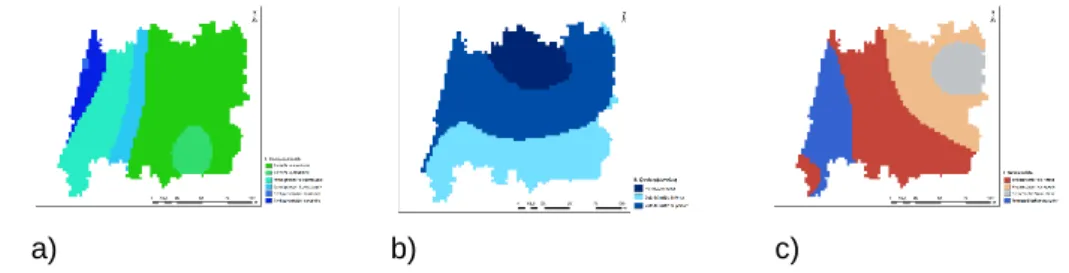
Figure 7 shows the input variables for the analysis of the diagnostic features and bioclimate that were reclassified following the methodology defined by Ferreira et al. (2001) and Dias et al. (2008) into three classes: high suitability (3); reference suitability (2); Low or no suitability (1).
The result of AHP analysis in the studied species, together with the bioclimatic and geomorphology characteristics indicate that the bioclimatic influence is determinant in the development of these species, since the weighting of the AHP analysis is 64.9 % , followed by the soil factor (diagnostic features) 27.9 %.
Figure 7. Input data for multicriteria spatial analysis: a) bioclimatic map; b) diagnostic features
map; c) slope map.
The AHP process is completed by determining the relative importance of each criteria/subcriteria and the validation of the consistency of these operations. If the consistency ratio (CR) is less than 10 % (CR < 0.1) means that there is consistency in the pairwise comparison matrix. In the following cartograms show the results of the hierarchical analysis (Figure 8).
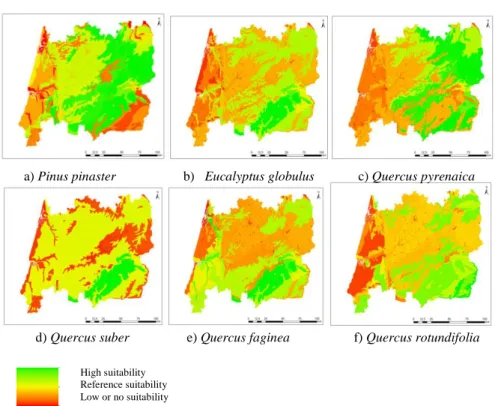
Figure 8. Representation of cartography, with the forest suitability levels for the tree species: a)
maritime pine; b) eucalyptus; c) Pyrenean oak; d) cork oak; e) Portuguese oak; f) holm oak.
4 Discussion
In this study it was developed a spatial model of spatial multicriteria evaluation in GIS environment to determine the natural suitability for forestal tree species in Centro region of Portugal (NUT II).
In this particular case it should be noted that despite having resorted to a limited number of criteria in AHP analysis, this proved to be extremely important, since by exploiting the land suitability and based on a set of biophysical factors, it is possible assess the degree of importance of each criterion and identify the suitability of forest species.
The AHP proved to be also suitable in assessing the suitability of the study area, to allow the integration of the various criteria studied depending on the assigned weights, being a very useful interactive tool in the analysis of the territory, which enables decision making and resolution problems.
This methodology allows the exploitation of natural territory suitability, based on a set of biophysical factors contributing to a reflection on the adequacy of current and future occupations due to the carrying capacity of the land.
a) Pinus pinaster b) Eucalyptus globulus c) Quercus pyrenaica
d) Quercus suber e) Quercus faginea f) Quercus rotundifolia
High suitability Reference suitability Low or no suitability
The instrumental point of view, the use of this methodology may take an interest to stakeholders and other persons with roles in the planning and land management.
References
1. Guiomar, N., Fernandes, J.P., Neves, N., 2007. Modelo de Análise Espacial para Avaliação do carácter Multifuncional do Espaço. In Atas do III Congresso de Estudos Rurais (III CER). Faro, Universidade do Algarve, 1-3 Nov. 2007 - SPER. Évora.
2. Roy, B. (1996), Multicriteria methodology for decision aiding. Dordrecht. Kluwer Academic.
3. Steiguer, J. E., Liberti, L., Schuler, A., Hansen, B., (2003). Multi-Criteria Decision Models for Forestry and Natural. USDA Forest Service, Northeastern Research Station, pp. 8; 16-23.
4. Antunes, O. E. D., 2012. Análise Multicritério em SIG para Determinação de um Índice Espacializado de Pressão Antrópica Litoral. Casos de Espinho, Caparica e Faro. Dissertação de Mestrado em Gestão do Território. Área de Especialização em Deteção Remota e Sistemas de Informação Geográfica. Universidade Nova de Lisboa. Faculdae de Ciências Sociais e Humanas. Lisboa.
5. Saaty, T. L., (2008). Decision making whit the Analytic Hierarchy Process. Internacional Journal of Services Scienes. Vol.1, Nº 1.pp.83-98.
6. Kangas, J., Store, R.L., Leskinen, P., Mehtatalo, L., 2000. Improving the Quality of Landscape Ecological Forest Planning by Utilizing Advanced Decision-Support Tools. Forest Ecology and Management, Amsterdam, v.132, p.157-171.
7. Quinta-Nova, L.C., Roque, N., (2014) Agroflorestal Suitability Evaluation of a Subregional Area in Portugal Using Multicritéria Spacial Analysis. Internacional Congress of Landscape Ecology – Understanding Mediterranean Landscapes Human vs. Nature, 23-25 October. Antalaya. Turkey.
8. AFN, 2010. Inventário Florestal Nacional Portugal Continental. 5º Inventário Florestal Nacional 2005-2006. Relatório Final. Autoridade Florestal Nacional. http://www.icnf.pt/portal/florestas/ifn/ifn5/relatorio-final-ifn5-florestat-1.
Accessed on May 2015.
9. Matheron, G. (1970): “La théorie des variables régionalisées, et ses applications”.Centre Géostatistique et Morphologie Mathématique. Ecole Nationale Supérieure des Mines de Paris. Paris.
10. Soares, A. (2000): “Geoestatística para as ciencias da terra e do ambiente”. Editorial Press. 206 pp.
11. Journel, A. G. y Huijbregts, C. J. (1978): “Mining Geostatistics”. Academic Press. London.
12. Chica, M. (2005): “La Geoestadística como herramienta de análisis espacial de datos de inventario forestal”. Actas de la I reunión de inventario y teledetección forestal. Cuad. Soc. Esp. Cienc. For. 19: 47-55 (2005).
13. Correia, A. V.; Oliveira, A. C., 2003. Principais espécies florestais com interesse para Portugal. Zonas de influência atlântica. Estudos e Informação n.º 322, DGF, Lisboa, 187 p.
14. Dias, S., Ferreira, A., Gonçalves, A., 2008. Definição de Zonas de Aptidão para Espécies Florestais com Base em Características Edafo-Climáticas. Silva Lusitana, n.º especial 17-35.
15. Ferreira, A. G., Gonçalves, A. C., Pinheiro, A.C., Gomes, C.P., Ilhéu, M., Neves, N., Ribeiro, N., Santos, P., 2001. Plano Específico de Ordenamento Florestal para o Alentejo.2001. Universidade de Évora. Évora.