Sara Peres de Morais
Licenciatura em Biologia
Juvenile Parkinson disease caused by
parkin mutations: large deletions and
pathogenic mechanisms
Dissertação para obtenção do Grau de Mestre em Genética Molecular e Biomedicina
Orientadora: Doutora Isabel Alonso, Investigadora Auxiliar, IBMC
Júri:
Presidente: Prof. Doutor José Paulo Sampaio
Arguente: Prof. Doutora Ana Sofia Almeida Oliveira
Vogal: Doutora Isabel da Conceição Moreira Pereira Alonso
Juvenile Parkinson disease caused by parkin mutations: characterization of large genomic deletions and pathogenic mechanisms
Copyright Sara Peres Morais, FCT/UNL, UNL
Agradecimentos / Acknowledgments
Ao Professor Doutor Jorge Sequeiros por me ter dado a oportunidade de realizar este trabalho no seu laboratório e fazer parte da sua fantástica equipa.
À Doutora Isabel Alonso por toda a orientação, apoio e ajuda neste ano complicado. Pela imensa paciência e disponibilidade que sempre teve para tudo o que precisássemos. Um obrigado muito sentido pela compreensão da minha timidez e pela confiança que sempre demonstrou em nós.
À Doutora Carolina Lemos pela sua alegria contagiante com que nos brinda todos os dias, por estar sempre disposta a ajudar e a dar uma forcinha e por ser também a nossa salvação da estatística.
À Conceição Pereira por toda a ajuda e companhia durante este ano. A ela devo um agradecimento especial por me deixar persegui-la para aprender, por tanta coisa que me ensinou e por me responder a uma dúvida e mais outra e mais outra com uma paciência inimaginável.
Ao João Neto por me animar mesmo nos dias em que desesperava, por ter sempre uma palavra amiga e bem-disposta apesar da sua rabugice. Pelo “pente” e todas as brincadeiras e por nos últimos tempos ser a ama-seca do meu cacto.
Ao Miguel Alves Ferreira por todos os bons momentos que nos proporciona com a sua alegria e boa disposição, pelas boleias e por nos levar a conhecer Coimbra e os seus doces.
À Rita Ferreira e à Ana Filipa Brandão pelo seu apoio e por estarem sempre lá quando mais precisava apesar de terem sido engolidas pelo nosso famoso buraco negro.
À Diana Santos, Marlene Quintas e Soraia Osório por todo o apoio e por serem as nossas novas meninas.
À Ana Margarida Lopes, ao Victor Mendes e à Andreia Perdigão por toda a ajuda e companhia em todos os almoços animados.
Ao Dr. Jorge Pinto-Basto por nos permitir usar o seu laboratório e por tornar as refeições divertidas.
À Profª Doutora Margarida Castro Caldas Braga pela sua supervisão ao longo deste ano.
À minha família porque são o meu suporte e estão sempre presentes para o que for preciso. Aos meus pais que me apoiam desde sempre em todas as minhas decisões e que juntamente com os meus avós e o meu irmão me dão todo o amor que só a família é capaz.
Ao Ricardo, o meu mais que tudo, tenho o dever de dar um agradecimento muito especial, porque mais ninguém teve de aturar tanto as minhas crises existenciais este ano como ele. Esteve sempre ao meu lado, acompanhando-me, apoiando-me, ajudando-me e dando-me todo o amor e carinho que eu precisava.
Às minhas espanholitas, Inês Simões e Liliana Carvalho, por mesmo estando tão longe, estarem sempre presentes a acompanhar-me e dar-me uma mãozinha importante a arranjar aqueles artigos mais teimosos.
Contents
Index of Figures ... i
Index of Tables ... iv
Abbreviations ... v
Abstract ... vii
Sumário ... viii
1. Introduction ... 1
1.1 Parkinson disease ... 1
1.2 Autosomal recessive juvenile Parkinsonism ... 2
1.2.1 Pathophysiology ... 2
1.2.2 Genetics ... 4
1.2.2.1 PARK2 gene ... 4
1.2.2.2 Parkin ... 4
1.2.2.3 Parkin mutations and juvenile Parkinson disease ... 6
1.2.3 The ubiquitin proteasome system ... 8
1.3 Molecular pathways of neurodegeneration in PD ... 11
1.3.1 The relationship between UPS and Parkinson disease ... 11
1.3.2 Mitochondrial impairment and oxidative stress in PD ... 13
1.4 Aims ... 15
2 Materials and Methods ... 16
2.1 Large deletions breakpoint determination ... 16
2.1.1 Subjects ... 16
2.1.2 Approach 1: Verification of breakpoints already described ... 17
2.1.2.1 Primer design ... 17
2.1.2.2 Polymerase chain reaction ... 17
2.1.3 Approach 2: Range of primers that cover the introns ... 18
2.1.3.1 Primer design and PCR amplification ... 18
2.1.3.2 Long-range PCR ... 19
2.1.3.3 Isolation and purification of DNA fragments from agarose gels ... 20
2.1.4 Approach 3: Single nucleotide polymorphism (SNP) analysis ... 21
2.1.4.1 SNP selection ... 21
2.1.4.2 SNP genotyping ... 22
2.1.4.2.1 Amplification primers and SBE-primer design ... 22
2.1.4.2.2 Multiplex PCR and SNaPshot ... 23
2.1.4.3 PCR Long-range amplification and Sequencing ... 25
2.2 Characterization of point mutations and small scale rearrangements ... 25
2.2.1 Expression constructs ... 26
2.2.2 DNA extraction... 27
2.2.3 Site-directed mutagenesis ... 27
2.2.4 Cell cultures ... 28
2.2.5 Transfections ... 28
2.2.6 Real-Time quantitative reverse transcription PCR ... 29
2.2.7 Western blot analysis ... 30
2.2.8 Fluorescence microscopy assays ... 30
2.2.9 Proteasome inhibition ... 31
2.2.10 Proteasome activity assay ... 31
2.2.11 Viability assays ... 32
2.2.12 Statistical analysis ... 32
3 Results ... 33
3.1 Large PARK2 deletion breakpoint determination... 33
3.2 Functional characterization of PARK2 point mutations and small rearrangements ... 36
3.2.1 Parkin expression in SH-SY5Y cells ... 36
3.2.2 Wild-type and mutant parkin aggregate formation ... 39
3.2.3 Cell survival in wild-type and mutant parkin cell lines ... 44
3.2.4 Ubiquitin proteasome system and parkin aggregate formation ... 44
3.2.5 Proteasome activity under parkin overexpression ... 46
3.2.6 Impact of proteasome inhibition on cell viability ... 47
4 Discussion ... 49
4.1 PARK2 deletion breakpoint determination ... 49
4.2 Functional characterization of PARK2 point mutations and small rearrangements ... 50
4.2.1 Parkin aggregate formation and cell viability in SH-SY5Y cells ... 50
4.2.2 Proteasome Activity in parkin expressing cells ... 55
4.2.4 Parkin mutants and pathogenic mechanism ... 57
4.3 Conclusions ... 58
4.4 Future Perspectives ... 59
5 References ... 60
6 Appendices ... 69
6.1 Tables with the amplification primers and SBE-primers designed ... 69
6.2 Communications ... 74
i
Index of Figures
Figure 1.1: Schematic representation of the neurodegenerative processes affected in PD. Adapted from (Shulman et al., 2011). ... 3 Figure 1.2: Schematic representation of the most relevant parkin domains. ... 5 Figure 1.3: Schematic representation of the steps involved in the targeted degradation of proteins by
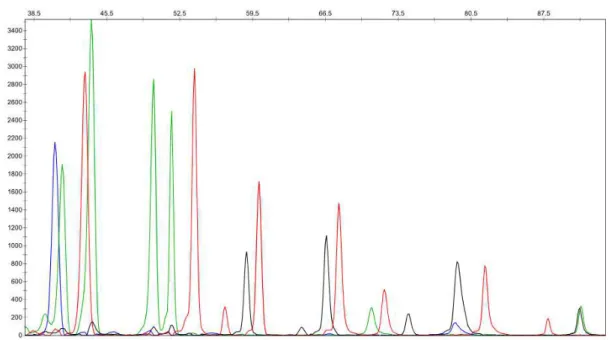
the UPS. Adapted from (von Coelln et al., 2004). ... 11 Figure 2.1: Peak profile of a sample from the intron 6 assay generated with GeneMapper Software. . 24 Figure 2.2: Schematic representation of parkin domains with chosen mutations indicated below. ... 26 Figure 3.1: Image of an agarose gel showing the fragments amplified with the primer combinations
presented in table 3.1. Note that in this experiment, patients 4, 7 and 11 were not tested since it is probable that these patients have the same deletion breakpoint as patients 3, 6 and 10. ... 35 Figure 3.2: Image of the agarose gel after further optimization of fragments obtained for patients 3, 9,
13 and 15. ... 36 Figure 3.3: Representative image obtained with a 20X objective on a Zeiss Axio Imager Z1 of the
pEGFP wild-type protein 48h after transfection. Note that we can see two different GFP positive cell population: high (HE) or low (LE) GFP expression. ... 37 Figure 3.4: Images obtained with a 100X oil objective on a Zeiss Axio Imager Z1 of the WT parkin at
72h after transfection. It is notable the difference in GFP expression between this two cells. ... 37 Figure 3.5: Immunoblotting of the soluble fraction of SH-SY5Y cells extracted 48h (A) and 72h (B)
after transfection, probed with antibodies against parkin and β-actin. Both GFP-parkin fusion protein (with approximately 79 kDa) and β-actin (with approximately 42 kDa) are at the correct weight. The proteins resulting from the expression of the constructs harboring the frameshift mutations, N52MfsX29 and L358RfsX77 were not detected by the anti-parkin antibody. ... 38 Figure 3.6: Quantitative analysis of parkin mRNA levels at 24h, 48h and 72h after transfection. Data is
expressed as arbitrary units (a.u.) ± SE. Note that the empty vector is not represented in this chart due to its low level, coming up with more than 15 CTs of difference from PARK2.... 39
Figure 3.7: Representative images of wild-type and mutant GFP-parkin aggregation in SH-SY5Y cells at 24h, 48h and 72 hours after transfection. Aggregate formation was mostly noticed in the frameshift parkin mutants (N52MfsX29 and L358RfsX77) and in the R275W mutant. The cells’
ii
Figure 3.8: Quantitative analysis of aggregate formation of wild-type and mutant parkin at 24h, 48h and 72h after transfection. These results correspond to the analysis of 20 cells per condition in each independent experiment. P-values are as follows: * P < 0.05 and ** P < 0.001. ... 42 Figure 3.9: Mean number of aggregates per cell with parkin aggregates. Results are presented as mean
± SE. These results correspond to the analysis of 20 cells per condition in each independent experiment. P-value is ** P < 0.001... 43 Figure 3.10: Images obtained with a 100X oil objective on a Zeiss Axio Imager Z1 of the R275W
mutant at 72h after transfection. It is remarkable the difference in aggregate formation between this two cell populations. ... 43 Figure 3.11: Levels of cell viability at the three transfection time points in cells transfected with wild-type and the different parkin mutants, as well as, with the empty vector. Results are expressed in relative fluorescence units (r.f.u.) and correspond to the analysis of 3 independent experiments. A control for cells without transfection was also included in the assay... 44 Figure 3.12: Representative images of wild-type and mutant GFP-parkin aggregation in SH-SY5Y
cells after UPS inhibition. Aggregate formation was identified in all transfected cells after 12h incubation with 5µM of MG132. These images were obtained with 100X oil objectives on a Zeiss Axio Imager Z1. Note that we can see two different aggregate types: small dot-like inclusions (e.g. image G430D) and larger massive aggregates (e.g. image R275W). ... 45 Figure 3.13: Quantitative analysis of aggregate formation of wild-type and mutant parkin after 12
hours of proteasome inhibition with 5µM of MG132. These results correspond to the analysis of 20 cells per condition in one experiment. ... 46 Figure 3.14: Mean number of aggregates per cell with parkin aggregates parkin after 12 hours of
proteasome inhibition with 5µM of MG132. Results are presented as mean ± SE. These results correspond to the analysis of 20 cells per condition in one experiment. P-value is ** P < 0.001.... 46 Figure 3.15: Proteasome activity quantification. Representation of all proteasome activities: caspase,
trypsin, chymotrypsin in cells transfected with wild-type, parkin mutants or GFP empty vector in the presence or absence of 5µM MG132 (12h incubation). Results are expressed in relative fluorescence units (r.f.u.), and correspond to the analysis of three independent experiments for each proteasomal activity. Note that a control comprising untransfected cells was also used. * P < 0.05 and ** P < 0.001... 47 Figure 3.16: Representation of cell viability in cells transfected with wild-type, parkin mutants or
empty GFP vector, with and without 12h incubation with MG132 (5µM). Results are expressed in relative fluorescence units (r.f.u.), corresponding to the analysis of three independent experiments. Note that a control comprising untransfected cells was also used. ... 48 Figure 4.1: Schematic representation of parkin domains with analyzed mutations indicated below.
iii
iv
Index of Tables
Table 2.1: List of patients with respective deletions in study. ... 16
Table 2.2: List of primers designed for the breakpoints described. ... 17
Table 2.3: PCR protocol for fragment amplification. ... 18
Table 2.4: List of primers designed to cover the relevant introns. ... 18
Table 2.5: PCR protocol for the amplification of fragments larger than 2 Kb. ... 19
Table 2.6: Sequencing Protocol. ... 20
Table 2.7: List of selected SNPs. ... 21
Table 2.8: PCR Multiplex protocol. ... 23
Table 2.9: SNaPshot reaction protocol. ... 24
Table 2.10: PARK2 mutations selected. ... 25
Table 2.11: Primers designed for cDNA sequencing. ... 26
Table 2.12: Primers for Site-Directed Mutagenesis. ... 27
Table 2.13: Primers used for real time quantification of PARK2 and ACTB mRNA levels. ... 29
Table 2.14: Real-time PCR amplification parameters. ... 29
Table 3.1: List of the SNPs/exons closest to the breakpoint of each patient. ... 34
Table 6.1: List of amplification primers designed for the SNPs selected. ... 69
v
Abbreviations
aa
–
Amino acid
ACTB
–
β
-actin
AD
–
Alzheimer disease
ALS
–
Amyotrophic lateral sclerosis
AR-JP – Autosomal recessive juvenile Parkinsonism CNS – Central nervous system
CP – Core particle of the 26S proteasome CT – Threshold cycle
ddNTPs – Dideoxynucleotide triphosphates DMEM – Dulbecco's modified eagle medium DMSO – Dimethyl sulfoxide
DNA – Deoxyribonucleic acid DUBs – Deubiquitinating enzymes E1 – Ubiquitin-activating enzyme E2 – Ubiquitin-conjugating enzyme E3 – Ubiquitin protein ligase
E4 – Ubiquitin chain elongation factors EOP – Early onset Parkinsonism
ExoSAP – Exonuclease and shrimp alkaline phosphatase mix FBS – Fetal bovine serum
GFP – Green fluorescent protein GPi – Globus pallidus interna
GWAS – Genome wide association study
HD –Huntington’s disease
HSP – Heat shock protein IBR – In-between-RING domain LB – Lewy body
LB in “Material and Methods”– Luria bertani medium
MAF – Minor allele frequency
MLPA – Multiplex dependent ligation probe amplification MPTP – 1-methyl-4-phenyl-1,2,3,6-tetrahydropyridine MS – Multiple sclerosis
vi
PACRG– Parkin co-regulated genePael-R – Parkin-associated endothelin receptor-like
PARK2– Parkin gene
PBS – Phosphate-buffered saline
PBS-T – Phosphate-buffered saline with tween-20 PCR – Polymerase chain reaction
PD – Parkinson disease
pDNA – Plasmid deoxyribonucleic acid Pu – Putamen
PVDF – Polyvinylidene fluoride RBR – Ring between ring fingers r.f.u. – Relative fluorescence units RING –“Really interesting new gene”
RIPA – Radio-immunoprecipitation assay buffer RNA – Ribonucleic acid
RPs - Regulatory particles of the 26S proteasome SAP – Shrimp alkaline phosphatase mix
SBE – Single-base extension
SDS-PAGE – Sodium dodecyl sulfate-polyacrylamide gel electrophoresis SE – Standard error
SNc –Substantia nigra pars compacta
SNP – Single nucleotide polymorphism Th – Thalamus
Ub – Ubiquitin
UBL – Ubiquitin-like domain
UCH-L1 – Ubiquitin C-terminal hydrolase L1 UPS – Ubiquitin proteasome system
vii
Abstract
Autosomal recessive juvenile Parkinson disease (AR-JP) is mainly caused by mutations in
PARK2. AR-JP presents with rigidity, bradykinesia and resting tremor, usually before age 40 years.
Large PARK2 deletions account for 50% of the mutations identified in patients with AR-JP of
Portuguese origin. The PARK2 gene encodes parkin, an E3 ubiquitin ligase, an important part of the
cellular machinery that covalently tags target proteins with ubiquitin for degradation by the ubiquitin-proteasome system (UPS), the main cellular protein degradation system responsible for targeted degradation of damaged and misfolded proteins.
This project aims were: determine the breakpoints of the deletion found in Portuguese patients in order to identify the genomic mechanisms underlying these gene rearrangements and to explore the pathogenic mechanisms of parkin mutations by assessing the dynamics of formation and degradation of aggregates by UPS and also by determining its effects in the UPS degradation capacity and its relation with neuronal death.
A successful approach was developed to narrow the deletion breakpoint intronic position. Cellular models expressing wild-type and mutant parkin were developed and characterized regarding mRNA and protein expression, as well as, aggregate formation, cell viability and proteasome activity.
Our data show that the different studied mutations do not have an impact on cell viability, although resulted in differences in the number of cell with aggregates for the cells expressing N52MfsX29, L358RfsX77 and R275W mutants as well as in the number of aggregates present in each cell. We were also able to show that proteasome inhibition has as impact both in cell viability and in aggregate formation, resulting in decreased viability and increased aggregate formation.
The study of the cellular mechanisms resulting in neuronal dysfunction is crucial for the identification of potential therapeutic targets for Parkinson disease.
viii
Sumário
A doença de Parkinson juvenil com transmissão autossómica recessiva é maioritariamente causada por mutações no gene PARK2. Esta doença caracteriza-se pela presença de rigidez, bradicinésia e
tremor de repouso, geralmente antes dos 40 anos.
Grandes deleções no gene PARK2 são responsáveis por 50% das mutações identificadas em
doentes com Parkinson juvenil na população portuguesa. Este gene codifica a proteína parkina, uma E3 ubiquitina ligase, que faz parte da maquinaria celular que adiciona ubiquitinas às proteínas-alvo para degradação pelo sistema ubiquitina-proteossoma (UPS), o mais importante sistema de degradação de proteínas responsável pela degradação de proteínas danificadas ou com uma conformação errada.
Os objectivos deste trabalho foram: determinar os breakpoints das deleções encontradas em
doentes portugueses de modo a identificar os mecanismos genómicos subjacentes aos rearranjos génicos, explorar os mecanismos patogénicos das mutações da parkina, avaliando a dinâmica de formação e degradação de agregados pelo UPS e determinar os efeitos das mutações na capacidade de degradação do UPS e sua relação com a morte neuronal.
Foi desenvolvida com sucesso uma abordagem para delimitar a posição intrónica dos breakpoints
das deleções. Foram criados modelos celulares que expressam a proteína wild-type e mutante e foi
realizada a sua caracterização ao nível do mRNA e da proteína, assim como, a formação de agregados, viabilidade celular e actividade do proteossoma.
Os nossos resultados demonstram que as diferentes mutações estudadas não afectam a viabilidade celular, resultando no entanto, em diferenças no número de células com agregados nos mutantes N52MfsX29, L358RfsX77 e R275W, assim como, no número de agregados em cada célula. Demonstramos também que a inibição do proteossoma tem efeito tanto na diminuição da viabilidade celular como no aumento da formação de agregados.
O estudo dos mecanismos celulares que resultam na disfunção neuronal é crucial para a identificação de potenciais alvos terapêuticos para a doença de Parkinson.
1
1.
Introduction
Neurodegenerative diseases are a large group of heterogeneous disorders characterized by slowly progressive loss of neurons in the central nervous system (CNS), which leads to deficits in specific brain functions (e.g. memory, movement, cognition) and results in heterogeneous clinical and pathological expression (Przedborski et al., 2003). Neurodegenerative diseases are a major cause of morbidity, disability and mortality, being a fundamental issue for both medical care and research for the 21st century. These disorders are becoming more common, largely as a result of increased life
expectancy and changing in population demographics (Skovronsky et al., 2006). Neurodegeneration may precede clinical manifestations by many years and the mechanism that drives chronic progression of neurodegenerative diseases remains largely elusive. The major pathological lesion and a common hallmark of neurodegenerative disorders is protein misfolding and subsequent aggregate and inclusion
formation in patients’ affected tissues. Most cases of neurodegenerative disorders are sporadic,
although some genetic forms have also been described. This group of neurodegenerative diseases includes, among others, Alzheimer’s disease (AD), Parkinson’s disease (PD), amyotrophic lateral
sclerosis (ALS), multiple sclerosis (MS) and Huntington’s disease (HD) (Ross and Poirier, 2004).
1.1 Parkinson disease
Parkinson disease (PD) is the most common neurodegenerative movement disorder and the second most common neurodegenerative disease after AD, with a prevalence that increases with age from approximately 1% in population older than 65 years to about 4% over 85 years-old (de Lau and Breteler, 2006).
The aetiology of the disease is an interaction of genetic susceptibility factors and environmental risk factors. Among the environmental risk factors, ageing is the most important factor associated with others like being a male, having European ancestry, exposition to pesticides or drugs like methyl-phenyl-tetrahydropyridine (MPTP). Cigarette smoking and coffee consumption have been shown to reduce the risk of PD (de Lau and Breteler, 2006; Gasser, 2009). The importance of the role of genetic factors in PD development has only been recognized with the identification of genes responsible for monogenic forms of the disease. Until now, sixteen Parkinson disease loci have been identified and, at
2
were by now identified as responsible for autosomal dominant and recessive PD forms. Among the autosomal-dominant forms of PD there are two major genes - SNCA (PARK1) and LRRK2 (PARK8),
and for the recessive forms four genes were identified – PARK2 (PARK2), PINK1 (PARK6), DJ-1
(PARK7) and ATP13A2 (PARK9) (Crosiers et al., 2011; Gasser, 2009). The mutations on PARK2 and
PINK1 are the most frequent causes for autosomal recessive juvenile Parkinsonism (AR-JP). This
thesis focuses in this form of Parkinsonism caused by PARK2 mutations.
1.2 Autosomal recessive juvenile Parkinsonism
1.2.1 Pathophysiology
Autosomal recessive juvenile Parkinsonism (AR-JP) is an early-onset form of Parkinsonism that is usually clinically indistinguishable from idiopathic PD forms. The main clinical manifestations include bradykinesia (slowed movements), rigidity, resting tremor, postural instability and gait impairment. Other clinical manifestations are sensory symptoms like pain and tingling, hyposmia (impaired olfaction), abnormal executive and working memory-related functions and neuropsychiatric symptoms (being the most common sleep alterations, depression and anxiety) (Rodriguez-Oroz et al., 2009; Shulman et al., 2011). However, AR-JP is defined has a distinct clinical entity because diverges from idiopathic PD in the early age-at-onset, mostly in parkin-associated AR-JP. Some authors divide early-onset forms of the disease in AR-JP when age-at-onset is inferior to 20 years and early-onset parkinsonism (EOP) when age-at-onset occurs between 20 and 45 years (Cookson et al., 2003). Other authors classify all the cases with age-at-onset below 40 years as EOP (Hedrich et al., 2001). Nevertheless, most of the early-onset cases with age-at-onset inferior to 40 years are denominated AR-JP (von Coelln et al., 2004). In the context of this thesis, we will use the latter terminology. This disease is also characterized for a very good response to levodopa, however treatment side-effects include the development of early and severe levodopa–induced motor-fluctuations and dyskinesias. AR-JP patients show PD atypical clinical features as early prominent dystonia, symmetric onset of motor symptoms, diurnal fluctuations of symptoms and reflex changes. Also, the disease seems to progress slowly and loss of olfaction or late cognitive decline and dementia, that are characteristic non-motor manifestations of PD, are not found. Another feature is the absence, with a few exceptions, of Lewy bodies (LB), the pathological hallmark of PD, on the neuropathological analysis of AR-JP patients’ brains (Gasser, 2009; Shulman et al., 2011).
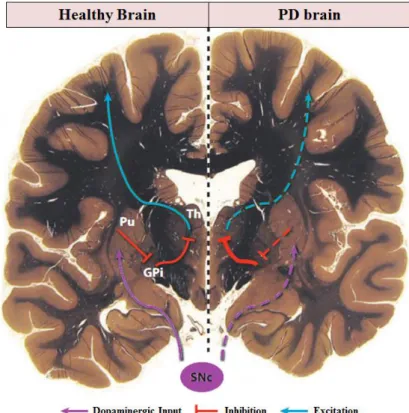
These motor manifestations present in PD are attributable to the progressive loss of dopaminergic neurons in the substantia nigra pars compacta (SNc). As shown in figure 1.1, the reduction of
dopaminergic input to the putamen (Pu), which corresponds to the motor region of the striatum, leads
3
direct pathway, the Pu inhibits the globus pallidus interna (GPi), which inhibits the thalamus (Th).
Thalamus is responsible for the excitatory input to the motor cortex. Also, the indirect pathway that functions to repress movements and is inhibited by the dopaminergic input is enhanced in PD patients.
Figure 1.1: Schematic representation of the neurodegenerative processes affected in PD. Adapted from (Shulman et al., 2011).
When PD motor symptoms are clinically recognized, already 60% of dopaminergic neurons are lost, which results in an 80% depletion of striatal dopamine. This explains why motor symptoms respond well to dopamine replacement therapy and to the direct modulation of basal ganglia activity via the implantation of deep brain stimulators in the subthalamic nucleus. These PD therapies are only effective in controlling the symptoms, delaying disability and extending life expectancy. The non-motor symptoms, however, are not responsive or show a weak response to dopamine replacement, thus contributing to overall patients’ disability. Currently, the impact of PD neurodegeneration in other brain systems is still unclear (Shulman et al., 2011).
4
1.2.2 Genetics
1.2.2.1 PARK2 gene
The Park2 locus was mapped in 1997 to chromosome 6q25.2-q27 (Matsumine et al., 1997). Later, the gene was identified by positional cloning and its encoded protein was named parkin. Parkin encoding gene has only 12 exons but these are surrounded by large intronic regions spanning more than 500 kilobases. The coding sequence with a 1,395-base-pair open reading frame is deposited in the GenBank database (accession number AB009973) (Kitada et al., 1998; von Coelln et al., 2004).
1.2.2.2 Parkin
The PARK2 gene encodes a 465-amino-acid protein with a molecular weight of 51,652 daltons,
named parkin. This protein is ubiquitously expressed, with abundant expression in various brain regions, including the substantia nigra. In a cell, the majority of parkin protein is localized in the
cytosol and Golgi fractions and a small amount in the microsomal fraction (Kitada et al., 1998; Shimura et al., 1999).
Parkin belongs to the RBR (ring between ring) protein family, characterized by the presence of two RING (really interesting new gene) domains, RING1 and RING2, that flank an IBR (in-between RINGs) domain (Marin et al., 2004). Besides these domains, parkin contains an Ubiquitin-like (UBL) domain in the protein N-terminal, from the residues 1 to 76 (figure 1.2). This UBL domain shares 62% homology with ubiquitin (Ub) and may be involved in substrate recognition (Dev et al., 2003). Also, structural information reveals that it binds to the Rpn10 subunit of the 19S regulatory subcomplex in the 26S proteasome. The central domain of the parkin, from residue 145 to 232, has an yet unknown function, however in this region, and additional RING domain was recently recognized, from residue 150 to 215, and named RING0 as it is located upstream of RING1. This RING0 was identified by classic proteolytic biochemistry and apparently has two parts separated by a 26 amino acid linker region. RING0, like the other RINGs present in the RBR domain (residues 238 to 449) and located in protein C-terminal, are cysteine-rich zinc fingers implicated in substrate recognition and binding to E2 enzymes. Parkin also contains a PDZ binding motif that is responsible for interaction with proteins containing PDZ domains like CASK (calcium/calmodulin-dependent serine protein kinase) (Rankin et al., 2011). The parkin promoter has been found to be a bidirectional promoter, also regulating the transcription of parkin co-regulated gene (PACRG) that is upstream of PARK2 and in an antisense
5
Figure 1.2: Schematic representation of the most relevant parkin domains.
Similar to other RING finger proteins, parkin is an E3 ubiquitin ligase (Shimura et al., 2000). E3 ligases are an important part of the cellular machinery that covalently tags target proteins with ubiquitin for degradation by the ubiquitin-proteasome system (UPS). E3 ligases usually confer substrate specificity to the ubiquitination process (which will be further explored in the next section) by bringing the substrate protein into juxtaposition for direct ubiquitination by an E2 Ub-conjugating enzyme (Dev et al., 2003; Moore et al., 2005).
An impaired E3 ligase function may lead to an accumulation of parkin substrates because these proteins cannot be properly degraded and this accumulation contributes to neurotoxicity. This is the reason why, the identification of parkin substrates on the basis of in vitro and cell culture experiments,
has been highly relevant (von Coelln et al., 2004). The first parkin substrate identified was CDCrel-1 (cell division control related protein) which interacts with RING2 domain. CDCrel-1 is a synaptic vesicle-enriched septin GTPase, predominantly expressed in the nervous system and implicated in regulating neurotransmitter release through the inhibition of exocytosis by interacting with syntaxin. Overexpression of CDCrel-1 in SNc neurons of rats by virus-mediated gene transfer induces dopamine-dependent neurodegeneration. Other substrate is Synphilin-1, a protein with unknown
function that interacts with α-synuclein (mutations in which are responsible for a dominant form of
PD). Synphilin-1 is a component of LBs in PD and in related synucleinopathies. This protein interacts with RING2 domain of parkin and when overexpressed in cultured cells, results in protein inclusions.
These protein inclusions also occur when α-synuclein, the major component of LBs, is overexpressed.
An O-glycosylated form of α-synuclein (αSp22) is ubiquitinated by parkin and seems to accumulate in
AR-JP patients brains; however its relevance for the pathogenesis needs further elucidation. Parkin-associated endothelin receptor-like (Pael-R), p38 and Synaptotagmin XI are other parkin substrates. Pael-R is a putative G-protein-coupled transmembrane protein that plays a role in dopaminergic signaling and interacts with parkin by the C-terminal region (residues 217 to 465). This protein is ubiquitously expressed throughout the brain and its overexpression in Drosophila has been shown to
6
regulatory subunit of cyclin-dependent kinase 2 protein, SIM2 that is a transcription factor present in
the nucleus, and others like α/β tubulin and poly-(Q)-expanded huntingtin. Parkin substrates are
diverse, widely distributed and appear to have little in common. Moreover, none of the putative parkin substrates have been reported to accumulate in the brains of parkin knockout mice. These results have questioned the authenticity of these substrates as well as the contribution of parkin to their degradation by the UPS (Moore et al., 2005; Rankin et al., 2011; von Coelln et al., 2004).
In addition to substrate binding, parkin also interacts with E2 enzymes and other proteins, which indicate that parkin may function as a part of a multi-protein complex. Parkin interacts with E2 enzymes through its RING domains. Generally, one RING finger is sufficient for E2 binding, however, the two parkin RING fingers may work in combination and provide a molecular mechanism that allows for the close association of E2 enzymes and the substrate. The ubiquitin-conjugating enzymes interacting with parkin are UbcH7, UbcH8 and the UbcH13/Uev1a E2 heterodimer that is thought to be responsible for the catalysis of K63-linked ubiquitin chains as well as with the endoplasmic reticulum-associated E2s, Ubc6 and Ubc7. AR-JP mutations in parkin gene impair the interaction with E2 enzymes, reducing or abolishing its ubiquitin ligase activity (Chaugule et al., 2011; Dev et al., 2003).
Parkin can be auto-ubiquitinated and in cell–free in vitro assays has been shown to be capable of
multiple mono-ubiquitination. Also, it is capable of K48-linked poly-ubiquitination and K63-linked poly-ubiquitination (Rankin et al., 2011). Recently, it was discovered that the Ubl domain of parkin may function to inhibit its intrinsic auto-ubiquitination activity being the mutations located in this domain responsible for relieving auto-inhibition and leading to a rapid degradation of these proteins by the proteasome (Chaugule et al., 2011). Parkin is degraded by the proteasomal complex (Choi et al., 2000) and has been shown that is a substrate of Nrdp1, also an E3 ubiquitin ligase. Nrdp1 interacts with the N-terminus (first 76 amino acids) of parkin and is responsible for its ubiquitination, thus promoting parkin degradation. This interaction influences the production of reactive oxygen species (ROS), what suggest a potential involvement of Nrdp1 in PD pathogenesis, being a possible new candidate causative factor (Yu and Zhou, 2008). However, a study in a Chinese population did not found any sequence variation in this gene, although further research is necessary (Mo et al., 2010).
1.2.2.3 Parkin mutations and juvenile Parkinson disease
Mutations in PARK2 are the most common cause of Parkinsonism with early-onset. In a European
7
All type of mutations have been described in PD patients, from point mutations resulting in amino acid exchanges (missense mutations) and premature stop codons (nonsense mutations) to deletions and insertions of nucleotides, often resulting in frameshift mutations. Splice site mutations and gene rearrangements involving the deletion of multiple exons, duplications or triplications were also found (von Coelln et al., 2004). Moreover, mutations are found throughout the entire gene including changes in each of its twelve exons. Regardless of their heterogeneity, there are no discernable differences in the clinical manifestations among patients carrying different parkin mutations, although differences in age-at-onset were described for patients with R275W mutation (Lohmann et al., 2003). Gene rearrangements represent 50% of the identified mutations and, when present in the heterozygous state, are not detectable by conventional screening methods like sequencing (Hedrich et al., 2001).
AR-JP caused by mutations in parkin gene is an autosomal-recessive disorder with high
penetrance and with patients showing either homozygous or compound heterozygous mutations that result in parkin loss of function (Gasser, 2009). However, in Parkinsonism the distinction between dominant and recessive forms is unclear. There are several descriptions of families in which parkin mutations and disease segregation are incompatible with a recessive inheritance mode. The role of heterozygous parkin mutations is still not clear: it is a matter of debate if they may cause or increase the susceptibility to late-onset PD. This could be mediated by three mechanisms. One is haploinsufficiency, if half of the wild-type (WT) protein dosage is not enough to preserve normal function. In this case, because it is thought that parkin has a neuroprotective effect, it is possible that this 50% reduction can increase the susceptibility of neurons to toxicity such as oxidative stress. Other possibility is a dominant-negative effect, if the mutant variant reduces the function of the WT protein, for example, if the mutant protein forms a heteromeric complex with the normal molecule, knocking out the activity of the entire complex. The third mechanism is the acquisition of a dominant toxic gain-of-function effect, if the mutant protein acquires a novel and different function (Bossy-Wetzel et al., 2004). Some arguments are in favor for a pathogenic role of the heterozygous parkin mutations: these mutations are more common in patients than in controls, although the frequency of heterozygous mutations in healthy individuals is still unknown and the case-control studies, so far, have variable results; also, the heterozygous mutations are more common in patients than mathematically expected and the mean age-at-onset in heterozygous carriers is between that of patients with homozygous or compounds heterozygous mutations and that of patients without mutations. Also, neuroimaging studies show preclinical changes in heterozygous mutations carriers. On the contrary, the arguments against this theory are that heterozygous mutations are found in controls, however they have not all been neurological examined and there is no clinical follow-up. Moreover, not all heterozygous relatives in affected families show signs of parkinsonism (Klein et al., 2007).
8
substitution in the RING1 domain and mutations that cause the formation of aggresome-like inclusions upon overexpression have been pointed out as possibly having a dominant-negative effect. However, this hypothesis has not yet been supported by parkinsonism mouse models and further studies are required (Klein et al., 2007).
1.2.3 The ubiquitin proteasome system
The ubiquitin proteasome system (UPS) is the main cellular protein degradation system and is capable of targeted degradation of mutant, damaged, toxic or misfolded intracellular proteins, as well as short-lived key regulatory proteins that mediate a number of cellular events such as cell cycling, signal transduction, transcription, neurotransmission, receptor endocytosis, metabolism and the immune response. (Moore et al., 2003) The UPS is responsible for the rapid degradation of 30% or more of newly produced proteins within the cell. This process requests the ligation of ubiquitin, a small covalent modifier that forms a poly-ubiquitin chain on the target protein, becoming a signal for degradation by the 26S proteasome (Tanaka et al., 2004).
Poly-ubiquitination of substrates is the priming event for proteasome-mediated degradation. In this process, the small and highly conserved protein tag, ubiquitin, consisting of 76 amino acid residues, is covalently attached to the target protein through an ATP-dependent enzymatic pathway that occurs by sequential steps catalyzed by three enzymes. First, the ubiquitin is activated by an ubiquitin-activating enzyme (E1), which forms a thiol ester bond between a cysteine residue and a carboxy-terminal glycine of ubiquitin in an ATP-dependent manner. Then, the activated ubiquitin is transferred to one of the several ubiquitin-conjugating enzymes (E2) through the formation of another thiol bond. In the last step, ubiquitin is ligated to the substrate by an interaction of C-terminal glycine residue of
ubiquitin with ε-amino groups on side chains of lysine residues of the target protein that is bound to an
E3 ligase, like parkin. The E3 ubiquitin ligases bind both the E2 and a specific protein target to which the ubiquitin is covalently attached, transferring the ubiquitin from the E2 to the substrate. Each step of this process becomes more restricted in its substrate, being the E3 ligases determinants to confer specificity to substrate recognition (Betarbet et al., 2005; Moore et al., 2003). It is the successive repetition of this process that links additional ubiquitin molecules into the previously attached ubiquitin resulting in the formation of poly-ubiquitin chain that is the degradation signal recognized by the proteasome, requiring a chain of, at least, four ubiquitin molecules (Berke and Paulson, 2003). In 1999, Koegl et al. identified and described one protein that could be a novel ubiquitination factor,
9
independently of whether the substrate-bound ubiquitin will signal for proteasomal proteolysis, endocytosis or other fate. So, additional factors are necessary, like the subcellular localization of the substrate or the number and topology of the substrate-conjugated ubiquitins. There are a total of seven lysine residues on ubiquitin (at positions 6, 11, 27, 29, 33, 48 and 63) and the poly-ubiquitination could occur through alternative lysine residues (Dawson, 2006). There are at least three ways to ubiquitinate a protein: if substrates are destined for the proteasome, they generally are conjugated to a poly-ubiquitin chain in which successive ubiquitins are linked through an internal lysine residue (K48) to the terminal residue (G76) of a new ubiquitin monomer by isopeptide bonds forming a K48-G76-linked poly-ubiquitination chain. However, when this ubiquitin molecules chain is K48-G76-linked through lysine 63 by K63-G76 bonds, the destination could be probably non-proteolytic, like clearance by autophagy (Tan et al., 2008). Other ubiquitination process is multi-mono-ubiquitination, where occurs the attachment of multiple molecules per protein but only one ubiquitin per lysine residue, being responsible for regulating transcription, translation, protein trafficking, DNA repair and other cellular functions. The specificity in signaling is mediated by the ubiquitination process. The recognition of substrates for ubiquitination is governed by the presence and accessibility of primary sequence or structural motifs in the substrate, known as ubiquitination signals, recognized by the E3s (Pickart, 2001). The E3s are central determinants of specificity because they play an important role in the selection of target proteins for degradation by binding the substrate with a degree of selectivity for ubiquitination in a temporally and spatially regulated fashion (Tanaka et al., 2004). The E3s are classified in several groups: one share the HECT domain that harbors a 350-residue region with a strictly conserved cysteine residue forming an essential thio-ester bond for binding ubiquitin (Pickart, 2001). The major group of E3s, designed RING-type E3, share a RING finger domain capable of binding Zn2+ of approximately 70 residues consisting in a cysteine-rich consensus sequence flanked by
one or two histidine residues. There are typical and atypical forms of this RING-finger motif, dividing the typical in three classes with small differences in their structure: RING-HC (C3HC4), RING-H2 (C3H2C3) and RING-IBR-RING where parkin belongs. The third group of E3s shares a U-box domain whose tertiary structures are similar of the RING-finger domain but do not show a binding potency to Zn2+ that is probably necessary for keep the domain structure in RING-type E3s. The last
group consists of very unique E3s that have no sequence homology to known E3 enzymes (Tanaka et al., 2004).
After the labeling of unwanted/damaged proteins with chains of activated ubiquitin molecules, the ubiquitinated proteins are transported to the proteasome by chaperone molecules like heat shock proteins (HSP) and then are recognized and unfolded by proteasome regulators, followed by an ATP-dependent degradation of unwanted proteins by the proteasome (Olanow and McNaught, 2006).
10
(Finley, 2009). CP is a barrel-like structure made up of 28 subunits arranged into four hetero-heptameric rings, two inner rings and two outer rings, each one made up of seven structurally similar
α- and β-subunits associated in the following order, αββα (Betarbet et al., 2005; Tanaka et al., 2004).
Each inner ring is formed by β-type subunits, three of which have catalytically active threonine residues at their N-terminus being proteolytic active sites (β1, β2 and β5) that can cleave a broad range
of peptide sequences. β1 prefer to cleave on the C-terminal side of acidic residues, β2 after tryptic
residues and β5 after hydrophobic residues, being the site specificities generally classified as caspase
-like, trypsin-like and chymotrypsin-like activities. These three different catalytic sites of the proteasome reside on the inner surface of the inner rings, thus preventing unselective degradation of proteins (Finley, 2009). The two outer rings containing the α-subunits serve to anchor the two RPs (Moore et al., 2003) which are attached to both ends of the central core in opposite orientations to form the enzymatically active 26 proteasomal complex (Tanaka et al., 2004). It is in this hollow cylindrical structure with an interior space whose largest dimensions are approximately 100Å axially and 60Å along the orthogonal symmetry axis that proteolysis occurs. The 19S regulatory complex consists of two sub-complexes known as the base and the lid which correspond to the portions proximal and distal to 20S proteasome. The base is composed by six paralogous ATPases (Rpt 1 - 6), which are critical for the 19S-20S complex formation, and four non-ATP subunits, the scaffolding proteins Rpn1 and Rpn2 and the ubiquitin receptors Rpn10 and Rpn13. The base of the 19S complex has three ATP-dependent functions: recognize the poly-ubiquitin chain, which is removed and cleaved into monomers by deubiquitinating enzymes (DUBs), unfolds the target proteins and translocates them through the opened channel of the 20S proteasome. The lid of the 19S is a 400-kDa complex made up of multiple non-ATPases subunits like Rpn3 that can be released from the proteasome or rebind under certain conditions. The role of the lid is still unclear but it is necessary for proper degradation of the target proteins (Glickman and Ciechanover, 2002). Considering the nine lid subunits, only Rpn11 has a known function, being a DUB. Besides the 19S complex, the most studied proteasome activator of the 20S core is the 11S regulator (PA28), a heteromeric complex of 28-kDa subunits. PA28 activator
is a complex of two alternating subunits, PA28α and PA28β, which associate with the α-subunits of
20S proteasome at both or either ends and opens the channel of the 20S core but via an ATP-independent process. Beyond the lack of ATPase activity, PA28 also lacks the ability to bind ubiquitin conjugates. The 11S-20S proteasomal complex has been suggested to mediate the degradation of non-ubiquitinated short peptides including oxidized proteins. PA28 is also known to modulate proteasome-catalyzed production of antigenic peptides presented to the immune system on MHC class I molecules (Betarbet et al., 2005; Finley, 2009).
11
entry into the proteasome, ubiquitin chains are detached from proteins and cleaved into monomers by deubiquitinating enzymes such as ubiquitin C-terminal hydrolase L1 (UCH-L1) that has also been associated with familial PD. When this deubiquitination process is blocked, degradation is inhibited and ubiquitinated substrates accumulate leading to cell death (Betarbet et al., 2005; Finley, 2009). A simplified scheme of the sequential steps needed for the targeted degradation of proteins by the UPS is presented in figure 1.3.
Figure 1.3: Schematic representation of the steps involved in the targeted degradation of proteins by the UPS. Adapted from (von Coelln et al., 2004).
Since proteasomes are present in the cytoplasm (associated with centrosomes, cytoskeletal networks and the outer surface of the endoplasmatic reticulum), in perinuclear regions and nuclei of all eukaryotic cells (Betarbet et al., 2005), these are the locations where aggregates of proteasomes accumulate when the proteolytic pathway is impaired.
1.3 Molecular pathways of neurodegeneration in PD
1.3.1 The relationship between UPS and Parkinson disease
12
ubiquitin-positive protein aggregates is a common ultra-structural feature of many neurodegenerative diseases like PD (Um et al., 2010). These diseases caused by aggregate-prone proteins are known as proteinopathies (Rubinsztein, 2006). Initial protein aggregation could lead to an accumulation of these aggregates by a chronic imbalance between the generation and clearance of misfolded proteins that could happen if the UPS function is impaired (Bence et al., 2001; Chin et al., 2010). Protein aggregates are thought to impair cell function and viability through a variety of mechanisms, including pore formation, proteasome inhibition and disruption of intracellular transport (Chin et al., 2010). Thus, it is thought that the protein quality control system (composed by the cellular machinery that monitors the quality and levels of the proteins in the cell) plays a critical role in neuronal function and survival, being the UPS one major arm of this quality control (Berke and Paulson, 2003). Also, it is known that proteasome inhibitors increase the frequency of ubiquitin-positive intracellular inclusions in neurodegenerative disorder cell models (Tanaka et al., 2004).
13
Protein inclusions, such as aggressomes, can be experimentally induced by proteasomal inhibition in neuronal and non-neuronal cells. Immunocytochemical analyses have reported that parkin is present in the cellular inclusions after exposure of cells to proteasome inhibitor. However, AR-JP is not accompanied by obvious LBs formation (Imai and Takahashi, 2004). Thus, it was suggested that parkin may promote the formation of LB inclusions being this, one mechanism to detoxify proteins
such as α-synuclein or that parkin-mediated neurodegeneration may occur by mechanisms distinct
from those that happens in PD with LBs (Dawson and Dawson, 2003; Feany and Pallanck, 2003). In addition to cytoplasmatic inclusions, further clues that associate a dysfunction of UPS to PD pathogenesis is that, in sporadic PD, levels of 20/26S proteasomes and proteasome activity are reduced in vulnerable regions (Rubinsztein, 2006). But, the major proof is the presence of genetic mutations directly associated with UPS. These occur in parkin and UCH-L1. Since parkin is an E3, the ubiquitin pathway is directly linked to the cause of AR-JP. It is known that mutants of parkin alter the solubility of parkin, increasing its tendency to aggregate (Rogers et al., 2010). In 2008, a study of pathogenic mutations revealed that misfolding and aggregation is characteristic for C-terminal deletion mutants, but alterations in the solubility and formation of parkin aggregates has also been reported for various parkin missense mutations. However, even wild-type parkin is prone to misfolding under severe oxidative stress (Schlehe et al., 2008).
It is thought that a lack of parkin function lead to a toxic accumulation of substrate proteins or parkin itself. Parkin targets a number of substrates that have intrinsic toxic and aggregation properties
in vivo such as the O-glycosylated form of α-synuclein and α-synucleinP22. Parkin also supresses the
toxicity of Pael-R (which when overexpressed elicits a marked ER stress response), of mutated α -synuclein A53T and of a poly(Q)-expanded mutant of ataxin-3 (Khandelwal and Moussa, 2010). Other substrates ubiquitinated by parkin that may exert a direct cytotoxic effect on accumulation includes
α/β-tubulins, which in the free, monomeric form are toxic (Kahle and Haass, 2004; Ren et al., 2003), and cyclin E which might force postmitotic neurons into abortive cell cycling, promoting apoptosis. Overexpression of parkin decreases sensitivity to proteasome inhibitors on an E3 ligase activity-dependent manner and also, the knockdown of parkin increases sensitivity to proteasome inhibitors (Petrucelli et al., 2002). Parkin is thus considered a broad neuro-protective agent against a wide range of toxic injuries from proteasomal dysfunction to substrate toxicity (Feany and Pallanck, 2003).
1.3.2 Mitochondrial impairment and oxidative stress in PD
14
mitochondria have been found to interact with many specific proteins implicated in genetic forms of neurodegenerative diseases. They were first implicated in PD because of MPTP whose metabolite, MPP+, inhibits complex I of the mitochondrial electron-transport chain, causing parkinsonism (Lin and
Beal, 2006). Impaired complex I activity leads to free radical stress and makes neurons vulnerable to glutamate excitotoxicity. One proof that mitochondrial impairment may be central to the pathogenesis of PD is the fact that defects in complex I as well as three complex I inhibitors cause dopaminergic cell death and induce the formation of LB-like filamentous inclusions containing α-synuclein (Dawson and Dawson, 2003). The mechanism of toxicity in these complex I inhibition models probably involves oxidative stress. Complex I inhibition and oxidative stress are factors contributing to ageing and were shown to be relevant to PD when complex I deficiency and glutathione depletion were found in the substantia nigra of patients with idiopathic or with pre-symptomatic PD (Lin and Beal, 2006).
Parkin has been shown to be located, in part, in mitochondria. It is though that this protein acts directly at the mitochondria through its ubiquitination activity, confirmed by a study in 2010 (Fitzgerald and Plun-Favreau, 2008; Lee et al., 2010).
15
1.4 Aims
Large PARK2 deletions account for 50% of the mutations identified in patients with AR-JP of
Portuguese origin. Thus, the first aim of this study was to determine the breakpoints of the deletions found in Portuguese patients in order to identify the genomic mechanism underlying these gene rearrangements.
16
2
Materials and Methods
2.1
Large deletions breakpoint determination
Large PARK2 deletions are responsible for about 50% of the Parkinson disease mutations. We
have previously characterized a sample of Portuguese patients showing Parkinson disease symptoms regarding PARK2 mutations and were able to identify several large deletions through multiplex
dependent ligation probe amplification (MLPA). PARK2 gene presents very large introns which makes
the determination of deletion breakpoints a hard task. In order to overcome this difficulty several strategies were applied as outlined below.
2.1.1 Subjects
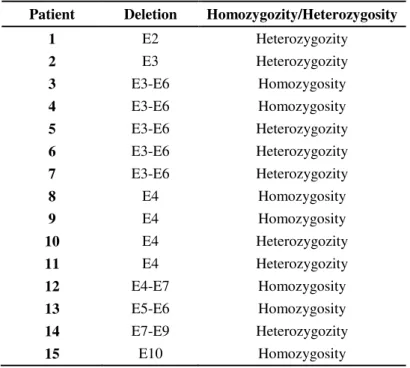
Fifteen patients showed large gene rearrangements and at least eight different deletions were found either in homozygosity (present in the two alelles) or in heterozygosity (only in one allele) as shown in table 2.1.
Table 2.1: List of patients with respective deletions in study.
Patient Deletion Homozygozity/Heterozygosity
1 E2 Heterozygozity 2 E3 Heterozygozity 3 E3-E6 Homozygosity 4 E3-E6 Homozygosity 5 E3-E6 Heterozygozity 6 E3-E6 Heterozygozity 7 E3-E6 Heterozygozity
8 E4 Homozygosity
9 E4 Homozygosity
10 E4 Heterozygozity 11 E4 Heterozygozity 12 E4-E7 Homozygosity 13 E5-E6 Homozygosity 14 E7-E9 Heterozygozity
17
2.1.2 Approach 1: Verification of breakpoints already described 2.1.2.1 Primer design
Some of the deletions identified in Portuguese patients have been already identified in other
patient’s populations and their breakpoints characterized. In order to verify the presence of these
breakpoints among Portuguese patients, primers at approximately 0.5Kb distance of the deletion breakpoints (of the same exons in study) described in three previously published papers (Asakawa et al., 2009; Clarimon et al., 2005; Mitsui et al., 2010) were designed using IDT PrimerQuest (http://eu.idtdna.com/Scitools/Applications/Primerquest/) with the following settings: optimum primer size of 24nt ± 6nt; optimum primer TM of 60ºC ± 5°C and optimum primer GC% of 50% ± 15%. The
list of primers designed is presented in table 2.2.
Table 2.2: List of primers designed for the breakpoints described.
Deletion Forward Reverse
E2 TTTGTGGCTGTTTGGTGTGATGGG AGTTGTGTGACCACAGGAGCATCA
E3_1 AACACACCTGGACACACTGGTGAT CTCACTTCATCAAACACAGCGGCA
E3_2 AGAGGCTCCACCTCTTCATGCAAT AGGACACCTTGCTTTGGAGCCTTA
E3_3 AAGAGAGATGGGTGAGGGAACTTG CATACACAACTGGGAAGGAGCCTA
E3_4 TATGTATGAATGGCAGCCAGCCCA TGGCAAATGCATTCTCACCATCCC
E3_5 CTGGCCTCTGCTTTCAGGCAATTT TGCGTCCAAATCCCAGTGAAGAGT
E3_6 TGAATGTAGCCAGCCACCTCACTT TAGGTGGTGCTAAGTGAAGCCACA
E3_7 AGTTGCTCTTAGCTCTGCCTCGTT TCACTTCATCAAACACAGCGGCAC
E3_8 ATCTGCTTAAAGCCAGGTGCAGTG TCCTCTAACCATGTGAGGCAGCAA
E3_9 CGGCCACATCGATTTACTGAGAGA CCACCACCACTTAACCACAAAGTG
E4_1 ACCTTCAGGTAGAGGTCAAGCACA ATGTCTGCAGTAGGTGCACACGAA
E4_2 TCAGGCAAGCATCAGATGGAGACA AGCTCCCTTGGGACCTCTTGAAAT
E4_3 ATGTGGCTTCACTTAGCACCACCT TACACACACTGCTTTCCAGACCCA
E4_4 AAGAGGTTGGGCTTCTGTTACGGT ACCTCTCAGCCAAGCCTTACTGTT
E4_5 TCATGCCAGCAGCTCCTTATCAGT TGCCAGACATGCATTGTGTTCTGC
E4_6 TGGGTCTGGAAAGCAGTGTGTGTA TGCCTACCAAGCTCTGAAACACCA
E4_7 TTCTGTGTCCATGTGGAGTTCCGT TTGGAACTGACCAGGAAGGAGCAT
E3-6 ATGCTCAGGACATAGGAGGCGAAT TCCCACAGTGATACCTGTCATGGA
2.1.2.2 Polymerase chain reaction
18
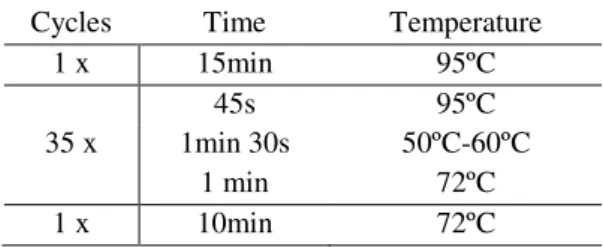
Table 2.3: PCR protocol for fragment amplification.
Cycles Time Temperature 1 x 15min 95ºC
45s 95ºC
35 x 1min 30s 50ºC-60ºC 1 min 72ºC 1 x 10min 72ºC
After PCR reaction, the products and a blank control were checked for fragment amplification and for the presence of possible contamination, respectively, by electrophoretic separation in a 2% agarose gel in 1x TAE buffer and 0.5 µg/ml Ethidium Bromide. A GeneRuler 100 bp DNA Ladder (Fermentas) was used to define the size of the fragment. Loading dye was added to the DNA samples and gels were run at 120 V.
2.1.3 Approach 2: Range of primers that cover the introns
2.1.3.1 Primer design and PCR amplification
To determine the extension of the deletions present in homozygosity we designed a set of 45 primer pairs covering the two introns surrounding the deleted exons. These primer pairs, which are shown in table 2.4, were designed to amplify a region of between 214 and 632bp and each amplicon was design with approximately 30 Kb of distance from each other.
PCR amplification and fragment analysis was performed as described in 2.1.2.2.
Table 2.4: List of primers designed to cover the relevant introns.
Int Fw Sequence Rv Sequence Product
19
4.2 TATGCTTGCTGTCTCTGACGCTGA TGCAGCATTTGGTTAATCCCTGGC 3964.3 TCGTCTTGTTGGCCCGATTACTGA CACTGGTTGATGCAGCATGTGGTT 264 4.4 TCCACTCACCCACTTGAAGCAGAA CCAAGGCAGAGCCAGTGTTTGTTT 420 4.5 TGAAAGGGCAGACACAGAAGTGGA ATCATCCCAGCAAGATGGACCCTT 355 6.1 TTATGCCAACGCCCTCACTAACCA TACCGTGGACCTGCAATCACTGTT 393 6.2 AACCCATGCCCAGGAGATAACTGT TGATGTGGTTAAATGCCAGCAGCC 444 6.3 AGACAGCTTGGAAGCGGATCTGAA TTACATGCCTTGCCTCTGAGTGGA 397 6.4 GAGCTTTGTGCTGTCCAACTGCAA TGTTACTATTGCCTCAGCCACCCT 240 6.5 TTTGAGAGGCCTCACTTGTGCCTA TGAGGTGGCATTGGAGATATGCCT 272 6.6 TGCATTGGAGTGTTCCGTCCTACA TATCGCACACAGGAACAGCACTCA 373 7.1 TCCTCATTGGGTTGAGGGATGTGT TCTGAAGCAGTTGAGGACGTTGGA 274 7.2 ATAGGGAAAGCCCACCTGTTCCTT ACCTGTGACTTCCTGCCTCAGTTT 475 7.3 GGGAATGAAAGTGGGCTGCAATGT TAAAGTTCCCAGTGAGGCACCTGT 416 7.4 TTCCAGCCTGGTCTCCAAACAGAT TCTGGAAACTGGGAAAGGGTTCCA 264 7.5 AGTCTGTCAACTCAAGCCTGGTCA GCAGCTGCTTATGCTTAGCTGTGT 224 7.6 ATGCTGTACACAACATGTGCCTGC AAACCTGGCATTCGGGACAATGTG 378 7.7 CACAAACTTGTGAGCACGGCATGA AAAGATTCCCGGCAGCATCTCTGA 373 8.1 AGTTCCAGGTGAGCCCTTCAGAAA ATGCTCTTCTGCCCACTCCCATAA 385 8.2 GGCTTAAACTGTCCATCTGCGCTT AACCTCTGCAGGGAAGGTGAGAAA 433 9.1 AAGCTGCAGAGAGCTCAGAACAGT AACCTGGATTGCATGACCCGTACT 514 9.2 AAACTGCCTCCCTGAAACATGCAC ACTGGGCTTATTGAGAGGCACACA 386 9.3 AAGGCAGCTCTGTGAGGTGCTAAT TCTGACCATCAGGGACAGGCAAAT 282 9.4 TTACACCTGGGACCTGCTGCATTA AATGCATGGGTCATGTGGAAACCG 491 9.5 AGCCAGGAGATTGTGAGGGTCATT ACTGCCAAGTCTATGCCTGTTCCT 271
10.1 AGCAGGATGGTGTGGTAAAGGACA AAGGAGTCTGCAGTGAGCCAAGAT 275
10.2 AACAGGCAAGAGGGAATCGAAGGA ACCCATCACAGCTAGGCTGAAACT 588
10.3 CAAGGGTGTTTCCTTTGTGCCCAT AATCTGGTACACAGCAGGCGATCA 310
2.1.3.2 Long-range PCR
After reducing the possible extent of these deletions, the pair of primers closest to the deletion was used for PCR amplification. As the amplicons were probably greater than 2 Kb, the enzyme used was ExpandTM Long Template PCR System (Roche). PCR amplification was performed with a mix of:
0.75 µL of Long polymerase, 5 µL of buffer 3, 1.75 µL of dNTP’s (10mM), 6 µL of each primer
(forward and reverse), 4 µL of DNA sample and 26.5 µL of ddH2O to make a final reaction volume of 50 µL. PCR amplification parameters are presented in table 2.5, and are different from those used for HotStar Master Mix enzyme for fragments under 2Kb.
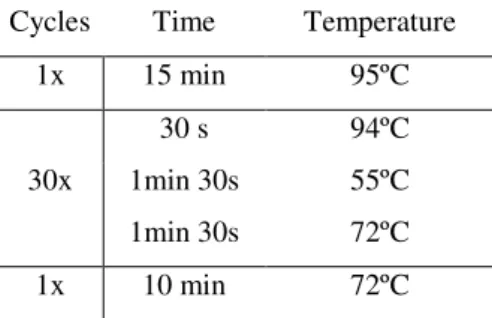
Table 2.5: PCR protocol for the amplification of fragments larger than 2 Kb.
Cycles Time Temperature 1 x 2 min 94ºC
10 s 94ºC 10 x 30 s 50ºC-60ºC
20 min 68ºC 15 s 94ºC 20 x 30 s 50ºC-60ºC
20
DNA fragments and the control blank were checked by electrophoretic separation in a 0.8% agarose gel in 1x TAE buffer and 0.5 µg/ml Ethidium Bromide. Two size markers were used to define the size of the fragment, the 1Kb DNA Extension Ladder (Invitrogen) and the GeneRuler 1kb DNA ladder (Fermentas). 50 µL of DNA samples with loading dye were applied in 200mL gels that run at 120 V.
2.1.3.3 Isolation and purification of DNA fragments from agarose gels
After electrophoretic separation, DNA fragments of interest were excised from the agarose gel on a Transilluminatorand purified with the Illustra™ GFX™ PCR DNA and Gel Band Purification Kit
(GE Healthcare) according to the manufacturer’s instructions.
2.1.3.4 Sequencing
In order to determine the deletion breakpoints at the nucleotide level, isolated and purified fragments were sequenced. When samples were obtained directly from PCR amplification (and not from purified fragments removed from agarose gels), an additional step of purification before sequencing was required. To purify these products, 1 µL of PCR product was added to 0.5 µL of ExoSAP (USB Corporation). The mixture was exposed to a temperature of 37ºC for 15 minutes and then, at 85ºC for 15 minutes, resulting in a maximized enzyme activity followed by its inactivation.
Direct sequencing reactions of both strands were performed with BigDye Terminator v1.1 Cycle Sequencing Kit (Applied Biosystems) using 2 µL of BigDye, 0.5 µL of primer (forward or reverse), 1.5 µL of purified DNA fragment and 6 µL of ddH2O to a final reaction volume of 10 µL. Forward and reverse sequencing are separated reactions. The sequencing reaction parameters are shown in table 2.6.
Table 2.6: Sequencing Protocol.
Cycles Time Temperature 1x 5 min 95ºC
21
Sequencing products were purified with the DyeEx Spin Kit (Qiagen) according to the
manufacturer’s instructions and the fragment sequencing was done by capillary electrophoresis in an
ABI-PRISM 3130 XL automatic sequencer (Applied Biosystems).
2.1.4 Approach 3: Single nucleotide polymorphism (SNP) analysis
2.1.4.1 SNP selection
Another approach to narrow the extension of the deletions (in homozygosity and heterozigosity) was the design of a SNP assay. SNP genotype data for parkin gene was obtained through the HapMap Genome Browser (release#24 - phase1&2 full dataset) (Frazer et al., 2007). This data was analyzed with Haploview v4.1 software (Barrett, 2009). 114 SNPs, localized in the introns of interest, were selected taking in account the higher MAF (minor allele frequency) of SNPs and the distance to the previous SNP selected (approximately 10Kb). For each intron several SNPs were selected as shown in table 2.7.
Table 2.7: List of selected SNPs.
Introns SNPs Introns SNPs Introns SNPs
Intron 1 rs1893116 Intron 4 Intron 7 rs3765474 rs1893114 rs13191078 rs910177 rs6934419 rs9295182 rs9458315 rs2846507 rs2156267 rs12210797 rs13206396 rs4412175 rs1024189
rs9365465 rs1893551 rs10945764 rs2846546 rs1954926 rs12210817 rs1893119 rs1954925 rs9355922 rs2846510 rs9347590 rs9346876 rs2803097 rs3892751 rs13220282 rs2803087 rs9347591 rs1018462 rs2023037 rs6455801 rs11755949
Intron 2
rs7744798 rs9365375 rs9365323 rs11964364 rs6904579 rs10945778
rs4235935 rs713054
Intron 9
rs952388 rs9365377 rs4574609 rs4709595 rs9456748 rs9365285 rs7771045 rs2023078 rs4708909 rs4708953 rs4709579 rs13211741 rs9347623 rs9295184 rs4709526 rs6935149 rs12529283 rs12154057
rs10945815 rs1886237
rs12205305
Intron 6
rs3016551 rs4709531 rs962900 rs7739802 rs12175609 rs12192200 rs6455775 rs9458289
22
Intron 2 rs4709605 Intron 6 rs6922518 Intron 9 rs577876 rs6937352 rs12528179 rs517010 rs2205624 rs2155486 rs12209107 rs9356016 rs6937081 rs506428 rs6923741 rs9456721 rs12198566Intron 3
rs10945803 rs9355368 rs2023074 rs9355371
Intron 10
rs4546464 rs9347562
rs957374 rs9364627 rs6942109 rs7766877 rs9458419 rs7766508 rs6935521 rs7746164 rs6907632 rs2096982 rs1790022 rs9347502 rs1954939 rs1784597 rs3890730 rs9365393 rs1626020
rs9355994 rs1784588
2.1.4.2 SNP genotyping
For genotyping we have used the SNaPshot assay (Applied Biosystems), which was applied for the genotyping of the SNPs located in introns 2, 3, 4 and 6. For the remaining introns, and since the number of samples to be tested was small, SNPs were genotyped by PCR amplification and sequencing (as described in 2.1.2.2 and 2.1.3.4).
SNaPshot is a technique specifically used for determining SNP variants and includes a multiplex PCR amplification of the regions containing the SNPs, a purification of the PCR products, a
single-base extension (SBE) of the 3’end of unlabeled primers located immediately upstream of the SNPs
site, using four fluorescently-labelled dideoxynucleotide triphosphates (ddNTPs) which will emit a specific fluorescence for each ddNTP (Bardien et al., 2009). Finally, the last step is a final purification before products are separated by capillary electrophoresis in an automatic sequencer that records the fluorescence emitted by the ddNTPs.
2.1.4.2.1 Amplification primers and SBE-primer design