Rui M. L. Ferreira(1), Mário J. Franca(1), João G. B. Leal(2)and António H. Cardoso(1)
(1)
CEHIDRO-Instituto Superior Técnico, TULisbon, Av. Rovisco Pais, 1049-001 Lisboa, Portugal; [email protected]
(2)
Dept. Civil Engr. and IMAR-CMA, University of Coimbra, Pólo II, 3030-788 Coimbra, Portugal; [email protected]
(3)
Dept. of Civil Engineering, Faculty of Sciences and Technology, UNL, Quinta da Torre, 2829-516 Caparica, Portugal; e-mail: [email protected]
(4)
CEHIDRO-Instituto Superior Técnico, TULisbon, Av. Rovisco Pais, 1049-001 Lisboa, Portugal, [email protected]
ABSTRACT
The present work is aimed at the study of near-bed organised turbulence over mobile and immobile, porous, hydraulically rough boundaries. The bed was permeable and composed of non-cohesive sediments. Two data sets were analysed, characterised by the sameu*. The mobile bed data featured generalised sediment transport for all size
fractions smaller than the d90. The fixed bed was obtained as result of an armouring
process. Comparison of these data sets reveals differences on such parameters of the bursting cycle as the maximum shear stress and the transported momentum. These results point to a reorganization of turbulence, in the near-bed region, when the bed is mobile. The impacts of these reorganization are discussed, namely in what concerns the third order moments of the distributions of the velocity fluctuations.
Keywords: Turbulent coherent structures, Laser Doppler Anemometry, mobile bed.
1 INTRODUCTION
Bursting phenomena form a class of coherent structures, i.e., organised turbulence, responsible for generating turbulent energy and shear stress (Grass 1971, Nakagawa & Nezu 1977). The complete cycle is composed by an ejection event and a sweep event, mediated by outward or inward interactions.
Accurate visualization techniques and non-intrusive measuring capabilities allowed for more sophisticated detection techniques and for advances in phenomenological descriptions of coherent turbulence (Franca & Lemmin 2006, Hurther et al. 2007) and fluid-particle interactions (cf. e.g. Nelson et al. 1995, Ferreira et al. 2002). In spite of these conceptual progresses, the increased mobility of coarse size fractions in the presence of finer fractions in the bedload (MacAuley & Pender (1999) and Ferreira (2005), pp. 139-151, among others) remains to be fully understood.
near-bed turbulence promotes a greater transfer of momentum to the near-bed and, thus, increases the probability of entrainment of coarse particles.
The present work pursues this line of research and is aimed at the identification of the differences exhibited by organized turbulence in the inner layer of open-channel flows over mobile and immobile beds. The latter is porous and hydraulically rough. In particular, it is sought to evaluate the statistical characteristics of sweeps and ejections over mobile and immobile beds, both in the roughness dominated layer and in the upper region of the logarithmic layer.
To accomplish these objectives, two sets of instantaneous velocity data, corresponding to mobile and immobile beds, were obtained with LDA instrumentation in an open-channel. Nakagawa & Nezu’s (1977) quadrant threshold analysis was modified to detect sweep and ejection events. Relevant statistics of the events were computed and analysed. The two sets of data have, approximately, the same value of the friction velocity,u*, in order to overcome normalization errors.
2 LABORATORY FACILITIES AND INSTRUMENTATION
The laboratory data were obtained at a 12 m long and 40 cm wide recirculating and tilting flume with glass side-walls. The bed was permeable and composed of cohesionless sediments. Two sets of data were obtained. Set E1 was obtained under uniform flow and recirculation conditions. E1D was an armoured bed test (details in Ferreira 2005, pp. 68-73). To maintain approximately the same mean bed shear stress in both data sets, the slope was slightly adjusted.
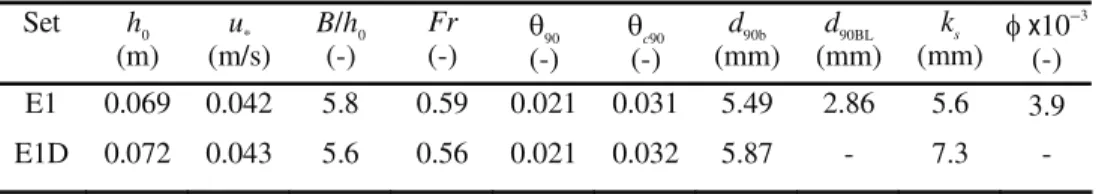
Two orthogonal components of the instantaneous flow velocity were measured with a monochromatic He-Ne forward scatter Laser Doppler Anemometer operated at 240 Hz. A laser bed-profiler was employed to evaluate the bed texture and the water depth and the bed elevation were measured with a 0.5 mm precision point-gage. Sediment discharge was computed from dry-weighted samples. For both data sets the flow discharge wasQ= 13,5 l/s, the initial bed slope was i0 = 0.0025. The remaining main features of the two experimental data sets are shown in Table 1.
Table 1. Main characteristics of the data sets. Set h0
(m)
u*
(m/s)
B/h0
(-)
Fr
(-) θ90 (-)
θc90 (-)
d90b
(mm)
d90BL
(mm)
ks
(mm)
φx10−3
(-) E1 0.069 0.042 5.8 0.59 0.021 0.031 5.49 2.86 5.6 3.9
E1D 0.072 0.043 5.6 0.56 0.021 0.032 5.87 - 7.3
-In Table 1h0is the water depth,u*is the friction velocity,B/h0is the aspect ratio,
Fris the Froude number,θiis the Shields parameter for the size fraction represented
by the diameter di, θci = θcξi, is the critical Shields parameter computed from the
initial bed mixture (incorporates an hiding-exposure coefficient, ξi, Ferreira et al.
2007) whereθc= 0.05,ksis the roughness scale (computed asinFerreiraet al. 2008);
BL
3 DATA ANALYSIS
3.1 Conditional sampling and detection criteria
A conditional sampling technique was employed to identify the events of the bursting cycle. The proposed detection criterion was based on the u' vs. 'v threshold quadrant technique, chosen for its conceptual simplicity. In its standard version (Nakagawa & Nezu 1977), a sweep occurs when, in quadrant IV, u v' ' >σ(IV)h and
an ejection is identified when, in quadrant II, u v' ' >σ(II)h , where σ(IV)h and σ(II)h stand for the detection thresholds (u’ andv’ are the fluctuations of the longitudinal and vertical velocities, respectively).
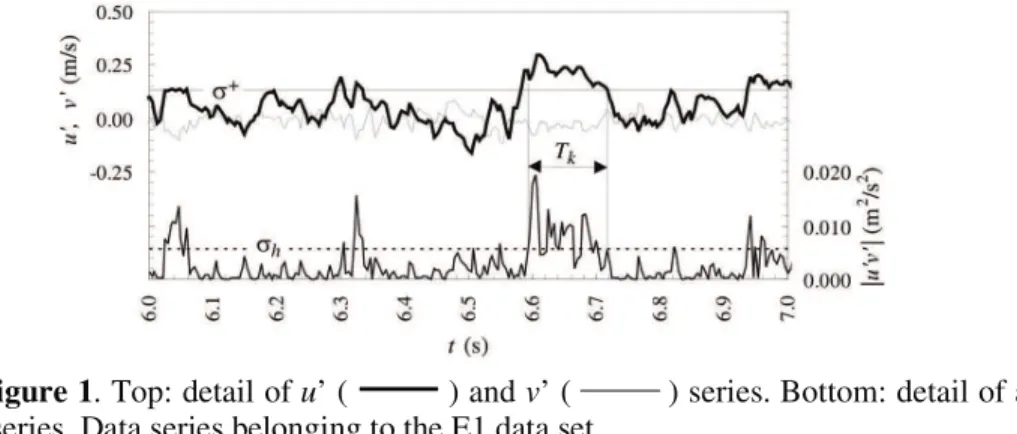
This procedure may lead to faulty characterization: a given turbulent event, seen by direct visualisation, may not be detected as so but as a train of separated smaller events. This is illustrated in Figure 1 where a clear sweep event, occurred betweent
= 6.6 s and t = 6.7 s, features a persistent positive value of u' and an essentially
negative value of v'. Because of the fluctuation in the value of v', this event would be recognised as train of 5 events of smaller duration resulting in underestimation of the values of the mean of the duration and of the period.
Figure 1. Top: detail ofu’ ( ) andv’ ( ) series. Bottom: detail of a |u’v’| series. Data series belonging to the E1 data set.
A simple method to enhance the results of the quadrant threshold method is based on the observation that the persistence of u’ is well correlated with the persistence of the event. The detection of the initiation of ejections or sweeps remains that of the standard quadrant threshold method but the event is considered to last while the absolute value ofu’ is above a given threshold, σ+for sweeps andσ− for ejections. The domains of occurrence of each event, once detected, are:
i) outward interactions,
(I)
', ' : ' 0 ' '
'
h out
Q u v u v u
u
+
σ
= ∈ > ∧ > ∧ <σ
;
ii) ejections,
(II)
', ' : ' 0 ' '
'
h ej
Q u v u v u
u
−
σ
= ∈ < ∧ > ∨ >σ
iii) inward interactions,
(III)
', ' : ' 0 ' '
'
h in
Q u v u v u
u
−
σ
= ∈ < ∧ > ∧ <σ
;
iv) seeps,
(IV)
', ' : ' 0 ' '
'
h sw
Q u v u v u
u
+
σ
= ∈ > ∧ > ∨ >σ
.
After a survey of the data, it was adopted σh(I) =σ(II)h =σh(III) =σh(IV) =σh with
h H urms rmsv
σ = where urms and vrms are the turbulent intensities associated to the
longitudinal and normal velocities, respectively, and H is the hole size. The value of the latter, H =1.7, was determined heuristically and was found to be close to the half-value threshold level (Nezu & Nakagawa 1993, p. 182). The values ofσ+
andσ− depend on the value ofσh. It was adopted σ+ 2.5urms
= andσ− =−2.5urms.
The domains of persistence of each of the events can be seen in Figure 2 for two sets of data taken aty/ks= 0.8, whereyis the normal (upwards) coordinate.
Figure 2. Quadrant plot of the instantaneous velocity data with thresholds. Left: data set E1 (mobile bed). Right: data set E1D (immobile bed). Gray lines ( ) stand for the |u’v’| and |u’| thresholds.
The data plotted in Figure 2 was treated to eliminate spurious points – values that differ more than 600% from the average of neighbouring points. In data sets of 12000 entries, bad data were no more than 22 points.
3.2 Event statistics
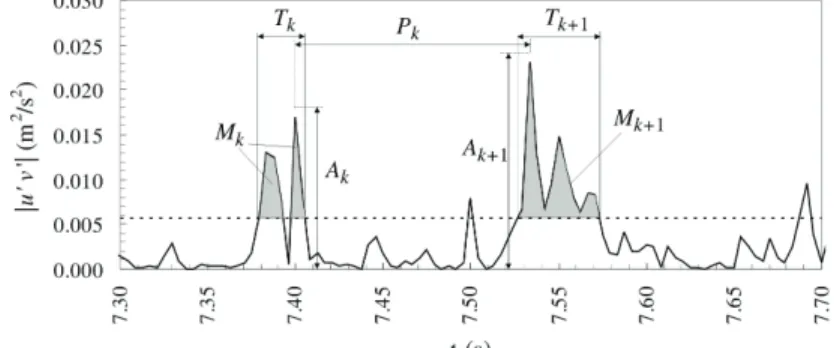
Four parameters will be used to characterize the sweep and the ejection events of the bursting cycle: the duration,Tk, the transported momentum,Mk, the maximum shear
stress,Ak(in absolute value) and the period,Pk, computed as seen in Figure 3.
For each data series, a record of the detected events is created and analysed. All events with a duration smaller than 2dt, where dt = 1/fLDA is the sampling interval,
were eliminated. TheNjvalid events in a given data seriesjare used to compute the average valuesX( )j .
Three data series were collected in E1 and in E1D. The ensemble averages of the
parameters that characterize the events are 3 ( )
1
1
3 =
=
∑
jj
for T , M , A or P . To simplify the notation, the brackets and the overbar
will be dropped.
Figure 3.Detail of a |u’v’| series with definition of the parameters that characterize sweep and ejection events.
4 EXPERIMENTAL RESULTS
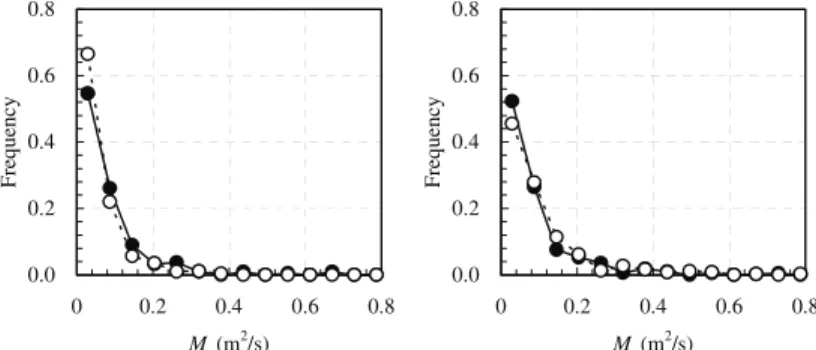
To compare the turbulent structure of the flow for sets E1 and E1D the statistical distributions of the parameters that characterize events sweep and ejection (see Figure 3), in both mobile and immobile bed conditions, are computed and compared. The comparative analysis is made at two reference positions within the water column: in the roughness layer (y/ks = 0.80) and in the upper region of the logarithmic layer (y/h= 0.19). Emphasis will be given to the results in the roughness layer. Figures 4 and 5 present the statistics of sweep and ejections events, respectively, measured aty/ks= 0.80 for the mobile and the immobile data sets.
The visible effect of a hypothetical reorganization of the turbulent structure due to the presence of mobile sediment occurs mainly on the sweep domain and concerns the transported momentum and the extreme value of the events. In the mobile bed case, larger values ofMand ofAare more frequent: the average value ofMis 0.099 m2/s and 0.075 m2/s for the mobile bed and the immobile bed, respectively. The average value of A, it is 0.012 m2
/s2
and 0.010 m2
/s2
for the mobile bed and the immobile bed, respectively.
The statistics of the extremes shows even more discrepant values: the extreme maximum value ofAis 0.028 m2/s2, for the mobile bed data set, and 0.023 m2/s2, for the immobile bed data set. The extreme values of the transported momentum are 0.819 m2/s and 0.400 m2/s for the mobile and immobile bed data sets, respectively. This configures an increased tendency to anisotropy near the bed in the mobile bed case. This claim is corroborated by the quadrant plot of the data (cf. Figure 2) where a higher dispersion of the data cloud is observed in the mobile bed data set.
0.0 0.2 0.4 0.6 0.8
0 0.05 0.1 0.15
T(s) F re q u en cy 0.0 0.2 0.4 0.6 0.8
0 0.2 0.4 0.6 0.8
M(m2/s)
F re q u en cy 0.0 0.2 0.4 0.6
0 0.01 0.02 0.03 0.04
A(m2/s2)
F re q u en cy 0.0 0.2 0.4 0.6 0.8
0 2 4 6
P(s) F re q u en cy
Figure 4.Histograms of duration (T), transported momentum (M), maximum shear stress (A) and period (P) of sweep events aty/ks= 0.80. Comparison of data sets E1,
mobile bed, ( ) and E1D, immobile bed, ( ).
0.0 0.2 0.4 0.6 0.8
0 0.05 0.1 0.15
T(s) F re q u en cy 0.0 0.2 0.4 0.6 0.8
0 0.2 0.4 0.6 0.8
M(m2/s)
F re q u en cy 0.0 0.2 0.4 0.6
0 0.01 0.02 0.03 0.04
A(m2/s2)
F re q u en cy 0.0 0.2 0.4 0.6 0.8
0 2 4 6
P(s) F re q u en cy
Figure 5. Histograms of the parameters characterizing the ejection events at y/ks = 0.80. Remaining caption as in Figure 4.
frequency of extreme sweeps and ejections in the mobile bed case must be compensated by stronger interactions. Observing the data clouds depicted in Figure 2, it is concluded that that is the case: the mobile bed data is characterized by a greater dispersion in all quadrants.
At the measuring position y/h = 0.19, at the upper region of the logarithmic layer, no appreciable differences are found on the distributions of any of the parameters that characterize sweep events and the ejection events. For comparison, the transported momentum is shown in Figure 6.
0.0 0.2 0.4 0.6 0.8
0 0.2 0.4 0.6 0.8
M(m2/s)
F
re
q
u
en
cy
0.0 0.2 0.4 0.6 0.8
0 0.2 0.4 0.6 0.8
M(m2/s)
F
re
q
u
en
cy
Figure 6. Histograms of the transported momentum characterizing the sweep (left) and ejection (right) events aty/h= 0.19. Remaining caption as in Figure 4.
It thus appears that the effects of the mobile bed are confined to the near-bed region and no significant reorganisation of turbulence occurs in the upper regions of the logarithmic region.
It is worthy of notice that only the transported momentum and the maximum value of the shear stress associated to the events seem to be affected by the existence of mobile sediment near the bed. The duration of the events and the period between events seem to remain unaltered. Only the values of the skewness of the period are slightly different (3.11 for the mobile bed data set and 2.11 for the immobile bed data set), indicating that the spacing of extreme ejection events may be greater in the mobile bed case.
5 DISCUSSION AND CONCLUSIONS
The analysis of the data sets E1 and E1D reveals that the ensemble average of the turbulent intensities urms and vrms is approximately insensitive to sediment mobility (Table 2).
Table 2. Ensemble averages of 2nd
and 3rd
order moments aty/ks= 0.8
Data set E1 Data set E1D
urms/u*(−) 1.96 1.93
vrms/u*(−) 0.95 0.91
Skewness(u’) (−) 0.110 0.073
Skewness(v’) (−) 0.062 0.065
It is not clear, however, if the increased mobility of coarse sediment is a cause or an effect of the increased intensity of the coherent events. Further experimental work will be undertaken to be clarify this issue.
AKNOWLEDGMENTS
The authors acknowledge the support provided by the Portuguese Foundation for Science and Technology (FCT) through the project PTDC/ECM/65442/2006.
REFERENCES
Ferreira, R.M.L. (2005), River Morphodynamics and Sediment Transport. Conceptual Model and Solutions. PhD Thesis, Instituto Superior Técnico, Technical University of Lisbon.
Ferreira, R.M.L.; Franca, M.J. & Leal, J.G.A.B., (2007), Laboratorial and theoretical study of the mobility of gravel and sand mixtures. Proc. 5th RCEM, Dohmen-Janssen & Hulscher (eds), pp: 531-539.
Ferreira, R.M.L.; Leal, J.G.A.B. & Cardoso, A.H. (2002), Turbulent structures and near-bed sediment transport in open-channel flows. River Flow 2002, Vol. 1: 553-564.
Franca, M.J. & Lemmin, U. (2006), Detection and reconstruction of coherent structures based on wavelet multiresolution analysis. River Flow 2006, Vol 1. pp. 181-190.
Grass, A. J. (1971), Structural features of turbulent flow over smooth and rough boundaries.J. Fluid Mech.,50: 233-255.
Macauley, A.N. & Pender, G. (1999), The response of an armoured bed to the infiltration of fine sand in a compound channel. Proc. 1st RCEM, Genova, 6-10 September, pp. 141-149.
Nakagawa, H. & Nezu, I. (1977), Prediction of the contribution to the Reynolds stress from bursting events in open-channel-flows.J. Fluid Mech.80(1): 99-128.
Nelson, J. M, Shreve, R. L., McLean, S. R. & Drake, T. G. (1995), Role of near-bed turbulence in near-bedload transport and near-bedform mechanics.Water Resour. Res.,31: 2071-2086.
Nezu, I. & Nakagawa, H. (1993), Turbulence in Open-Channel Flows. International Association for Hydraulic Research, Monograph Series. Balkema, Rotterdam.