i
UNIVERSIDADE DE BRASÍLIA
FACULDADE DE EDUCAÇÃO FÍSICA
PROGRAMA DE PÓS-GRADUAÇÃO STRICTO-SENSU EM EDUCAÇÃO
FÍSICA
EFEITO DA SUPLEMENTAÇÃO DE CAFEÍNA NA CAPACIDADE
DE GERAÇÃO DE TORQUE MÁXIMO E RÁPIDO EM HOMENS
JOVENS E IDOSOS
Lucas Campos Ugliara
BRASÍLIA
2019
EFEITO DA SUPLEMENTAÇÃO DE CAFEÍNA NA CAPACIDADE DE
GERAÇÃO DE TORQUE MÁXIMO E RÁPIDO EM HOMENS JOVENS
E IDOSOS
LUCAS CAMPOS UGLIARA
Dissertação apresentada à Faculdade de Educação Física da Universidade de Brasília, como requisito parcial para obtenção do grau Mestre em Educação Física.
Orientador: AMILTON VIEIRA
BANCA EXAMINADORA
Prof. Dr. Amilton Vieira – (presidente) Universidade de Brasília
Prof. Dr. Martim Francisco Bottaro Marques Universidade de Brasília
Prof. Dr. James J. Tufano Charles University in Prague
Prof. Dr. Valdinar de Araújo Rocha Junior Polícia Federal
BRASÍLIA 2019
iii
DEDICATÓRIA
Aos meus pais, Altimar e Rosilda, pelo suporte, pelo amor, pelo incentivo, pelo exemplo.
iv
AGRADECIMENTOS
Gostaria de agradecer primeiramente à minha família, Fernanda, Leandro, Leonardo e Mariane, e principalmente aos meus pais, Altimar e Rosilda. Por me apoiarem nos momentos de fraqueza, por me incentivarem nos momentos de dúvida e por me inspirarem a sempre tentar ser alguém melhor para com o próximo.
Um grande agradecimento ao meu orientador, Professor Dr. Amilton Vieira, por compartilhar gentilmente seu conhecimento, me conduzir sabiamente no caminho da ciência e, não menos, por sua paciência. Também ao Professor Dr. Martim Francisco Bottaro Marques, pelas oportunidades e apoio, por ter se dedicado tanto na construção de uma equipe e um ambiente de competência em nível internacional e me permitir à honra de fazer parte dessa história. Ambos são grandes líderes e inspirações para mim.
Agradeço aos Professores Dr. James J Tufano, Dr. Anthony J Blazevich e Dr. Valdinar de Araújo Rocha Júnior, por suas imensas contribuições intelectuais ao trabalho e por suas tão valiosas parcerias.
Aos muitos amigos e parceiros de laboratório, especialmente Professor Sávio Alex Almeida da Silva e Professor Me. Denis César Leite Vieira, meu sincero agradecimento pelas contribuições, pelos ensinos, pelo companheirismo e trabalho de excelência que desempenham.
Agradeço à Universidade de Brasília, que acolheu um mineiro interiorano, apoiando-o em uma caminhada a lugares que nunca, jamais, imaginou.
A todos que, de forma direta ou indireta, contribuíram e participaram do meu desenvolvimento acadêmico e de minha formação, muito obrigado.
v SUMÁRIO RESUMO EXPANDIDO ... 7 Introdução ... 7 Objetivos ... 7 Métodos ... 7 Resultados ... 10 Discussão ... 11 Conclusão ... 12 LIST OF TABLES ... 13
Table 1 – Participant demographics. ... 13
Table 2 – Torque-generating capacity before and after caffeine and placebo ingestion in older and younger men. ... 13
LIST OF FIGURES ... 13
Figure 1 – Overview of the supplementation protocol. ... 13
Figure 2 – Individual responses to caffeine and placebo for older and younger men. ... 13
LIST OF ABBREVIATIONS AND SYMBOLS ... 13
RESUMO... 15 ABSTRACT ... 16 INTRODUCTION ... 17 OBJECTIVES ... 18 METHODS ... 19 Participants ... 19 Study design ... 19 Dynamometry ... 20 Signal processing ... 21
vi Statistical analysis ... 21 RESULTS... 22 DISCUSSION ... 24 CONCLUSION ... 26 REFERENCES ... 26 APPENDIX ... 31
7
RESUMO EXPANDIDO
Introdução
O envelhecimento diminui a capacidade de produção de força máxima e rápida (SCHETTINO et al., 2014). Aumentar a capacidade de geração de força de indivíduos mais velhos proporciona benefícios, como maior independência (AAGAARD et al., 2010) e melhor equilíbrio (HESS; WOOLLACOTT; SHIVITZ, 2006). O uso agudo da cafeína melhora a atividade motora através do sistema nervoso central (MCLELLAN; CALDWELL; LIEBERMAN, 2016) e pode representar uma estratégia rápida e barata para melhorar a capacidade de geração de força.
A cafeína é uma substância segura e benéfica à saúde quando seguidas as recomendações de consumo (≤400 mg/dia) (GROSSO et al., 2017; REYES; CORNELIS, 2018). Há forte evidência que doses fisiologicamente relevantes de cafeína (3 a 9 mg/kg) exercem efeitos positivos na capacidade de geração de força máxima (GRGIC et al., 2019), enquanto baixas doses (~3 mg/kg) diminuem a incidência de efeitos colaterais (SPRIET, 2014). A cafeína já demonstrou um efeito menos evidente na musculatura de camundongos mais velhos em comparação a mais novos (TALLIS et al., 2017), mas não há comparação similar entre humanos. Além disso, poucos estudos investigaram os efeitos da cafeína na capacidade de geração de força rápida em indivíduos mais novos (BEHRENS et al., 2015; TREVINO et al., 2015; BLOMS et al., 2016; ZBINDEN-FONCEA et al., 2018) e nenhum em mais velhos.
Objetivos
Investigar e comparar os efeitos de uma baixa dose de cafeína na capacidade de geração de torque dos flexores plantares de homens mais velhos e mais novos.
Métodos
Participaram do presente estudo vinte e um homens mais velhos (≥ 60 anos) e 22 homens mais novos (entre 18 e 35 anos) fisicamente ativos, não fumantes e livres de doenças crônicas e problemas neuromusculares que pudessem comprometer o
8
desempenho muscular. Eles foram instruídos a se abster de cafeína (uma semana antes do primeiro teste e até o fim da participação), e bebidas alcoólicas e exercícios vigorosos (48h antes dos testes). Homens que fizessem uso medicamentoso e/ou de suplementos não foram incluídos.
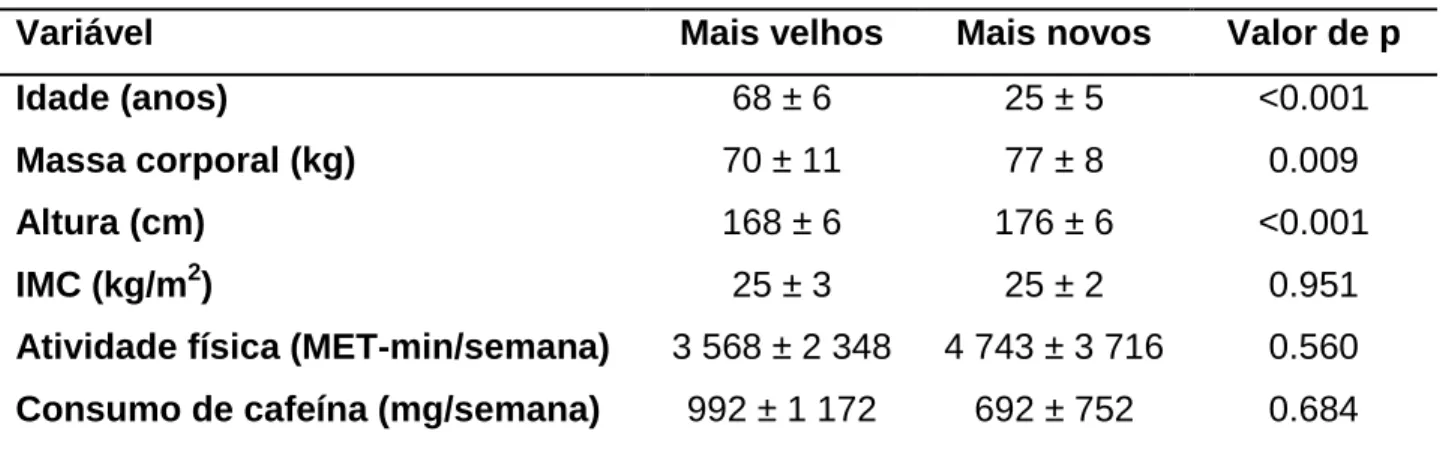
Tabela 1. Dados demográficos dos participantes.
Variável Mais velhos Mais novos Valor de p
Idade (anos) 68 ± 6 25 ± 5 <0.001
Massa corporal (kg) 70 ± 11 77 ± 8 0.009
Altura (cm) 168 ± 6 176 ± 6 <0.001
IMC (kg/m2) 25 ± 3 25 ± 2 0.951
Atividade física (MET-min/semana) 3 568 ± 2 348 4 743 ± 3 716 0.560
Consumo de cafeína (mg/semana) 992 ± 1 172 692 ± 752 0.684
Dados reportados como média ± DP. IMC, índice de massa corporal.
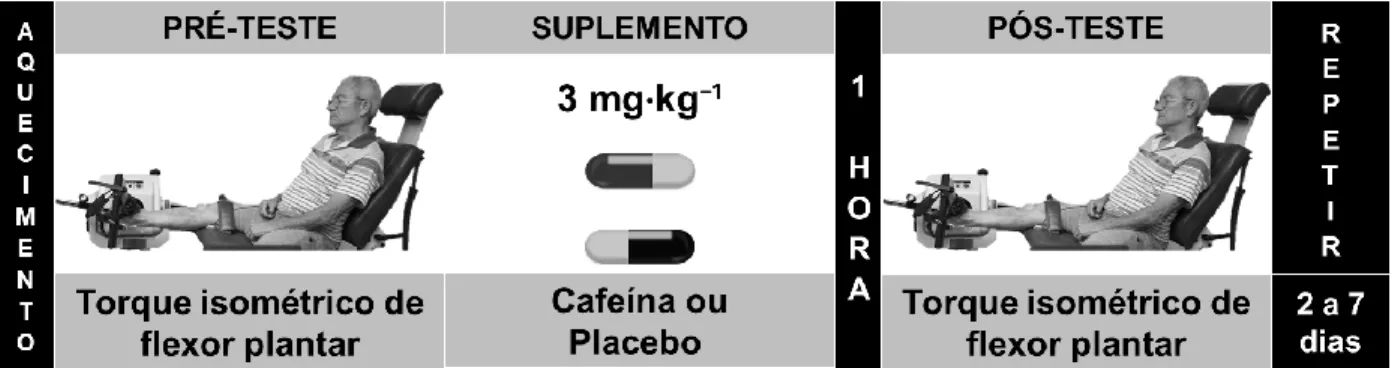
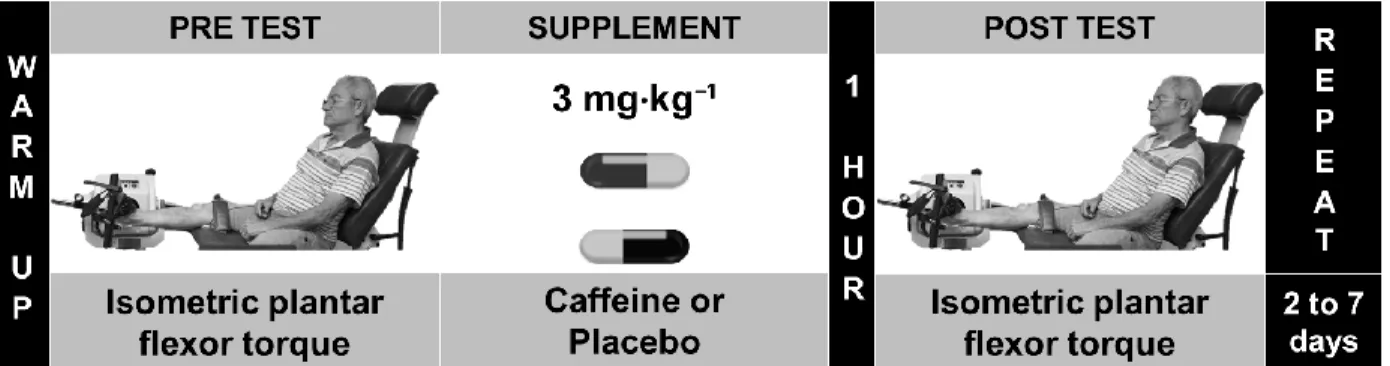
Os participantes compareceram ao laboratório em 3 dias distintos com 2 a 7 dias de intervalo: o primeiro para aferição de medidas antropométricas, preenchimento de questionários e familiarização aos procedimentos da dinamometria; os dois seguintes para mensuração do pico de torque (PT) e da taxa de produção de torque (TPT) dos flexores plantares, antes e 60 min após a suplementação de cafeína ou placebo (3 mg/kg) (GRAHAM; SPRIET, 1995) (figura 1).
O torque dos flexores plantares foi aferido com os participantes sentados confortavelmente no dinamômetro, com a perna dominante em extensão total de joelho, 10° de dorsiflexão de tornozelo e cintas de contenção na coxa e na região pélvica. Os participantes realizaram um aquecimento e, após 2 minutos de intervalo, empurraram a plataforma do equipamento em quatro tentativas de 4 s de máximo desempenho, com intervalos de 30 s (figura 1).
9
Figura 1. Visão geral do protocolo de suplementação. Repetiu-se o protocolo após dois a sete dias, utilizando-se cafeína ou placebo em um modelo duplo-cego.
A capacidade de geração de torque foi determinada pela medida do PT e TPT de 100-200 ms (THOMPSON et al., 2012). Shapiro-Wilk e histogramas foram usados para verificar a distribuição dos dados. Os dados foram transformados em log na base natural para melhorar a distribuição. Outliers foram removidos. Uma ANOVA mista de três vias [tempo (pré vs pós); grupo (mais velhos vs mais novos); e condição (cafeína vs placebo)] foi usada para estatísticas inferenciais. A diferença mínima significativa de Fisher foi usada para análise post hoc. O tamanho do efeito de Cohen (TE) foi calculado e valores <0.20, de 0.20-0.49, 0.50-0.79, e > 0.8 foram classificados como trivial, pequeno, moderado e grande, respectivamente (COHEN, 1988). Mudanças que compensam foram quantificadas como 0.2 (pequena), 0.6 (moderada) e 1.2 (grande) × desvio padrão agrupado (HOPKINS et al., 2009).
10 Resultados
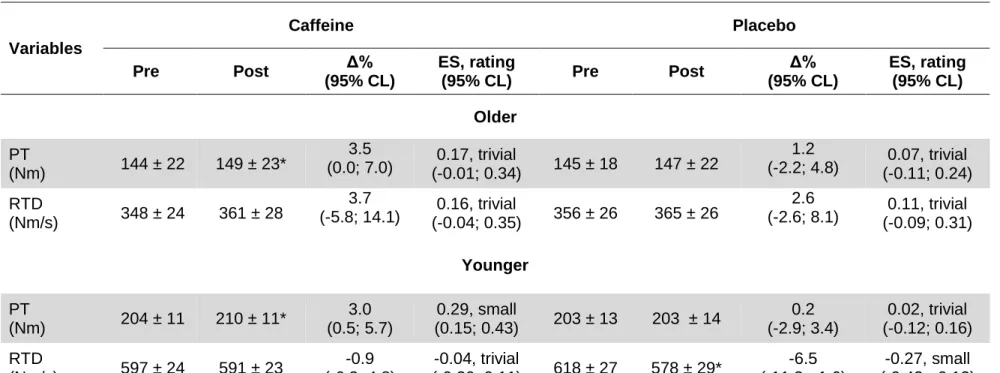
Table 2. Capacidade de geração de torque antes e após a ingestão de cafeína e placebo em homens mais velhos e mais novos.
Dados pré e pós estão representados como média (re-transformados do log) ± DP (como coeficiente de variação). PT = pico de torque; TPT = taxa de produção de torque; Δ% = mudança percentual do desempenho; TE = tamanho do efeito; LC = limites de confiança; * = diferente do valor pré (p < 0.05). Variáveis Cafeína Placebo Pré Pós Δ% (95% LC) TE, avaliação (95% LC) Pré Pós Δ% (95% LC) TE, avaliação (95% LC) Mais velhos PT (Nm) 144 ± 22 149 ± 23* 3.5 (0.0; 7.0) (-0.01; 0.34) 0.17, trivial 145 ± 18 147 ± 22 1.2 (-2.2; 4.8) (-0.11; 0.24) 0.07, trivial TPT (Nm/s) 348 ± 24 361 ± 28 3.7 (-5.8; 14.1) (-0.04; 0.35) 0.16, trivial 356 ± 26 365 ± 26 2.6 (-2.6; 8.1) (-0.09; 0.31) 0.11, trivial Mais novos PT (Nm) 204 ± 11 210 ± 11* 3.0 (0.5; 5.7) 0.29, pequeno (0.15; 0.43) 203 ± 13 203 ± 14 0.2 (-2.9; 3.4) 0.02, trivial (-0.12; 0.16) TPT (Nm/s) 597 ± 24 591 ± 23 -0.9 (-6.3; 4.8) -0.04, trivial (-0.20; 0.11) 618 ± 27 578 ± 29* -6.5 (-11.3; -1.6) -0.27, pequeno (-0.43; -0.12)
11
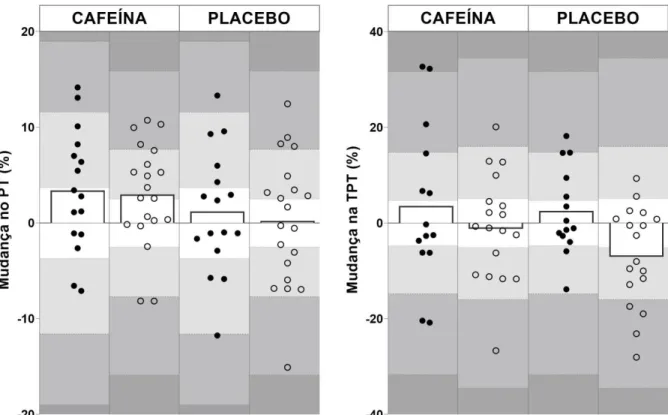
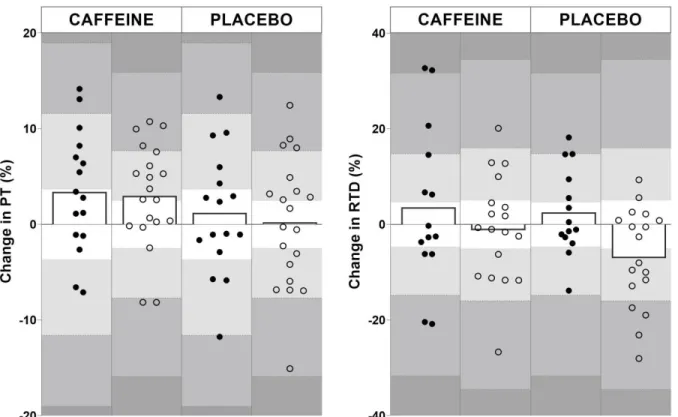
Figura 2. Respostas individuais à ingestão de cafeína e placebo para homens mais velhos (●) e mais novos (○). PT, pico de torque; TPT, taxa de produção de torque. As sombras cor cinza claro a escuro indicam os limiares das mudanças que compensam pequenas, moderadas e grandes, respectivamente.
Discussão
Cafeína, mas não placebo, promoveu um aumento de trivial-a-pequeno no pico de torque (PT) tanto de homens mais velhos (3.5%, TE = 0.17) quanto mais novos (3.0%, TE = 0.17). A cafeína não exerceu efeito na taxa de produção de torque (TPT) tanto em homens mais velhos quanto mais novos, enquanto os mais novos demonstraram uma pequena queda na TPT após a ingestão de placebo (6.5%, TE = -0.27).
Atualmente, é bem aceita a proposta que a cafeína melhora a ativação muscular e aumenta a capacidade de geração de força de indivíduos mais novos (GRGIC et al., 2019) pela competição por receptores de adenosina (MCLELLAN; CALDWELL; LIEBERMAN, 2016). Foi observado um aumento similar no PT de homens mais velhos
12
e mais jovens (3.5% vs 3.0%), porém um tamanho de efeito (TE) levemente maior para os mais novos (TE = 0.29 vs 0.17, Tabela 2). Esse achado pode sugerir maior variância no grupo mais velho. É possível ainda observar que 60% (n = 12) dos homens mais novos ultrapassaram o limiar da pequena mudança que compensa, contra 44% (n = 7) dos mais velhos, sugerindo menor responsividade em alguns dos indivíduos mais velhos. O envelhecimento diminui a quantidade e o potencial de ligação de receptores de adenosina (MISHINA et al., 2017), o que pode explicar parte dessa resposta mais heterogênea.
Diferente do presente estudo, outras investigações apontam aumento da TPT em indivíduos mais novos após a ingestão de cafeína, porém utilizando doses maiores (5 e 7 mg/kg) (BEHRENS et al., 2015; BLOMS et al., 2016). Portanto, estudos futuros deveriam investigar se maiores doses de cafeína podem superar a falta de resposta observada em ambos os grupos do presente estudo, com atenção para um possível aumento de efeitos colaterais (SPRIET, 2014). Além disso, é possível que a cafeína tenha melhorado o estado de alerta (SPRIET, 2014) e o desempenho cognitivo (SHERMAN et al., 2016) nos homens mais novos, evitando perda de motivação e, consequentemente, queda da TPT (-0.9%, p = 0.785), como observado após a ingestão de placebo (-6.5%, p = 0.007).
Conclusão
Uma baixa dose de cafeína (3 mg/kg, ~200 mg) aumenta o pico de torque dos flexores plantares de homens mais velhos e mais novos, porém não modifica a taxa de produção de torque. Respostas mais heterogêneas foram observadas no torque de homens mais velhos após a ingestão de cafeína.
13
LIST OF TABLES
Table 1 – Participant demographics.
Table 2 – Torque-generating capacity before and after caffeine and placebo ingestion in older and younger men.
LIST OF FIGURES
Figure 1 – Overview of the supplementation protocol.
Figure 2 – Individual responses to caffeine and placebo for older and younger men.
LIST OF ABBREVIATIONS AND SYMBOLS
* Asterisk, statistically different (asterisco, estatisticamente diferente) ● Black dot, older (ponto preto, mais velho)
° Degrees (graus)
Δ Delta, difference (delta, diferença)
≥ Greater than or equal to (maior que ou igual a) > Greater than (maior que)
○ Hollow dot, younger (ponto oco, mais novo) < Less than (menor que)
% Percentage (percentual)
± Plus or minus (mais ou menos)
ANOVA Analysis of variance (análise de variância) BMI Body mass index (índice de massa corporal)
14
CL Confidence limits (limites de confiança)
CV Coefficient of variation (coeficiente de variação)
d Cohen’s d effect size (tamanho do efeito por d de Cohen) e.g. Exempli gratia, for example (por exemplo)
ES Effect size (tamanho do efeito)
ICC Intraclass correlation coefficient (coeficiente de correlação intraclasse) i.e. Id est, in other words (em outras palavras)
kg Kilograms (quilogramas) kHz Kilohertz (quilo-hertz)
LSD Least significant difference (diferença mínima significativa) log Logarithm (logaritmo)
MET Metabolic equivalente of task (equivalente metabólico da tarefa) min minutes (minutos)
mg Milligrams (miligramas)
Nm Newton meter (Newton metro) PT Peak torque (pico de torque)
RTD Rate of torque development (taxa de produção de torque)
s Seconds (segundos)
SD Standard deviation (Desvio padrão)
15 RESUMO
O envelhecimento está associado à neurodegeneração e perda de função muscular, mas a cafeína pode melhorar a habilidade do sistema nervoso central em gerar força. Entretanto, a maioria dos estudos tem como foco indivíduos mais novos, enquanto nenhum estudo até o momento comparou os efeitos da cafeína na capacidade de geração de torque entre homens mais novos e mais velhos. Este estudo comparou os efeitos da cafeína no pico de troque (PT) e na taxa de produção de torque (TPT) de homens mais novos e mais velhos. Vinte e dois homens mais novos (25±5 anos) e 21 mais velhos (68±6 anos) obtiveram o torque isométrico dos flexores plantares aferido em dois dias distintos (2-7 dias de intervalo). PT e TPT (ou seja, a inclinação da curva torque-tempo) foram medidas antes e 60 min após a ingestão de 3 mg/kg de cafeína ou placebo (duplo-cego). Uma ANOVA mista de três fatores foi utilizada para analisar potenciais diferenças entre o tempo (pré vs pós-suplemento), condição (cafeína vs placebo) e grupo (mais velho vs mais novo). O tamanho do efeito de Cohen (TE) foi utilizado para demonstrar a magnitude das diferenças. A cafeína aumentou o PT tanto em homens mais velhos (3.5%; p = 0.026; TE = 0.17) quanto mais novos (3.0%; p = 0.029; TE = 0.29), mas não modificou a TPT. Uma TPT reduzida foi observada nos homens mais novos após a ingestão de placebo (-6.5%, p = 0.007; ES = -0.27). Em conclusão, uma baixa dose de cafeína aumentou o pico de torque dos músculos flexores plantares de homens mais velhos e mais novos, com uma resposta mais heterogênea nos mais velhos, mas não demonstrou efeito na taxa de produção de torque.
Palavras-chave: envelhecimento, força muscular, força explosiva, taxa de produção de torque.
16
EFFECT OF CAFFEINE SUPPLEMENTATION ON THE MAXIMAL AND RAPID TORQUE-GENERATING CAPACITY OF YOUNGER AND OLDER MEN
ABSTRACT
Aging is associated with neurodegeneration and a loss of muscle function, but caffeine may improve the ability of the central nervous system to generate force. However, the majority of studies have focused on young men, and no study has compared the effects of caffeine on torque-generating capacity between younger and older men. This study compared the effect of caffeine on the peak torque (PT) and rate of torque development (RTD) of younger and older men. Twenty-two younger (25±5 years) and 21 older (68±6 years) men were tested for isometric plantar flexor torque on two separate days (2-7 days apart). PT and RTD (i.e. torque-time slope) were measured before and 60-min after 3 mg/kg of caffeine or placebo (double-blinded). A three-way mixed ANOVA was used to analyze potential differences between time (pre vs post-supplement), condition (caffeine vs placebo) and group (older vs younger). Cohen’s effect size (ES) was used to show the magnitude of differences. Caffeine increased PT in both older (3.5%; p = 0.026; ES = 0.17) and younger men (3.0%; p = 0.029; ES = 0.29), but did not change RTD. Decreased RTD was observed in younger after placebo ingestion (-6.5%, p = 0.007; ES = -0.27). In conclusion, a low dose of caffeine increased the peak torque of plantar flexor muscles of older and younger men, with more heterogeneous response in older, but had no effect on rate of torque development.
17 INTRODUCTION
It is well-established that higher levels of muscular strength are associated with maintaining activities of daily living and preventing certain diseases (GEIRSDOTTIR et al., 2012; CHEN et al., 2020). In fact, studies have shown that maximal strength can even serve as an independent prognostic for identifying the risk of illness and mortality (RUIZ et al., 2008; BOYLE et al., 2009; ARTERO et al., 2012). However, not only is maximizing strength important in this sense, but specifically increasing the rate at which strength can be expressed is also associated with the ability to perform daily tasks (AAGAARD et al., 2010), maintain balance (HESS; WOOLLACOTT; SHIVITZ, 2006), and prevent falls (KIM; ASHTON-MILLER, 2003). Unfortunately, aging is associated with a loss of both maximal and rapid force-generating capacity (KLASS; BAUDRY; DUCHATEAU, 2008; SCHETTINO et al., 2014), but physical, nutritional, and ergogenic interventions can positively affect the neuromuscular system, possibly attenuating these age-related performance decrements. For example, evidence suggests that the acute ingestion of physiological relevant doses of caffeine (~3 to 9 mg/kg) may act on the central nervous system and may improve force-generating capacity (MCLELLAN; CALDWELL; LIEBERMAN, 2016).
Caffeine is the most commonly consumed psychostimulant in the world and is present in many foods and beverages that are part of contemporary life in many cultures. When staying within the daily recommended amount (up to 400 mg/day), caffeine is safe (REYES; CORNELIS, 2018) and might offer protective effects against chronic diseases such as cancer (e.g. prostate and colorectal), cardiovascular disease, type 2 diabetes, and neural conditions (e.g. Parkinson’s and Alzheimer’s disease) (GROSSO et al., 2017). Specifically in terms of performance, low to moderate doses of caffeine (~3-6 mg/kg) seem to acutely promote improvements in muscular performance (GOLDSTEIN et al., 2010). However, although the majority of studies investigate the effect of moderate doses (6 mg/kg) (GRGIC et al., 2019), a low dose of caffeine (3 mg/kg) is easier to be ingest in a habitual diet (GRGIC et al., 2019) while avoiding potential negative side effects (e.g. insomnia, nervousness and tachycardia) (SPRIET,
18
2014). Therefore, lower doses may be more realistic for older adults to consume on a daily basis, if evidence can suggest that torque generating capacity can be improved via caffeine supplementation.
The effects of caffeine on force/torque generating-capacity have been investigated since the beginning of twentieth century (RIVERS; WEBBER, 1907), and several studies on the topic (WARREN et al., 2010; POLITO et al., 2016; GRGIC et al., 2018; GRGIC; PICKERING, 2019) have prompted a recent meta-analysis that demonstrates the positive effects of caffeine (GRGIC et al., 2019). However, the vast majority of studies have focused on young individuals performing maximal strength tests (GRGIC et al., 2019), while few investigating rapid strength capacity (BEHRENS et al., 2015; TREVINO et al., 2015; BLOMS et al., 2016; ZBINDEN-FONCEA et al., 2018) and none investigating the effects of caffeine on rate of torque development in older individuals. In fact, to our knowledge, only a single study has investigated this notion and demonstrated that caffeine improved maximal strength in both older and younger mice, but the effect on the older ones was less evident than on their younger counterparts (TALLIS et al., 2017). This way, we hypothesized that a low dose of caffeine would increase the torque-generating capacity (i.e. peak torque and rate of torque development) in both older and younger men, but with a greater effect in younger men.
OBJECTIVES
To investigate and to compare the effects of a low dosage of caffeine on the torque-generating capacity of the plantar flexors of older and younger men.
19 METHODS
Participants
Forty-three apparently healthy adult men were recruited into two age groups: 21 older men (≥ 60 years old) and 22 younger men (between 18 and 35 years old) (Table 1). Participants were recruited from a university population and from local public parks by advertisements, flyers, and word of mouth. Participants self-reported as physically active, non-smoking, and free from any musculoskeletal injury or chronic disease that could affect muscle performance. None of them were taking medication that could interact with caffeine metabolism, ergogenic aids, or nutritional supplements. Participants were asked to maintain a caffeine-free diet one week before the first testing day and until the end of their participation. They also were asked to abstain from alcoholic beverages as well as from vigorous exercises 48h prior the testing days. The study protocol was approved by an Institutional Ethical Committee (#2 293 069) and participants signed an informed consent form.
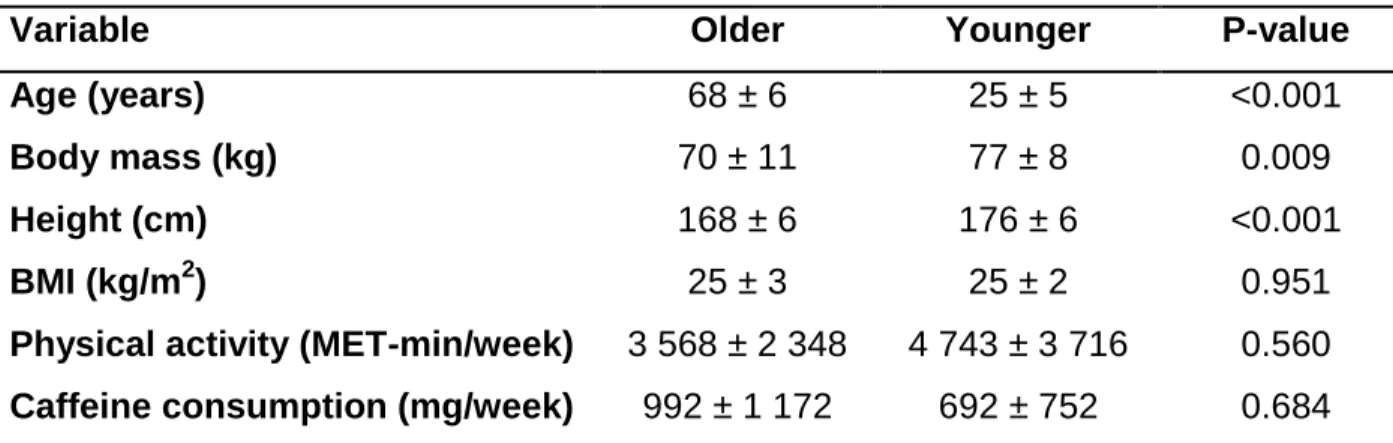
Table 1. Participant demographics.
Variable Older Younger P-value
Age (years) 68 ± 6 25 ± 5 <0.001
Body mass (kg) 70 ± 11 77 ± 8 0.009
Height (cm) 168 ± 6 176 ± 6 <0.001
BMI (kg/m2) 25 ± 3 25 ± 2 0.951
Physical activity (MET-min/week) 3 568 ± 2 348 4 743 ± 3 716 0.560 Caffeine consumption (mg/week) 992 ± 1 172 692 ± 752 0.684 Data are reported as mean ± SD. BMI, body mass index.
20
A double-blind, randomized, crossover study was performed to compare the effects of caffeine and placebo on plantar flexors peak torque (PT) and rate of torque development (RTD) of younger and older men. Participants were required to visit the laboratory on three occasions at the same time of day (±1 hour). During the first visit, participants filled out questionnaires, completed anthropometrics measures, and became familiarized with the dynamometry measurements. The following two visits, which occurred 2-7 days apart, were dedicated to the experimental protocol (Fig. 1). Testing was performed only in the morning (i.e. 8 to 12) to prevent sleep disturbance induced by caffeine ingestion (DRAKE et al., 2013). Isometric plantar flexor torque was measured during explosive muscle actions before and 60 min after 3 mg/kg caffeine or placebo ingestion (GRAHAM; SPRIET, 1995). A low dose of caffeine was chosen since it may have an ergogenic potential while decreasing the likelihood of negative side effects (SPRIET, 2014).
Figure 1. Overview of the supplementation protocol. The protocol was repeated after two to seven days using caffeine or placebo in a double-blind model.
Dynamometry
Participants were tested in a dynamometer (Biodex System 4 Pro®, Biodex Medical Systems, Shirley, USA). They were comfortably positioned on the dynamometer seat (reclined at 70º) with belts fastened across the pelvis and thigh to prevent movements that could affect ankle torque output. The lateral malleolus was aligned to the center of rotation of the dynamometer and the ankle was positioned at 10° of
21
dorsiflexion with the knee in full extension (TRAJANO et al., 2014). The chair and dynamometer settings were recorded for each subject during the first visit and were used throughout the study. Before testing, participants were asked to perform isometric muscle actions with progressive level of efforts (from 20 to 100% of their perceived maximal), including brief (< 1 s) explosive actions. Following the warm-up procedure, they were asked to push the dynamometer platform “as fast and as hard as possible” (MAFFIULETTI et al., 2016) for 4 s. All participants had four attempts to achieve their maximal performance with 30 s of rest between attempts. They received verbal encouragement throughout the tests, and all testing procedures were conducted by the same examiner.
Signal processing
The torque signal was sampled at 2 kHz (Miotec Miotool® 400 USB, Porto Alegre, Brazil). Torque-generating capacity was determined by measuring PT and RTD from 100-200 ms. PT was defined as the mean value of a 50 ms window containing the highest value of torque signal. The onset of muscle action occurred when the torque signal reached a threshold of 2.5% of the PT value (MAFFIULETTI et al., 2016). Subsequently, RTD was calculated as the slope of the torque–time curve over the time interval of 100 to 200 ms (THOMPSON et al., 2012). All digital signal processing was performed by an automated custom software designed in MATLAB 6.5 (MathWorks Inc., Natick, USA). PT (ICC = 0.94 and 0.86, CV = 4.7% and 4.9%) and RTD (ICC =0.92 and 0.88, CV = 6.6% and 7.7%) demonstrated acceptable reliability scores for older and younger, respectively. The RTD from an earlier period (0-50 ms) was initially considered, but it was removed from analysis since did not demonstrated an acceptable level of reliability (e.g. CV ≥ 10%).
Statistical analysis
Shapiro-Wilk test and histograms were used to verify data distribution. Data was log transformed using natural base to improve data distribution. Outliers were identified and removed by inspecting box-whisker plots (i.e. values greater than 1.5 box-length from the edge of the box). A three-way mixed ANOVA [time (pre vs post); group (older
22
vs younger); and condition (caffeine vs placebo)] was used for inferential statistics. When appropriated, Fisher's Least Significant Difference (LSD) was applied for post hoc analysis. Cohen’s d effect size (ES) was calculated by a custom-made spreadsheet (Microsoft Excel) and values of <0.20, 0.20-0.49, 0.50-0.79, and > 0.8 were classified as trivial, small, moderate, and large, respectively (COHEN, 1988). The worthwhile changes were quantified as 0.2 (small), 0.6 (moderate) and 1.2 (large) × polled standard deviation (HOPKINS et al., 2009). IBM SPSS (version 21) was used for analyses with an alpha level set at 0.05.
RESULTS
Table 2 describes PT and RTD from older and younger men before and after caffeine and placebo ingestion, while Figure 2 shows individual responses. A main time effect for PT was found (F(1,34) = 6.346, p = 0.017) and the post hoc analysis showed an increased PT for both older (3.5%; p = 0.026; ES = 0.17) and younger (3.0%; p = 0.029; ES = 0.29) after caffeine ingestion. Also, a main time x group effect for RTD was found (F(1,30) = 4.443, p = 0.044) showing the post-hoc analysis a decreased in RTD of younger men after placebo ingestion (-6.5%, p = 0.007; ES = -0.27).
23
Table 2. Torque-generating capacity before and after caffeine and placebo ingestion in older and younger men.
Pre and Post data are presented as mean (from log back-transformed) ± SD (as a coefficient of variation). PT = peak torque; RTD = rate of torque development; Δ% = percentage change in performance; ES = effect size; CL = confidence limits; * = different from pre-value (p < 0.05).
Variables Caffeine Placebo Pre Post Δ% (95% CL) ES, rating (95% CL) Pre Post Δ% (95% CL) ES, rating (95% CL) Older PT (Nm) 144 ± 22 149 ± 23* 3.5 (0.0; 7.0) (-0.01; 0.34) 0.17, trivial 145 ± 18 147 ± 22 1.2 (-2.2; 4.8) (-0.11; 0.24) 0.07, trivial RTD (Nm/s) 348 ± 24 361 ± 28 3.7 (-5.8; 14.1) (-0.04; 0.35) 0.16, trivial 356 ± 26 365 ± 26 2.6 (-2.6; 8.1) (-0.09; 0.31) 0.11, trivial Younger PT (Nm) 204 ± 11 210 ± 11* 3.0 (0.5; 5.7) 0.29, small (0.15; 0.43) 203 ± 13 203 ± 14 0.2 (-2.9; 3.4) 0.02, trivial (-0.12; 0.16) RTD (Nm/s) 597 ± 24 591 ± 23 -0.9 (-6.3; 4.8) -0.04, trivial (-0.20; 0.11) 618 ± 27 578 ± 29* -6.5 (-11.3; -1.6) -0.27, small (-0.43; -0.12)
24
Figure 2. Individual responses to caffeine and placebo for older (●) and younger (○) men. PT,
peak torque; RTD, rate of torque development. The light to dark shades of grey indicates small, moderate and large worthwhile changes, respectively.
DISCUSSION
This study aimed to verify the acute effect of a low dose of caffeine and placebo in PT and RTD older and younger men. The results indicate that caffeine, not placebo, promoted a trivial to small increased in PT in both older (3.5%, ES = 0.17) and younger men (3.0%, ES = 0.29). It was interesting to note that although no effect of caffeine was observed in RTD neither in older nor in younger men, younger men demonstrated a small decreased in RTD following placebo ingestion (-6.5%, ES = -0.27).
Caffeine similarly improved PT in older (3.5%) and younger (3.0%) men, however the magnitude of the effect (ES) was slightly larger for younger men (ES = 0.29 vs 0.17, Table 2). Based on a recent comprehensive study (GRGIC et al., 2019), the finding that caffeine promotes a small increase (~ 3%, ES = 0.21) in maximal torque in younger men
25
was expected. It has been proposed that caffeine acts on the central and/or peripheral nervous system by antagonizing adenosine receptors, resulting in enhanced neural activation to the working muscles, since adenosine is related to increase of inhibitory and decrease of excitatory neurotransmitters release (MCLELLAN; CALDWELL; LIEBERMAN, 2016). Although a similar response to caffeine was observed between older and younger men, the slightly smaller ES in older men might suggest a greater variance in their responses. The individual responses to caffeine, presented in Figure 2, may suggest a lower responsiveness in some older individuals. It could be noted that 60% (n = 12) of younger presented equal or larger than the SWC, against 44% (n = 7) of older men. This lower response for some older individuals might be explained by the aging-related decrement in adenosine receptors and lower binding potential of caffeine to these receptors in areas associated with motor control (e.g. cortices, striatum and thalamus) (MISHINA et al., 2017). Therefore, older individuals might present a more heterogeneous response to caffeine than younger individuals and future studies should investigate whether, for instance, older individuals would have benefit with a greater dose of caffeine.
Caffeine did not modify RTD neither in older nor in younger men, but younger men had a small decrement following placebo ingestion. Other studies found performance enhancement in young individuals using greater doses of caffeine. For example, Behrens et al. (BEHRENS et al., 2015) found that 7 mg/kg of caffeine improved the rate of torque development of the plantar flexors in physically active young men and women. Similarly, Bloms et al. (2016) found a greater peak force and rate of force development during jump performance with 5 mg/kg of caffeine intake in collegiate athletes. Thus, future studies should investigate if this lack of effect on RTD observed in older and younger men would be overcome by the use of higher doses of caffeine, albeit having in mind a possible increased occurrence of side effects (SPRIET, 2014). Previous studies have demonstrated that caffeine is associated with increased alertness (SPRIET, 2014) and improved cognitive performance in younger (SHERMAN et al., 2016), which may explain the decreased RTD in younger after placebo (-6.5%, p = 0.007) but not with caffeine (-0.9%, p = 0.785). Therefore, although caffeine did not
26
increase RTD, at least caffeine might be ingested to prevent that younger individuals lose their motivation to perform an explosive muscle action required for RTD measurement.
Although this study provides important information regarding the effect of a low dose of caffeine in younger and older men, the study is not free of limitation. As presented in Figure 2, the responses to caffeine were highly heterogeneous. Although we had tried to reduce this heterogeneous responses recruiting a homogenous samples of participants (i.e. physically active men, eutrophic, non-smokers), others aspects might also affect responsivess to caffeine (e.g. genetics (SOUTHWARD et al., 2018) and habitual caffeine consumption (PICKERING; GRGIC, 2019). Furthermore, recruiting physically active men (i.e. individuals performing ≥ 600 MET-min/week of light or moderate activities) established a lower bound, but not an upper bound allowing to participate highly active men (e.g. 17,082 MET-min/week). Further studies should consider the habitual consumption of caffeine since it may affect caffeine responsiveness (BEAUMONT et al., 2017).
CONCLUSION
In conclusion, a low dose of caffeine (3 mg/kg, ~ 200 mg) increased the peak torque of plantar flexor muscles of older and younger men, but had no effect on rate of torque development. Although caffeine similarly increased torque of both older and younger a more heterogeneous response could be observed in older men.
REFERENCES
AAGAARD, P. et al. Role of the nervous system in sarcopenia and muscle atrophy with aging: Strength training as a countermeasure. Scandinavian Journal of Medicine and Science in Sports, v. 20, n. 1, p. 49–64, 2010.
27
ARTERO, E. G. et al. Effects of Muscular Strength on Cardiovascular Risk Factors and Prognosis. Journal of Cardiopulmonary Rehabilitation and Prevention, v. 32, n. 6, p. 351–358, 2012. Disponível em: <https://www.ncbi.nlm.nih.gov/pubmed/22885613>. BEAUMONT, R. et al. Chronic ingestion of a low dose of caffeine induces tolerance to the performance benefits of caffeine. Journal of Sports Sciences, v. 35, n. 19, p. 1920–1927, 2017. Disponível em: <http://dx.doi.org/10.1080/02640414.2016.1241421>. BEHRENS, M. et al. Alteration in neuromuscular function of the plantar flexors following caffeine ingestion. Scandinavian Journal of Medicine and Science in Sports, v. 25, n. 1, p. e50–e58, 2015.
BLOMS, L. P. et al. The effects of caffeine on vertical jump height and execution in collegiate athletes. Journal of Strength and Conditioning Research, v. 30, n. 7, p. 1855–1861, 2016.
BOYLE, P. A. et al. Association of muscle strength with the risk of Alzheimer disease and the rate of cognitive decline in community-dwelling older persons. Archives of Neurology, v. 66, n. 11, p. 1339–1344, 2009.
CHEN, F. et al. Maximal muscle strength and body composition are associated with bone mineral density in chinese adult males. Medicine, v. 99, n. 6, p. e19050, fev. 2020. Disponível em: <http://journals.lww.com/10.1097/MD.0000000000019050>.
COHEN, J. Statistical power analysis for the behavioral sciences, 2nd Edition. [s.l.] Hillsdale (NJ): Lawrence Erlbaum Associates, 1988.
DRAKE, C. et al. Caffeine effects on sleep taken 0, 3, or 6 hours before going to bed. Journal of Clinical Sleep Medicine, v. 9, n. 11, p. 1195–1200, 2013. Disponível em: <http://scholars.unh.edu/honors/103>.
GEIRSDOTTIR, O. G. et al. Physical function predicts improvement in quality of life in elderly icelanders after 12 weeks of resistance exercise. Journal of Nutrition, Health and Aging, v. 16, n. 1, p. 62–66, 2012.
28
and performance. Journal of the International Society of Sports Nutrition, v. 7, n. 1, p. 522–526, 2010.
GRAHAM, T. E.; SPRIET, L. L. Metabolic, catecholamine, and exercise performance responses to various doses of caffeine. Journal of Applied Physiology, v. 78, n. 3, p. 867–874, 1995.
GRGIC, J. et al. Effects of caffeine intake on muscle strength and power: A systematic review and meta-analysis. Journal of the International Society of Sports Nutrition, v. 15, n. 1, p. 1–10, 2018.
GRGIC, J. et al. Wake up and smell the coffee: Caffeine supplementation and exercise performance - An umbrella review of 21 published meta-analyses. British Journal of Sports Medicine, p. 1–9, 2019.
GRGIC, J.; PICKERING, C. The effects of caffeine ingestion on isokinetic muscular strength: A meta-analysis. Journal of Science and Medicine in Sport, v. 22, n. 3, p. 353–360, 2019. Disponível em: <https://doi.org/10.1016/j.jsams.2018.08.016>.
GROSSO, G. et al. Coffee, Caffeine, and Health Outcomes: An Umbrella Review. Annual Review of Nutrition, v. 37, n. 1, p. 131–156, 2017. Disponível em: <http://www.annualreviews.org/doi/10.1146/annurev-nutr-071816-064941>.
HESS, J. A.; WOOLLACOTT, M.; SHIVITZ, N. Ankle force and rate of force production increase following high intensity strength training in frail older adults. Aging Clinical and Experimental Research, v. 18, n. 2, p. 107–115, 2006.
HOPKINS, W. G. et al. Progressive statistics for studies in sports medicine and exercise science. Medicine and Science in Sports and Exercise, v. 41, n. 1, p. 3–12, 2009. KIM, K. J.; ASHTON-MILLER, J. A. Biomechanics of fall arrest using the upper extremity: Age differences. Clinical Biomechanics, v. 18, n. 4, p. 311–318, 2003. KLASS, M.; BAUDRY, S.; DUCHATEAU, J. Age-related decline in rate of torque development is accompanied by lower maximal motor unit discharge frequency during fast contractions. Journal of Applied Physiology, v. 104, n. 3, p. 739–746, 2008.
29
MAFFIULETTI, N. A. et al. Rate of force development: physiological and methodological considerations. European Journal of Applied Physiology, v. 116, n. 6, p. 1091–1116, 2016.
MCLELLAN, T. M.; CALDWELL, J. A.; LIEBERMAN, H. R. A review of caffeine’s effects on cognitive, physical and occupational performance. Neuroscience and Biobehavioral Reviews, v. 71, p. 294–312, 2016. Disponível em: <http://dx.doi.org/10.1016/j.neubiorev.2016.09.001>.
MISHINA, M. et al. Age-related decrease in male extra-striatal Adenosine A1 receptors measured using 11C-MPDX PET. Frontiers in Pharmacology, v. 8, n. DEC, p. 1–7, 2017.
PICKERING, C.; GRGIC, J. Caffeine and Exercise: What Next? Sports Medicine, v. 49, n. 7, p. 1007–1030, 2019. Disponível em: <https://doi.org/10.1007/s40279-019-01101-0>.
POLITO, M. D. et al. Acute effect of caffeine consumption on isotonic muscular strength and endurance: A systematic review and meta-analysis. Science and Sports, v. 31, n. 3, p. 119–128, 2016. Disponível em: <http://dx.doi.org/10.1016/j.scispo.2016.01.006>. REYES, C. M.; CORNELIS, M. C. Caffeine in the diet: Country-level consumption and guidelines. Nutrients, v. 10, n. 11, 2018.
RIVERS, W. H. R.; WEBBER, H. N. The action of caffeine on the capacity for muscular work. The Journal of Physiology, v. 36, n. 1, p. 33–47, 1907.
RUIZ, J. R. et al. Association between muscular strength and mortality in men: Prospective cohort study. Bmj, v. 337, n. 7661, p. 92–95, 2008.
SCHETTINO, L. et al. Comparison of explosive force between young and elderly women: Evidence of an earlier decline from explosive force. Age, v. 36, n. 2, p. 893– 898, 2014.
SHERMAN, S. M. et al. Caffeine enhances memory performance in young adults during their non-optimal time of day. Frontiers in Psychology, v. 7, n. NOV, p. 1–9, 2016.
30
SOUTHWARD, K. et al. The role of genetics in moderating the inter-individual differences in the ergogenicity of caffeine. Nutrients, v. 10, n. 10, p. 1–12, 2018.
SPRIET, L. L. Exercise and Sport Performance with Low Doses of Caffeine. Sports Medicine, v. 44, p. 175–184, 2014.
TALLIS, J. et al. Is the ergogenicity of caffeine affected by increasing age? The direct effect of a physiological concentration of caffeine on the power output of maximally stimulated edl and diaphragm muscle isolated from the mouse. Journal of Nutrition, Health and Aging, v. 21, n. 4, p. 440–448, 2017.
THOMPSON, B. J. et al. Consistency of rapid muscle force characteristics: Influence of muscle contraction onset detection methodology. Journal of Electromyography and Kinesiology, v. 22, n. 6, p. 893–900, 2012. Disponível em: <http://dx.doi.org/10.1016/j.jelekin.2012.05.008>.
TRAJANO, G. S. et al. Can passive stretch inhibit motoneuron facilitation in the human plantar flexors? Journal of Applied Physiology, v. 117, n. 12, p. 1486–1492, 2014. TREVINO, M. A. et al. Acute effects of caffeine on strength and muscle activation of the elbow flexors. Journal of Strength and Conditioning Research, v. 29, n. 2, p. 513– 520, 2015.
WARREN, G. L. et al. Effect of caffeine ingestion on muscular strength and endurance: A meta-analysis. Medicine and Science in Sports and Exercise, v. 42, n. 7, p. 1375– 1387, 2010.
ZBINDEN-FONCEA, H. et al. Effects of caffeine on countermovement-jump performance variables in elite male volleyball players. International Journal of Sports Physiology and Performance, v. 13, n. 2, p. 145–150, 2018. Disponível em: <http://journals.humankinetics.com/doi/10.1123/ijspp.2016-0705>.
31 APPENDIX
A comparison between test-retest reliability of torque-generating
capacity in older and younger men
Abstract
Measuring ankle torque is of paramount importance. This study compared the test-retest reliability of torque-generating capacity between older and younger men. Twenty-one older (68±6 years) and 22 younger (25±5 years) men were tested twice for maximal isometric plantar flexion. Peak torque (PT), rate of torque development (RTD), and contractile impulses (CI) were obtained from 0-to-50 ms (RTD0-50; CI0-50) and from 100-200 ms (RTD100-200; CI100-200). Typical error as the coefficient of variation (CVTE) and intraclass correlation coefficient (ICC) were used to assess test-retest reliability. Student’s t-test were applied to investigate systematic errors. CVTE ratio was used for between-group comparisons. Only PT demonstrated acceptable reliability (ICC≥0.75 and CV≤10%). Older men demonstrated greater CVTE than younger men for PT (ratio=2.24), but lesser for rapid torque (ratio≤0.84). Younger men demonstrated systematic error for PT (6.5%) and CI100-200 (-8.9%). In conclusion, older men demonstrated greater variability for maximal torque output, but lesser for rapid torque. Key words: ageing, torque-time curve, rate of torque development, reproducibility, variability.
32 INTRODUCTION
The torque-generating capacity of plantar flexor muscles is of paramount importance for both performance and health. In terms of performance, evidence has shown that increasing running speed is more torque-demanding for the plantar flexors than for the knee extensors for athletes (Schache et al., 2011) and recreational runners (Petersen, Nielsen, Rasmussen, & Sørensen, 2014). Similarly, plantar flexor peak torque (PT) and rate of torque development (RTD) have been associated with greater jump performance (Muehlbauer, Gollhofer, & Granacher, 2013), further showing the importance of ankle strength in sport settings. When considering general health, evidence has shown that plantar flexor PT and RTD are associated with fall prevention and better mobility in older individuals (Bohrer, Pereira, Beck, Lodovico, & Rodacki, 2019), making the plantar flexors important for healthy and functional aging. Thus, measuring the torque-generating capacity of the plantar flexors provides relevant information for younger individuals seeking to improve performance and older individuals due to the relationship between ankle strength and better mobility, fall prevention, and consequently better health outcomes.
Rapid torque-generating capacity is likely most important during situations where the time to generate torque is restricted (e.g. jumping or kicking in sports, recovering balance from a stumble, etc.) (Maffiuletti et al., 2016). Accordingly, Ema et al. (2016) demonstrated that the ability to produce rapid plantar flexor torque was more important than peak torque for balance control in older men. However, other research has indicated that rapid torque-generating capacity demonstrates poor reliability (i.e. intraclass coefficient of correlation < 0.75 and coefficient of variation > 10%) (Webber and Porter, 2010; Maffiuletti et al., 2016). Furthermore, rapid torque measurements may be even worse in older individuals, since aging is associated with impaired motor control and a loss of lean muscle mass, including fast twitch fibers (Farrow, Biglands, Tanner, Hensor, & Emery, 2020). Although studies have compared the variability in torque-generating capacity of the plantar flexors between older and younger individuals
33
(Bemben, Massey, Boileau, & Misner, 1992; Challis, 2006), no studies have investigated the rapid torque production with the knee extended. Although testing plantar flexion with the knee bent is a scientifically sound method, it does not bridge the gap between science and practice, as the plantar flexors are affected by knee position (Mello, Magalhães, & Kohn, 2013) and the knee joint is mostly in an extended position during sport activities and daily tasks.
To make informed decisions regarding an individual change in torque-generating capacity, researchers and clinicians must be aware of the magnitude of error related to a target variable. In addition, it is important to investigate whether these aspects can affect older and younger individuals differently. Therefore, the aim of this study was to compare the test-retest reliability of torque-generating capacity between older and younger men. Based on the study of Bemben et al. (1992), it was hypothesized that older men would demonstrate poorer PT reliability than younger men.
METHODS
Participants
Twenty-one older (≥ 60 years old) and 22 younger (between 18 and 35 years old) men were recruited from a university population and from local public parks by advertisements, flyers, and word of mouth (Table 1). The participants were apparently healthy, physically active (e.g. accumulating ≥ 600 MET-min of moderate-intensity physical activities in a typical week) (Craig et al., 2003), and free from any musculoskeletal injury or chronic disease that could affect muscle performance. They were not taking any ergogenic aids or nutritional supplements during the study period and were advised to abstain from vigorous exercises 48h prior their first visit to the laboratory. The study protocol was approved by an Institutional Ethical Committee (#2.293.069) and participants signed an informed consent form.
34 Table 1. Participants’ descriptive data.
Variable Older Younger p-value
Age (yrs) 68 ± 6 25 ± 5 <0.001
Body mass (kg) 70 ± 11 77 ± 8 0.009
Height (cm) 168 ± 6 176 ± 6 <0.001
BMI (kg·m-2) 25 ± 3 25 ± 2 0.951
PA (MET-min·week-1) 3568 ± 2348 4743 ± 3716 0.560
Data are reported as mean ± standard deviation. BMI, body mass index. PA, weekly physical activity.
Study design
To investigate the test-retest reliability of isometric plantar flexors torque participants were required to visit the laboratory on three occasions (±1 hour), separated by 2 to 7 days. To control for the possible influence of circadian rhythms, all tests were performed in the morning (between 08:00 and 12:00). During the first visit, they filled out forms, had anthropometric measures taken, and were familiarized with the testing procedures. The following two visits were dedicated to the test-retest measurements.
Dynamometry
Participants were tested in a dynamometer (Biodex System 4 Pro®, Biodex Medical Systems, Shirley, USA). They were comfortably positioned on the dynamometer seat (reclined at 70º) with belts fastened across the pelvis and thigh to prevent movements that could affect ankle torque output. The lateral malleolus was aligned with the center of rotation of the dynamometer, and the ankle was positioned at 10° of dorsiflexion with the knee in full extension (Trajano, Seitz, Nosaka, & Blazevich, 2014). The chair and dynamometer settings were recorded for each individual during the first
35
visit and were used throughout the study. Before testing, participants performed repeated isometric plantar flexion with progressive level of efforts (from 20 to 100% of their perceived maximal), followed by a set of ~ 10 brief (< 1 s) and explosive isometric actions. Following the warm-up protocol, participants were asked to explosively push the dynamometer platform “as fast and as hard as possible” (Maffiuletti et al., 2016) for 4 s. Participants had 4 attempts to achieve their maximal performance with 30 s of rest between attempts. They received verbal encouragement throughout the tests and all testing procedures were conducted by the same examiner.
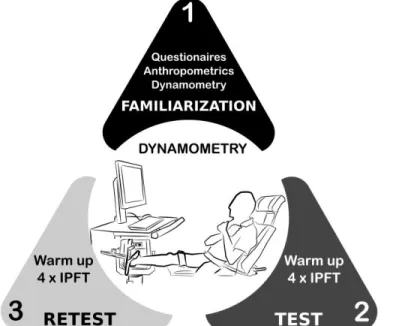
Figure 1. Overview of experimental protocol. Meetings were 2 to 7 days apart. Resting interval was 30 s between each maximal muscle action. IPFT, isometric plantar flexion torque.
Signal processing
The torque signal was sampled at 2 kHz (Miotec Miotool® 400 USB, Porto Alegre, Brazil). Maximal and rapid ankle torque variables were: peak torque (PT), and rate of torque development (RTD) and contractile impulses (CI) from 0 to 50 ms (RTD0-50; CI0-50) and from 100-200 ms (RTD100-200; CI100-200). PT was defined as the mean value of a 50 ms window containing the highest value of torque signal. The onset
36
of muscle contraction occurred when the torque signal reached a threshold of 2.5% of the PT value (Maffiuletti et al., 2016). Subsequently, RTD was calculated as the slope of the torque-time curve for 0 to 50 and 100 to 200 ms intervals, while CI was calculated as the area under the curve. All digital signal processing was performed by an automated custom software designed in MATLAB 6.5 (Mathworks, USA). All torque variables were normalized by body mass since younger presented a greater body mass than older men (Table 1).
Statistical analysis
Data normality was investigated by the Shapiro-Wilk test and by visual inspections on histograms and box and whisker plots. Outliers were removed (i.e. values > 1.5 box-length from the edge of the box) and all variables were natural log-transformed to reduce non-uniformity of error (Hopkins, 2015). Data were subsequently back-transformed and the modified Cox method was used to calculate the 95% confidence interval (Olsson, 2005). The Student’s t-test was used to investigate presence of systematic errors between days 1 and 2 and the magnitude of the difference (Cohen’s d) were calculated and interpreted as following: <0.20 = trivial; 0.20-0.49 = small; 0.50-0.79 = moderate; and > 0.8 = large (Cohen, 1988). The typical error expressed as the coefficient of variation (CVTE) (Will G Hopkins, 2000) and the intraclass correlation coefficient (ICC 3,1) were used to assess test-retest reliability. A CVTE < 10% and ICC ≥ 0.75 were considered as an acceptable level of reliability (Atkinson & Nevill, 1998; Merlet, Cattagni, Cornu, & Jubeau, 2018). The CVTE ratio (i.e. younger / older) was used to compare CVTE between groups. Values greater than 1.15 or lesser than 0.87 were considered as a substantial difference (W G Hopkins & Hewson, 2001). The smallest (SWC%), moderate (MWC%), and large (LWC%) worthwhile changes were calculated to investigate meaningful changes for each variable (Hopkins, 2015) and the within-participants CV% (CV%=100(e^SD-1)) was used to investigate variance individually (Bland & Altman, 1996). A custom-made (Microsoft
37
Excel) spreadsheet (Will G. Hopkins, 2015) and IBM SPSS (version 21.0) were used for statistical analyses.
RESULTS
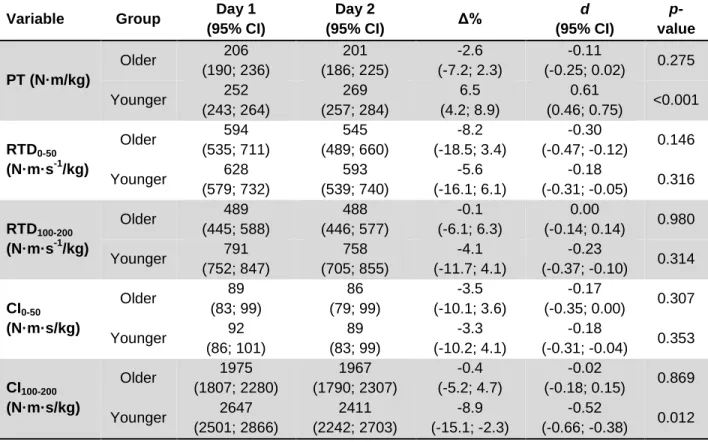
Table 2 presents the data from test-retest of torque-generating capacity obtained during isometric plantar flexors torque in older and younger men. Comparisons between days revealed moderate changes in torque generation only for younger men, where PT increased 6.5% (p < 0.001), while CI100-200 decreased 8.9% (p = 0.012).
Table 2. Data from test-retest of torque-generating capacity obtained during isometric plantar flexors torque in older and younger men.
Variable Group Day 1
(95% CI) Day 2 (95% CI) Δ% d (95% CI) p-value PT (N·m/kg) Older 206 (190; 236) 201 (186; 225) -2.6 (-7.2; 2.3) -0.11 (-0.25; 0.02) 0.275 Younger 252 (243; 264) 269 (257; 284) 6.5 (4.2; 8.9) 0.61 (0.46; 0.75) <0.001 RTD0-50 (N·m·s-1/kg) Older 594 (535; 711) 545 (489; 660) -8.2 (-18.5; 3.4) -0.30 (-0.47; -0.12) 0.146 Younger 628 (579; 732) 593 (539; 740) -5.6 (-16.1; 6.1) -0.18 (-0.31; -0.05) 0.316 RTD100-200 (N·m·s-1/kg) Older 489 (445; 588) 488 (446; 577) -0.1 (-6.1; 6.3) 0.00 (-0.14; 0.14) 0.980 Younger 791 (752; 847) 758 (705; 855) -4.1 (-11.7; 4.1) -0.23 (-0.37; -0.10) 0.314 CI0-50 (N·m·s/kg) Older 89 (83; 99) 86 (79; 99) -3.5 (-10.1; 3.6) -0.17 (-0.35; 0.00) 0.307 Younger 92 (86; 101) 89 (83; 99) -3.3 (-10.2; 4.1) -0.18 (-0.31; -0.04) 0.353 CI100-200 (N·m·s/kg) Older 1975 (1807; 2280) 1967 (1790; 2307) -0.4 (-5.2; 4.7) -0.02 (-0.18; 0.15) 0.869 Younger 2647 (2501; 2866) 2411 (2242; 2703) -8.9 (-15.1; -2.3) -0.52 (-0.66; -0.38) 0.012
38
Data are presented as mean (95% of confidence intervals). PT = peak torque; RTD = rate of torque development from 0 to 50 ms and from 100 to 200 ms; CI = contractile impulse from 0 to 50 ms and from 100 to 200 ms; Δ% = percentage change; d = effect size.
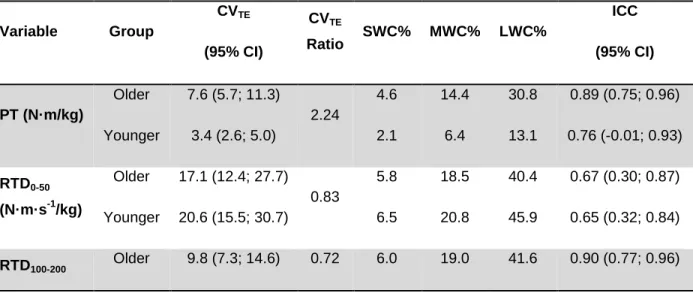
Table 3 presents the test-retest reliability and magnitude of meaningful changes for each variable measured. PT met the acceptable reliability criteria (CVTE < 10% and ICC ≥ 0.75) in both groups, while RTD100-200, CI0-50 and CI100-200 showed acceptable reliability criteria only for older men. Comparisons between-groups (i.e. CV ratio) revealed that younger men demonstrated lesser variability in PT than older men (3.4 vs 7.6 of CVTE), while opposite results could be observed for rapid force-generating capacity whereby older men demonstrated lesser variability than younger men in all rapid torque-generating variables. None of the variables displayed a CVTE ≤ SWC%, but the majority were capable of detecting moderate and large changes. RTD100-200 is able to detect only large changes.
Table 3. Test-retest reliability and magnitude of meaningful changes for force-generating capacity obtained during isometric plantar flexors torque in older and younger men. Variable Group CVTE (95% CI) CVTE Ratio SWC% MWC% LWC% ICC (95% CI) PT (N·m/kg) Older 7.6 (5.7; 11.3) 2.24 4.6 14.4 30.8 0.89 (0.75; 0.96) Younger 3.4 (2.6; 5.0) 2.1 6.4 13.1 0.76 (-0.01; 0.93) RTD0-50 (N·m·s-1/kg) Older 17.1 (12.4; 27.7) 0.83 5.8 18.5 40.4 0.67 (0.30; 0.87) Younger 20.6 (15.5; 30.7) 6.5 20.8 45.9 0.65 (0.32; 0.84) RTD100-200 Older 9.8 (7.3; 14.6) 0.72 6.0 19.0 41.6 0.90 (0.77; 0.96)
39 (N·m·s-1/kg) Younger 13.7 (10.3; 20.3) 3.7 11.4 24.1 0.49 (0.01; 0.76) CI0-50 (N·m·s/kg) Older 9.9 (7.2; 15.7) 0.84 4.1 12.8 27.3 0.78 (0.49; 0.92) Younger 11.8 (8.8; 17.6) 3.9 12.0 25.5 0.66 (0.32; 0.85) CI100-200 (N·m·s/kg) Older 7.0 (5.2; 10.9) 0.62 5.0 15.8 34.1 0.93 (0.81; 0.97) Younger 11.3 (8.5; 16.9) 3.6 11.4 24.0 0.58 (0.16; 0.81) PT = peak torque; RTD = rate of torque development from 0 to 50 ms and from 100 to 200 ms; CI = contractile impulse from 0 to 50 ms and from 100 to 200 ms; CVTE = typical error as coefficient of variation; SWC%, MWC%, LWC% = smallest, moderate, and large worthwhile change percentage; ICC = intraclass correlation coefficient; 95% CI = 95% of confidence interval.
Figure 2 shows the individual coefficient of variation (%) for each variable measured. It could be seen that the proportion of individuals exceeding the limit of 10% (red area) is superior for RTD and CI than PT. Although fewer younger men exceeded this limit for PT (2 versus 5), an inferior number of older men demonstrated CV > 10% for RTD and CI, which was more evident for RTD100-200 and CI100-200.
Figure 2. Individual coefficient of variation (CV) for older (●) and younger (○) men. PT, peak torque; RTD, rate of torque development from 0 to 50 ms and from 100 to 200 ms; CI, contractile impulse from 0 to 50 ms and from 100 to 200 ms. CV% were interpreted
40
as low (0 - 5%, green zone), moderate (>5 - <10%, yellow zone) and large (≥ 10%, red zone).
DISCUSSION
The present study verified and compared the test-retest reliability of variables (PT, RTD, and CI) related to torque-generating capacity obtained during isometric plantar flexion in younger and older men. Only PT demonstrated acceptable scores of reliability (i.e. ICC ≥ 0.75 and CV < 10%) in both younger and older men. Moreover, in agreement with our hypothesis, RTD100-200, CI0-50 and CI100-200 demonstrated acceptable scores only for older men, and only younger men demonstrated systematic error in their measures. The direct comparison between groups revealed that older men produced greater error in PT, but lesser error in RTD and CI. None of the variables, independent of the group, were able to detect the smallest meaningful change.
Based on previous studies (Clark et al., 2007; Maffiuletti et al., 2016; Webber & Porter, 2010), it was expected that PT would demonstrate better reliability than RTD or CI. Indeed, PT was the only variable that reached an acceptable level of reliability in both groups (Table 3). Interestingly, RTD100-200, CI0-50, and CI100-200 also demonstrated acceptable levels of reliability, but only for older men. Furthermore, older men produced greater variance in PT than younger men, but lesser variance for all the remaining variables related to rapid torque-generating capacity. The present result that older men produce greater test-retest variability for plantar flexion PT is in agreement with a previous study (Bemben et al., 1992) demonstrating that older men (> 60 years) had a greater CV (~14 vs 9%) than younger men (20 to 44 years). However, no other study to date has directly compared the reliability of rapid torque-generating capacity between older and younger individuals, and the present results show that older men produced more reliable RTD data than younger men. Another study demonstrated that older women (mean age 73 years) did not reach an acceptable level of reliability testing rapid torque-generating capacity (Webber & Porter, 2010). Webber and Porter (2010)
41
measured the plantar flexor muscles with knee flexed around 50° and analyzed the RTD at different intervals (0% to 50% and 40% to 80% of PT) compared to the present study. Beyond this, the authors did not provide a familiarization session and their participants had no previous experience with testing procedures. Therefore, it is possible that the disagreement between the present study and Webber and Porter (2010) may be attributed to differences in testing protocols and the presence of familiarization. Furthermore, the fact that only older men have demonstrated a reliable measure of rapid torque-generating capacity is an intriguing result. It can be speculated that older individuals have a reduced number of motor units to coordinate (Challis, 2006), which might explain the lower RTD values, but also the lower variability in their scores. However, this is purely speculative and cannot be determined from the data presented within.
Another interesting result was that only younger men demonstrated systematic error in their measures, as PT increased 6.5% and CI100-200 decreased 8.9% from the first testing day to the second. The reason for these differences might be due to learning effects (improving PT) and lack of motivation to repeat the test (impairing CI100-200). Theses systematic differences suggest that more sessions to familiarize younger men may have been necessary. Unfortunately, torque values produced during the familiarization session of this study was not recorded, which would have provided some additional information about the learning effect. However, the number of familiarization sessions needed to avoid learning were equivocal. Previous studies have suggested that three (Drake, Kennedy, & Wallace, 2018; Wallerstein, Barroso, Tricoli, Mello, & Ugrinowitsch, 2010), one (Libardi et al., 2016), or even no familiarization sessions are needed (Lund et al., 2005; Schaubert & Bohannon, 2005). Therefore, although it is possible, the amount of familiarization likely did not play a major role. Another study has suggested that the time of day might influence the participant’s motivation, since morning seems a non-optimal time for cognitive performance in younger individuals (Sherman, Buckley, Baena, & Ryan, 2016). However, we believe that CV%, as presented in Figure 2, could be observed and more trials or sessions should be required from those individuals demonstrating lack of consistency in test results (e.g. CV > 10%).
42
Therefore, we do not see this as a limitation of the present study, but as a consideration for those who wish to measure ankle flexor strength in younger and older men.
Although many of the investigated variables have demonstrated an acceptable level of reliability, it is important to note that none were capable of detecting the smallest worthwhile meaningful change (i.e. CVTE > SWC%). Therefore, it is important to note that is it unlikely that it would be possible to detect small changes in plantar flexor performance. Otherwise, all variables examined in this study were sensitive to detect moderate to large changes, except RTD100-200 for younger men in which merely large changes might be detected. This information is likely useful for studies investigating changes in performance. For instance, a moderate increase in force-generating capacity around 20%, as frequently reported following a period of strength training (Del Balso and Cafarelli 2007; Kobayashi et al. 2016), would be probably detected. Otherwise, a small acute difference as those induced by ergogenic aids (e.g. caffeine) might not be detected.
CONCLUSION
This study compared the reliability of maximal and rapid torque-generating capacity in older and younger men. The results revealed that older men demonstrated poorer reliability for maximal torque (i.e. peak torque), whilst demonstrating superior reliability for those variables related to rapid torque-generating capacity. Furthermore, only younger men demonstrated systematic changes in plantar flexor performance. Therefore, studies investigating force and/or torque-generating capacity should be aware that older men might have greater difficulty to reproduce their maximal muscular capacity, and younger men might need more trials to replicate performance in rapid “explosive” movements. As a result, researchers and practitioners need to be aware of these potential differences between older and younger men when planning their studies and/or clinical measurements.
43 REFERENCES
Atkinson, G., & Nevill, A. M. (1998). Statistical methods for assessing measurement error (reliability) in variables relevant to sports medicine. Sports Medicine, 26(4), 217– 238. Retrieved from https://doi.org/10.2165/00007256-199826040-00002
Bemben, M. G., Massey, B. H., Boileau, R. A., & Misner, J. E. (1992). Reliability of Isometric Force-time Curve Parameters for Men Aged 20 to 79 Years. Journal of Strength and Conditioning Research, 6(3), 158–164. Retrieved from https://doi.org/10.1519/00124278-199208000-00006
Bland, J. M., & Altman, D. G. (1996). Statistics Notes: Measurement error proportional to
the mean. BMJ, 313(7049), 106–106. Retrieved from
https://doi.org/10.1136/bmj.313.7049.106
Bohrer, R. C. D., Pereira, G., Beck, J. K., Lodovico, A., & Rodacki, A. L. F. (2019). Multicomponent Training Program with High-Speed Movement Execution of Ankle Muscles Reduces Risk of Falls in Older Adults. Rejuvenation Research, 22(1), 43–50. Retrieved from https://doi.org/10.1089/rej.2018.2063
Challis, J. H. (2006). Aging, regularity and variability in maximum isometric moments. Journal of Biomechanics, 39(8), 1543–1546. Retrieved from https://doi.org/10.1016/j.jbiomech.2005.04.008
Clark, B. C., Cook, S. B., & Ploutz-Snyder, L. L. (2007). Reliability of techniques to assess human neuromuscular function in vivo. Journal of Electromyography and Kinesiology, 17(1), 90–101. Retrieved from https://doi.org/10.1016/j.jelekin.2005.11.008 Cohen, J. (1988). Statistical power analysis for the behavioral sciences, 2nd Edition. Hillsdale (NJ): Lawrence Erlbaum Associates.