From the Department of Orthopedics and Traumatology, Hospital das Clínicas, Faculty of Medicine, University of São Paulo.
ISOKINETIC DYNAMOMETRY OF KNEE FLEXORS
AND EXTENSORS: COMPARATIVE STUDY AMONG
NON-ATHLETES, JUMPER ATHLETES AND RUNNER
ATHLETES
Cássio Marinho Siqueira, Fábio Ribeiro Mendes Mota Pelegrini, Maurício Furginelli Fontana and Julia Maria D. Greve
RHCFAP/3064
SIQUEIRA CM et al. - Isokinetic dynamometry of knee flexors and extensors: comparative study among non-athletes, jumper athletes and runner athletes. Rev. Hosp. Clin. Fac. Med. S. Paulo 57(1):19-24, 2002.
Participation in intensive sports activities leads to muscular specializations that may generate alterations in involved articular forces and cause static (posture) and dynamic changes (alterations of articular stability, coordination, etc.). Prevention of injury requires specific functional muscular evaluation in all athletes and for any kind of sport.
OBJECTIVE: To dynamically evaluate, through isokinetic tests, the peak torque, total work, and average power of the knee flexor and extensor muscles of jumper and runner athletes and compare them to those of a non-athletic population, evaluating dominance and balance between agonistic and antagonistic muscle groups.
RESULTS: In the non-athlete group, we noted a higher asymmetry between the dominant and nondominant members. The jumpers had the highest values of the evaluated parameters of all groups, whereas parameters for the runners were intermediate between non-athletes and jumpers.
DESCRIPTORS: Isokinetic. Muscular strength. Sport. Knee. Muscular balance.
Training and sports practice result in the development of a specific mus-culature according to the modality practiced1. These muscular
specializa-tions may initiate an imbalance of the forces acting statically and dynami-cally on the joints and lead to altera-tions of posture or of articular mechan-ics. This muscular imbalance may pre-dispose athletes to injury and reduction of performance2-9.
Isokinetic dynamometry is widely used for muscular function studies be-cause it facilitates a dynamic, objec-tive, accurate, and reproducible evalu-ation. This measurement is feasible for the resistance applied to the movement and can be adapted to permit a constant angular velocity during the whole range of motion; thus, it optimizes the
load, which is always the maxi-mum2,3,10-13. This evaluation allows us
to characterize the muscular alterations resulting from the practice of sports, leading to the improvement of per-formance, training specificity, and in-jury prevention.
The objective of this study was to evaluate through isokinetic tests the muscular condition of knees of jump-ers (triple and distance) and runner ath-letes (100 and 200 m), and make com-parisons within these groups and with a non-athletic population.
METHODS
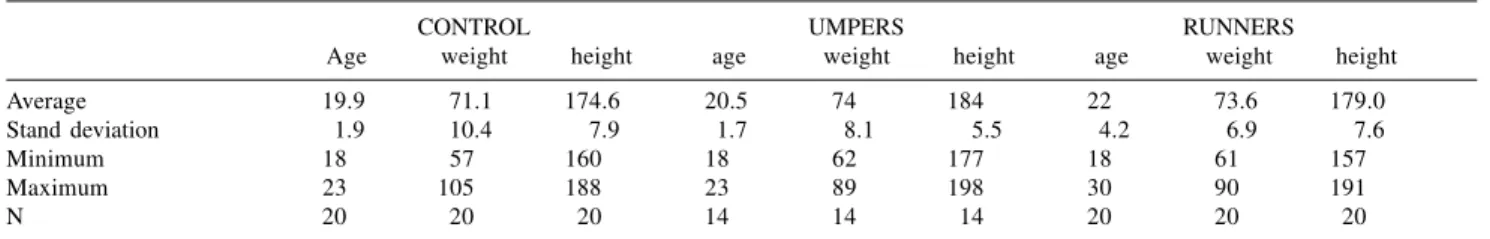
Fifty-four volunteers divided into 3 groups—20 runners, 14 jumpers, and 20 non-athletes (Control Group)— were evaluated (Table 1). The criteria for inclusion were age between 18 and 30 years, masculine sex, and absence of diseases of the musculoskeletal sys-tem. All athletes were training at the competitive level with a minimum training burden of 3 hours daily, 6 days a week. The duration of the sports practice was at least 1 year.
seated with a 90º hip flexion on the knee module, aligning the knee move-ment axis with the dynamometer axis. Three submaximal repetitions were performed for adaptation to the speed. The knee flexor and extensor were tested regarding their concentric activi-ties at the 60 and 240 º/second veloci-ties with correction for gravitational force. The evaluated parameters were peak torque (PT), measured in newton-meters; total work (TW), measured in joules; and average power (POT), measured in watts. All measurements were corrected for the body weight of each individual and were expressed in percentage of that weight. This index, which is suggested by the equipment manufacturer, is widely used in clini-cal practice and research that employ isokinetic evaluation, helps in the cor-relation of the parameters evaluated with anthropometric data, and serves as a correction factor14. The relationship
between the flexor and extensor groups was also evaluated for PT and TW at both velocities. Limbs were grouped according to the dominance given by the side preferably used for the kick. Within each group and for every vari-able, comparisons were made between the dominant and the nondominant sides. Groups were also compared among themselves for all evaluated pa-rameters as well as for dominance.
Concerning data analysis, a basic statistical study was conducted on or-dinal parameters covering average, standard deviation, standard error of mean, maximum and minimum values, and number of cases. Comparisons
be-tween the listed parametric ordinal samples (dominant and nondominant members of the same group) were made with the Student t test. For
com-parisons among more than 2 independ-ent parametric ordinal samples, ANOVA variance analysis was used, and the t test was applied for more
spe-cific comparison between groups, as-suming different variances. The signifi-cance level was 5%.
RESULTS
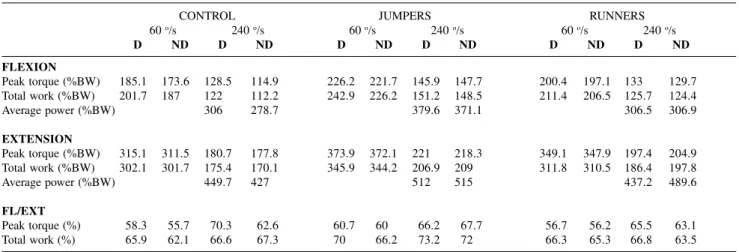
Table 2 shows the averages ob-tained for each group in every param-eter evaluated.
When comparing dominant and nondominant limbs within each group, there was a statistically significant dif-ference in the Control Group regarding the flexor PT and TW at 60 º/s. There was also a significant difference in the PT at 240 º/s, with the dominant side being higher than the nondominant. There was also a significant difference in the PT parameter of the flexion/ex-tension relationship of the Control Group. In the Runners Group, there was a significant difference in the power of the extensors, where the nondominant side was higher.
Comparison between the groups showed that the Jumpers Group had significantly higher results than the Control Group in almost all parameters evaluated. The one exception was for the flexor PT and extensor POT of the dominant limb at 240 º/s.
The difference of the flexor PT of
the nondominant side at both speeds between the Jumpers Group and Con-trol Group was significant. When com-paring these two groups regarding ex-tension, differences were found be-tween the PT of dominant and nondo-minant limbs at 60º/s, and among the PT, TW, and POT of the nondominant limb at 240 º/s.
Finally, between the Jumpers Group and Runners Group, there was a signifi-cant difference in all flexion parameters, with exception of the flexor PT of the dominant side at both speeds.
DISCUSSION
The evaluation of human muscular performance has been the aim of many studies, primarily for objective docu-mentation of efficacy of therapeutic procedures for rehabilitation of muscu-loskeletal system injuries, as well as for identifying deficiencies in muscular strength and determining the relative strength of antagonist muscle groups as they are influenced by dominance. Many authors have tried to establish normative data for muscular evaluation in various populations that might serve to orientate a rehabilitation program and aid in the detection of the causes of musculoskeletal system injuries, thereby facilitating preventive action2-4,11.
Isokinetic dynamometry was used for evaluating the muscular perform-ance of jumper and runner athletes. The tests were performed at 2 angular speeds because muscular torque
Table 1 - Casuistic presentation: age (years), weight (kg), height (cm).
CONTROL UMPERS RUNNERS
Age weight height age weight height age weight height
Average 19.9 71.1 174.6 20.5 74 184 22 73.6 179.0
Stand deviation 1.9 10.4 7.9 1.7 8.1 5.5 4.2 6.9 7.6
Minimum 18 57 160 18 62 177 18 61 157
Maximum 23 105 188 23 89 198 30 90 191
(strength) must be evaluated at lower velocities (60 º/s), and power at a high velocity (240 º/s)2-4,11. When evaluating
both speeds, the muscular specializa-tion of the individual can usually be better observed as the sports activities are performed at high velocities.
Our results showed significant dif-ferences between dominant and non-dominant limbs only in knee flexors of the Control Group, where the dominant side is stronger than the nondominant.
Concerning the knee extension of the non-athletic group, at 60 º/s in all evaluated parameters, the dominant limb had averages higher than the nondominant one, though not reaching levels of statistical significance. These results show that there is a small ten-dency towards asymmetry with preva-lence of the dominant side, which was defined in this study as the side pre-ferred for kicking.
Concerning extensor power (POT),
the Runners Group had significantly higher scores on the nondominant side, and the Jumper Group had a tendency towards higher scores with the non-dominant-side extensors. These differ-ences may be related to the prevailing function of each limb in locomotion. The nondominant limb has a higher support function, requiring greater ac-tion of the knee extensors in absorbing power (to restrain movements) in rela-tion to the other leg during the mean stance phase. The dominant leg has a propulsion function, and during the fi-nal stance phase, greater muscular ac-tivity and high power development oc-curs in the hip and ankle compared to that in the nondominant limb9,15.
Therefore, we believe that since the activity of these athletes is related to locomotion at high speeds, the per-formance in the nondominant side in the 240º/s tests was superior to that of the dominant side because of the greater muscular action occurring in the knee of the supporting limb. This difference in the predominant functions of the limbs would not have much im-portance for the non-athletes, since running is not the primary motor activ-ity contributing to their acquisition of
Table 2 - Averages of peak torque, total work and average power of knee flexors and extensors corrected for body weight and
expressed in %, and relationship between flexor and extensor muscles for the peak torque and total work parameters at 60º/ s and 240º/s speeds of the dominant and nondominant sides in the 3 groups evaluated.
CONTROL JUMPERS RUNNERS
60 o/s 240 o/s 60 o/s 240 o/s 60 o/s 240 o/s
D ND D ND D ND D ND D ND D ND
FLEXION
Peak torque (%BW) 185.1 173.6 128.5 114.9 226.2 221.7 145.9 147.7 200.4 197.1 133 129.7 Total work (%BW) 201.7 187 122 112.2 242.9 226.2 151.2 148.5 211.4 206.5 125.7 124.4
Average power (%BW) 306 278.7 379.6 371.1 306.5 306.9
EXTENSION
Peak torque (%BW) 315.1 311.5 180.7 177.8 373.9 372.1 221 218.3 349.1 347.9 197.4 204.9 Total work (%BW) 302.1 301.7 175.4 170.1 345.9 344.2 206.9 209 311.8 310.5 186.4 197.8
Average power (%BW) 449.7 427 512 515 437.2 489.6
FL/EXT
Peak torque (%) 58.3 55.7 70.3 62.6 60.7 60 66.2 67.7 56.7 56.2 65.5 63.1
Total work (%) 65.9 62.1 66.6 67.3 70 66.2 73.2 72 66.3 65.3 66.8 63.5
D = dominant; ND = nondominant; (%BW) = absolute values of parameters corrected by the body weight and expressed as percentage of the latter.
Table 3 - Statistical probability (P) values in the comparison between the dominant
and nondominant limbs of each group at the 2 testing speeds (60 and 240 o/s).
CONTROL JUMPERS RUNNERS
60o/s 240o/s 60o/s 240o/s 60o/s 240o/s FLEXION
Peak torque (%BW ) 0.009* 0.044* 0.43 0.72 0.357 0.64
Total work (%BW) 0.009* 0.07 0.09 0.66 0.238 0.88
Average power (% BW) 0.06 0.66 0.99
EXTENSION
Peak torque (%BW) 0.67 0.54 0.88 0.68 0.87 0.3
Total work (%BW) 0.956 0.23 0.68 0.74 0.85 0.81
Average power (% BW) 0.11 0.89 0.048*
FL/ EXT
Peak torque (%) 0.172 0.0001* 0.8 0.63 0.7 0.46
Total work (%) 0.08 0.8 0.25 0.75 0.5 0.41
muscular strength; other activities that require more muscular action of the dominant-side knee are more signifi-cant for them.
When comparing the groups, we found that in almost all parameters studied, even when the differences were not statistically significant, the averages for the Jumper Group were always higher, followed by the Runner Group, and then by the Control Group. The Jumper Group surpassed the Control Group in practically all param-eters evaluated, demonstrating two dis-tinct groups as to the muscular perform-ance in the knee joint. The Runners Group had scores that were between those of the other two groups. Runners are athletes characterized by developing high values of peak torque, which how-ever, decreases rapidly during the range of motion, as seen through evaluation of the total work. They had higher scores in the extensors than in the flexors. Thus, the runners’ extensors are equal to those of the jumpers, and the flexors are equal to those of the controls, being superior only at PT.
These results have practical impor-tance because these athletes are fre-quently thought to constitute a homog-enous group, since the modalities have similar characteristics, and some
ath-letes even practice two types of sports. However, by the dynamic muscular characteristics, these groups are differ-ent and require a more specific ap-proach.
No significant differences were found in the comparison of the groups as to the relationships between flexor and extensor musculature; muscular balance is statistically equal in the 3 groups. However, if we analyze the av-erages of this relationship regarding the peak torque, we shall find that the jumpers constitute the most “balanced” group while, the runners are the most “imbalanced”, and the controls are in-termediate between these groups. But, if we analyze this relationship regard-ing the total work, the runners appear “more balanced” than the Control Group.
The relationship between antago-nistic muscles is controversial2-5,12,16-18.
This relationship is traditionally de-fined as dividing the strength of the weaker muscle by that of the stronger one when both are in concentric activ-ity. This approach has been criticized for not being functional19, since the
an-tagonistic muscle acts eccentrically and also because when considering the peak-torque relationship, we are meas-uring 2 different points of the
move-ment range. Even so, many authors re-late this muscular imbalance to inju-ries, while others think that this evalu-ation cannot be made with the existing data. Baratta and Solomanow5
demon-strated that the action of the hamstring as an antagonist is intimately con-nected with its concentric action; that is, its antagonist action is directly pro-portional to its capacity to generate force concentrically. We thus believe that the form traditionally used for measuring the relationship between muscles gives us an idea about the re-lationship of forces acting over the joints, and we therefore can propose preventive and therapeutic actions.
CONCLUSIONS
• The dominance factor is only sig-nificant for non-athletes. Athletes tend to have symmetric limbs and greater performance of the nondominant side at high speeds. • The groups differ among
them-selves; jumpers have higher aver-ages in all parameters.
• Runners are characterized by hav-ing a high peak torque that is not maintained for total work. Their ex-tensor muscles perform better than
Table 4 - Statistical probability (P) values in the comparison among the groups at the 2 testing speeds.
Control x Jumpers Control x Runners Runners x Jumpers
60 o/s 240 o/s 60 o/s 240 o/s 60 o/s 240 o/s
D ND D ND D ND D ND D ND D ND
FLEXION
Peak torque (% BW) 0.004* 0.0005* 0.09 0.0001* 0.068 0.001* 0.64 0.04* 0.058 0.047* 0.25 0.023* Total work (% BW) 0.006* 0.005* 0.01* 0.0001* 0.34 0.056 0.67 0.17 0.036* 0.005* 0.033* 0.012*
Average power (% BW) 0.01* 0.0001* 0.98 0.21 0.001* 0.01*
EXTENSION
Peak torque (% BW) 0.01* 0.005* 0.002* 0.001* 0.006* 0.003* 0.09 0.002* 0.24 0.22 0.065 0.24 Total work (% BW) 0.01* 0.047* 0.01* 0.003* 0.32 0.37 0.22 0.002* 0.054 0.1 0.11 0.37
Average power (% BW) 0.12 0.008* 0.63 0.012* 0.078 0.43
FL/EXT
Peak torque (% ) 0.37 0.15 0.16 0.1 0.53 0.85 0.22 0.88 0.15 0.2 0.85 0.24
Total work (% ) 0.19 0.25 0.1 0.29 0.87 0.3 0.95 0.45 0.25 0.79 0.23 0.11
those of non-athletes, which is not true of the flexor muscles.
• There are no differences among the groups regarding the relationship between flexors and extensors.
FINANCIAL SUPPORT
• Scholarship for initial Scientific re-search from the State of São Paulo Foundation for Scientific Research
Support (FAPESP): Cássio Mari-nho Siqueira.
• Additional support from the above foundation: Pentium III computer.
RESUMO RHCFAP/3064
SIQUEIRA CM e col. - Dinamometria isocinética de flexores e extensores de joelho: comparação entre atletas saltadores, velocistas e grupo não atleta. Rev. Hosp. Clín. Fac. Med. S. Paulo 57(1):19-24, 2002.
A prática esportiva leva às especia-lizações musculares que podem gerar alteração nas forças atuantes articulares e causar alterações estáticas (postura) e dinâmicas (alteração da estabilidade ar-ticular, alteração da coordenação, etc.).
A prevenção de lesões deve ser feita através de uma avaliação funcional muscular específica em todos os atletas e em qualquer modalidade esportiva.
OBJETIVO: Avaliar
dinamica-mente, por testes isocinéticos, o torque máximo, o trabalho total, e a potência média dos músculos flexores e exten-sores do joelho de atletas saltadores e velocistas, comparando-os com uma população não atleta em relação à dominância e equilíbrio entre agonistas e antagonistas.
RESULTADOS: Nota-se maior
assimetria entre os membros dominan-te e não dominandominan-te no grupo de não atleta. Entre os grupos verifica-se que os saltadores têm valores maiores dos parâmetros avaliados, os velocistas têm parâmetros intermediários entre os não atletas e saltadores.
DESCRITORES: Isocinético.
Força muscular. Esporte. Joelho. Equilíbrio muscular.
REFERENCES
1. SCRANTON Jr PE, WHITESEL JP & FAREWELL V - Cybex evaluation of the relationship between anterior and posterior compartment lower leg muscles. Foot Ankle 1985;6:85-89. 2. OSTERNIG LR - Isokinetic dynamometry: implications for muscle
testing and rehabilitation. Exerc Sport Sci Ver 1986;14:45-80. 3. PERRIN DH A brief introduction to isokinetics. In: PERRIN DH
-Isokinetic exercise and assessment. Champaign, IL, Human Kinetics Pubs, 1993. p.1-9.
4. OSTERNIG LR, HAMILL J, LANDER JE et al. - Co-activation of sprinter and distance runner muscles in isokinetic exercise. Med Sci Sports Exer 1986;18:431-435.
5. BARATTA R, SOLOMONOW M, ZHOU BH et al. - Muscular coactivation. The role of the antagonist musculature in maintaining knee stability. Am J Sports Med 1988;16:113-122.
6. GRACE TG – Muscle imbalance and extremity injury. A perplexing relationship. Sports Med 1985;2:77-82.
7. GOSLIN BR & CHARTERIS J - Isokinetic dynamometry: normative data for clinical use in lower extremity (knee) cases. Scand J Rehab Med 1979;2:105-109.
8. VAN MENCHELEN W - Running injuries. A review of the epidemiological literature. Sports Med 1922;141:320-335. 9. CANAHM H & ELLIOTT D - Pedal asymmetry in the reproduction
of spatial locations. Cortex 1987;23:157-159.
10. ELLIOT J - Assessing muscle strength isokinetically. JAMA 1978;240:2408-2410.
11. IMAMURA M - Avaliação isocinética dos pés de homens adultos normais. São Paulo, 1994. (Tese - Faculdade de Medicina, Universidade de São Paulo).
13. MOFFROID M, WHIPPLE R, HOFKOSH J et al. - Study of isokinetic exercise. Phys Ther 1969; 49:735-749.
14. FERNANDES TBF & SHINZATO GT - Avaliação isocinética de rotadores externos e internos do ombro de atletas sobre cadeira de rodas e indivíduos sedentários - estudo comparativo. Acta Fisiátrica, 1999; 6(1):40-44.
15. SADEGHI H, ALLARD P & DUHAIME M - Functional gait asymmetry in able-bodied subjects. Human Movement Science 1997; 16:243-258.
16. PÉCINA M & BOJANIC I - Overuse injuries of the musculoskeletal system. Boca Raton, CRC Press, 1993.
17. SOMMER HM - Patellar chondropathy and apicitis, and muscle imbalances of the lower extremities in competitive sports. Sports Med 1988;5(6):386-394.
18. PIEPER HG, SCHNEIDER A & WOLF U - Muscular imbalance in elite swimmers and resulting sports damage of the lumbar spine and knee joints. Sportverletz Sportschaden 1989; 3(1):29-31. 19. CALMELS PM, NELLEN M, VAN DER BORNE et al. - Concentric
and eccentric isokinetic assessment of flexor-extensor torque ratios at the hip, knee, and ankle in a sample population of healthy subjects. Arch Phys Med Rehabil 1997; 78(11):1224-1230.