Porosity Characterization of Iron Ore Pellets by X-Ray Microtomography
Karen Soares Augustoa*, Sidnei Paciornika
Received: July 04, 2017; Revised: November 30, 2017; Accepted: December 14, 2017
This work proposes a three-dimensional methodology to characterize porosity in iron ore pellets by X-ray Microtomography (microCT). An image analysis routine was developed to discriminate and quantify open/closed porosity. The results were compared to the traditional techniques of mercury intrusion porosimetry (MIP) and optical microscopy (OM). As expected, the porosity values obtained from microCT were much lower than those from MIP and OM, due to the lower spatial resolution of the proposed technique. However, the resolution can be optimized to detect the main peak of the pore size distribution, close to 10 µm. MicroCT was also able to discriminate between open and closed porosities, and revealed the volumetric spatial distribution of the pores, parameters that cannot be obtained from the other techniques. Thus, microCT may become a new standard for this analysis, eliminating the need for specimen preparation (as for OM) or the use of toxic materials (as in MIP).
Keywords: Iron ore pellets, Porosity characterization, X-ray microtomography, Image analysis.
*e-mail: [email protected]
1. Introduction
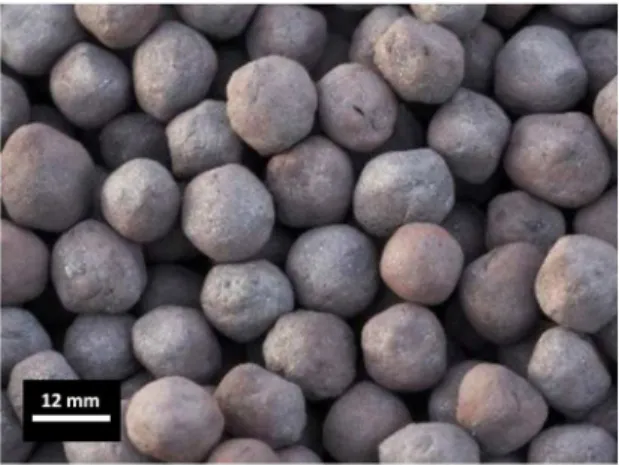
Iron ore pellets (Figure 1) are one of the main raw materials for steelmaking. They are produced from ore fines in a process called pelletizing, which consists of two basic steps; the first is the formation of the soft green pellet from the iron ore fines and the second step requires a heat treatment to harden the pellet, which in its green state does not have sufficient physical resistance for the steelmaking process1. The final pelletized product must be a porous material, to allow heat transfer and gas flow in the reduction furnaces, and must also have adequate mechanical strength for the smelting process.
The pores, in general, can be classified according to their accessibility to the external fluid. Closed pores consist of pores that are inaccessible to the external fluid and totally isolated from other pores. These pores influence the density, elasticity, mechanical strength and thermal conductivity of the material. However, they are irrelevant to processes where there is fluid flow and adsorption of gases. On the other hand, open pores are those that have a channel of communication with the outer surface of the solid, allowing the transport of fluids and, consequently, the transfer of heat internally. Thus, the ideal pore structure for the material to have high reducibility is that of open pores, but for it to also have sufficient mechanical strength, it must have a low porosity value. There are many factors that may be related to the formation and structure of pores in iron ore pellets, such as the amount of raw materials and temperature in the manufacturing process. The control of these variables can contribute to the improvement of the quantity and shape of
the pores. As reducibility and physical resistance of a material are related to its porosity2, the microstructural characterization of iron ore pellets is an important step for quality control.
There are several techniques for characterizing porosity3-4, but it is difficult to find a method that covers a wide range of pore sizes. In addition, pore shape and connectivity significantly affect porosity results and these depend on the physical principles involved in the performed tests. Finally, the porosity can be affected by the analysis itself (e.g. during specimen preparation), what can compromise the physical integrity of the material. A combination of several methods can be used to provide a better understanding of pore size, shape and structure.
Porosity in iron ore pellets is traditionally quantified by optical microscopy (OM) and mercury intrusion porosimetry (MIP). In OM, the most common phases are easily discriminated by their reflectance5, thus providing data on area fraction, size distribution, and pore morphology. However, it is a technique limited to a two-dimensional space, i.e. information only of sections or surfaces. Moreover, OM samples require preparation steps (mounting, polishing etc.), steps that are destructive, time consuming and that can compromise the quality of the material, thus rendering subsequent analyzes by other techniques impossible.
MIP is only able to evaluate the open pores. The closed pores, which have a greater influence on the physical resistance of the pellets, cannot be evaluated by this method. Moreover, it is a destructive technique, like OM, and uses mercury, which is a volatile and toxic metal.
MicroCT is a well-established three-dimensional technique, which provides internal and external information of the structure of solid materials6. This technique is able to
aDepartamento de Engenharia Química e de Materiais - DEQM, Pontifícia Universidade Católica do
carry out 3D measurements, and requires little or no sample preparation.
A literature search revealed just a few papers on the 3D characterization of iron ore agglomerates. Bhuyan et al. proposed a quantitative method for the analysis of pores in green pellets by microCT, in which they successfully validated a stereological method developed for Scanning Electron Microscopy (SEM) images, applied it to microCT 2D layers and compared the results with true 3D measurements7. The choice of the best segmentation threshold for microCT images was obtained by fitting the data from microCT to the SEM data. The authors concluded that microCT can be used to measure total porosity after calibrating the system with SEM images, but offers a rough estimate for the average diameter, due to resolution restrictions.
Forsberg and Hjortsberg studied the development of cracks in pellets during the reduction process, interrupting the reduction at 4 time points and performing microCT analysis at each point8. They were able to analyze the crack network during reduction, correlating the crack volume and the experimental conditions to the pellets resulting properties. The various crack geometries were also characterized and related to their impact on propagation and material strength. Shatokha et al. studied the porosity of iron ore sinters by microCT, comparing samples with different chemical compositions. They developed an image analysis methodology to obtain only the volume of open pores and compared the results with those obtained by MIP. The authors found lower open porosity values in MIP due to the limit of the equipment used, in which only pores up to 329 µm were evaluated. They also confirmed the increase of the reducibility with the increase of the number of open pores, analyzing samples with different basicities at different reduction times9.
Other studies compared porosity measurements by microCT with other techniques for different materials. Zong et al. used three different techniques (Nitrogen adsorption/ desorption, MIP and Syncthroton-radiation based microCT) to quantitatively describe the pore characteristics (within a wide range of sizes) of soil samples. The authors quantified
different pore diameter ranges according to each technique used and they were able to distinguish characteristics such as volume, distribution of size and shape among soil types. So, the combination of the different techniques provided relevant data, allowing the evaluation of the soil structure10. Cnudde et al. compared and combined results obtained by MIP, water absorption under vacuum and microCT in samples of concrete, sandstone and limestone, to determine the advantages and limitations of the methods. The authors concluded that it is difficult to compare the three methods, but the combination of the results may provide additional information relevant to the characterization11.
Thus, the present work proposes a methodology to characterize the porosity of iron ore pellets by microCT, in order to complement or even replace the classic techniques mentioned above. The methodology in question should be able to study separately open and closed porosity, which are not distinguished by the traditional techniques. Comparisons of the results obtained by microCT with the OM and MIP techniques were performed to better understand the limitations of each technique.
2 Materials and Methods
2.1 Samples
The Vale mining company (Vale) provided 24 blast furnace iron ore pellets from 2 distinct sources, named P1 and P2. As microCT is a non-destructive technique, all samples were initially analyzed by the proposed technique, after which part of the samples was analyzed by MIP and the remainder by OM.
2.2 X-ray microtomography
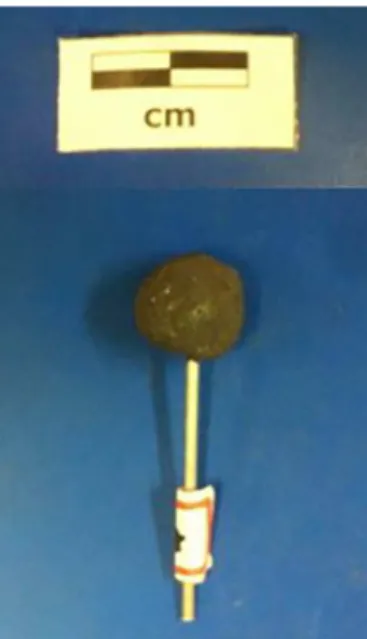
No sample preparation was required for the microCT analysis. The whole sample was placed in a thin cylindrical support in order to fit into the microCT sample holder, thus defining the z-axis of the experiment (Figure 2). Later, this same axis served as the guide to the cutting, mounting and polishing preparation for the OM analysis.
In this work an X-ray microscope, ZEISS Xradia 510 Versa, was used. This equipment combines the simple geometric magnification, dependent on source-sample-detector distances, to optical magnification obtained with an optical microscope. Each optical lens is fitted with a scintillator that converts X-rays to light.
In a first stage, 16 iron ore pellets were analyzed using two different lenses for each sample: 0.4X and 4X. The 0.4X lens was used to obtain a tomogram of the entire pellet and thus allow a comparison with MIP, which also uses whole pellets. With the 4X lens the images represented a smaller volume of interest (VOI) in the center of the pellets, with higher spatial resolution.
A spatial resolution of approximately 8 µm was reached with the 0.4X lens for a total scan time of 10.6 h. For the 4X lens a resolution of approximately 4 µm was achieved, for total scan time of 5.9 h. All analyzes in this step were performed with 4000 projections.
Subsequently, 10 of these samples were analyzed by MIP and the other 6 by OM.
In a second stage, 8 pellets were analyzed by microCT, but only with the 0.4X lens, under the appropriate geometric conditions to reach a spatial resolution of approximately 4 µm. The rationale here was to image as much of the pellet volume as possible, but with a resolution similar to the VOI images obtained with the 4X lens. This required a large increase in the sample-detector distance, leading to much lower SNR, what implied in an increase of the exposure time. At this point, in order to limit the scan time, experiments were carried out with fewer projections. It was found that 1600 projections were a lower limit to still allow good discrimination of pores. In these conditions the total scanning time was 17.4 h. From this set of samples, 6 were analyzed by MIP and 2 by OM.
After microCT acquisition the images were processed by FIJI/ImageJ12; CTAn (Bruker, Belgium); and ORS Visual SI (Object Research Systems, Canada).
2.3 Mercury intrusion porosimetry
MIP analysis was performed in whole pellets two by two, without any previous preparation.
A Micromeritics porosimeter model AutoPore III, in the low and high pressure ranges (up to 60000 psi), was used to analyze meso- and macropores with diameters between 0.003 and 360 µm.
2.4 Optical microscopy
The pellets that were reserved for OM analysis were polished as shown in Figure 3, so that the internal structure of the pellet was exposed. Using the same support as used in the microCT analyzes ensured that the exposed surface was a plane close to that obtained from reconstruction of the CT scans, that is, perpendicular to the z-axis (see Figure 2).
Figure 2. Sample for microCT analysis.
Figure 3. Sample preparation for OM: (a) mounted in resin; (b)
fixed by a support so that the pellet does not move; (c) sample ready
for surface preparation; (d) cutting and polishing of the sample; (e) Polished samples.
The images were acquired with a Carl Zeiss light microscope model AxioImager Z2m. Mosaics were captured with a 10X lens (1.06 µm resolution) in order to obtain images of the whole surface of the pellet. A typical pellet image in reflected light is shown in Figure 4. Subsequently, the OM images were processed by the FIJI and CTAn software.
3 Results and Discussion
3.1 X-ray microtomography
3.1.1 Image acquisition
4X lens for the same pellet. Figures 5e and 5f compare the area and volume imaged with the two lenses. The smaller VOI is roughly 1/9 of the larger one.
The VOI captured with the 4X lens was not representative of the pellet porosity, since just the center was imaged and that is where porosity is normally highest. To increase sampling, one could resort to the acquisition of a 3D mosaic composed of several tomographs along the z-axis. But that would take a long time and still capture only a cylindrical VOI along the center line of the pellet.
Increasing the sample to detector distance, reaching the limit of the geometrical configuration of the equipment, a 4 µm resolution was achieved with the 0.4X lens, while imaging a much larger VOI, as shown in Figure 6. However, as mentioned in the Materials and Methods section, the drawback is that acquisition time was increased by approximately 70%.
Figure 4. Optical microscope image mosaic covering the entire cross section of a pellet.
Figure 5. 1st stage of analysis with different lenses and resolutions. Left column: representative 2D layers. Right column: corresponding
3D volumes. (a, b) 0.4X (8 µm); (c, d) 4X (4 µm); (e, f) comparison between 4X and 0.4X areas and volumes.
Figure 6. 2nd Stage of analysis with the 0.4X lens at 4 µm resolution: (a) 2D layer; (b) Corresponding 3D volume; (c) Comparison between
analyzed volumes with the same 0.4X lens at different resolutions.
3.1.2 Image processing and analysis
The image processing and analysis followed the conventional sequence13. In the pre-processing step the Non-Local Means14 noise reduction filter, an edge-preserving low-pass filter available as a FIJI/ImageJ plugin, was applied. Next, edge enhancement was performed using a so-called delineate15 function that makes edge transitions sharper, while keeping non-edges untouched. The impact of these two pre-processing steps can be seen in Figure 7, as well as in their respective histograms, where the peaks corresponding to the pores and solid become more evident, with a more pronounced valley between them.
automatic contrast expansion13 was applied to all layers. The results for 2 representative layers are shown in Figure 8. The red dotted lines show a threshold selected in a minimum of the top image histograms. Before contrast expansion (Figures 8a and 8c) this threshold did not correspond to a minimum in the bottom image histograms. After contrast expansion (Figures 8b and 8d) the minima correspond.
Figure 7. Image processing steps and respective histograms. (a)
Original image; (b) After the Non-Local Means filter; (c) After
edge enhancement.
Figure 8. Effect of contrast expansion: (a, c) before contrast expansion histogram minima do not match; (b, d) after expansion the minima match.
The next step was segmentation by a threshold16, in which the image is discriminated into the solid phase (white pixels) and pores+background (black pixels), creating a binary image. The choice of intensity threshold is one of the main sources of uncertainty and there is no general method to select it. Thus, it is common to select two threshold values from the observation of the image and its histogram, and use these values as uncertainty limits. This is shown in Figures 9b and 9c for intensity thresholds 125 and 145, respectively, resulting in two extreme values for the porosity.
Figure 9. (a) Magnified region of the original image; (b) Segmentation: Threshold = 125, Porosity = 19,27%; (c) Segmentation: Threshold = 145, Porosity = 26,02%.
Several post-processing steps were necessary, which, in the case of the present work, aimed at discriminating between open and closed pores.
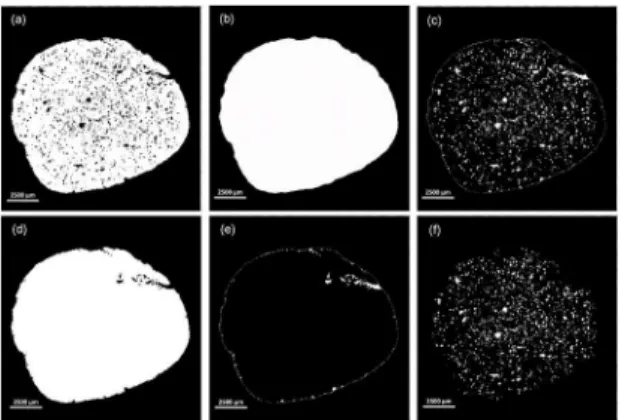
To detect open pores, one must first establish the surface of the object - connected pores necessarily touch this surface. In this step the function "ROI Shrink Wrap" was applied to the segmented image of each 2D layer. This function allows creating a border following exactly the edge of the object. However, open pores can be mixed up with irregularities and depressions in the surface, which typically have a much larger radius. The edge created so far can be adjusted to consider these features through the parameter called "Stretch Over Holes", providing a maximum radius for the holes to be considered as pores. This parameter was optimized by trial and error and a radius of 100 pixels was used. The result is shown in Figure 10b, for instance, in which the rough edge of the pellet was detected. In turn, this allows obtaining all pores (both open and closed), as shown in Figure 10c, with a logical operation between the images in Figures 10a and 10b.
To discriminate between open and closed pores, a function that eliminates individual black objects surrounded by white pixels in 3D was used. Applying this function to Figure 10a creates the image shown in Figure 10d, in which only dark objects connected to the surface are visible in black. Then, a logical operation was applied between Figures 10b and 10d, resulting in the open pores only (Figure 10e). Finally, to obtain the closed pores, a logical difference was performed between the total pore and open pore images, and the result is shown in Figure 10f.
Open and closed pores can be rendered in 3D as shown in Figure 12, in which open and closed pores are shown in green and red, respectively.
Figure 10. Pore discrimination for the 0.4X lens images: (a) Segmentation of the solid phase; (b) ROI tracing the object border, stretching over holes; (c) Total pores; (d) After eliminating individual black objects surrounded by white pixels in 3D (e) Open pores; (f) Closed pores.
Figure 11. Pore discrimination for the 4X lens images: (a) Segmentation of the solid phase; (b) ROI tracing the object border, stretching over holes; (c) Total pores; (d) After eliminating individual black objects surrounded by white pixels in 3D (e) Open pores; (f) Closed pores.
Figures 10 and 11 depict the post-processing steps on 2D images, corresponding to a layer of the 3D image. This is done for simplicity, but one must be aware that certain image features cannot be directly extrapolated from 2D to 3D. For instance, closed 2D pores as shown in Figures 10a and 11a may actually connect to the surface in 3D. Thus, the function to eliminate internal pores, that leads to Figures 10d and 11d, was applied in 3D space.
Equations 1 and 2 show the expressions for volume fraction of open and closed porosities.
(1)
(2) %Open Pores O P( . .)=Volume of ROIVolume of O P. .
% ( . .)
( . .)
. .
Closed Pores C P
Volume of ROI Volume of O P
Volume of C P
=
-Figure 12. 3D models (open pores in green and closed pores in red): (a) 0.4X; (b) 4X.
Figure 13. MIP analyzes: (a) 1st stage; (b) 2nd stage.
3.2 Mercury intrusion porosimetry
The results of the 1st and 2nd stages of the MIP analyzes are shown in Figure 13.
Based on the curves in Figure 13, the mean pore diameter and the percolation diameter are between 8-11 µm for the first stage samples and 7-9 µm for the second stage samples. This result led to the choice of image resolution in the microCT analysis, as described above.
3.3 Optical microscopy
3.3.1 Image processing and analysis
Once the two images (microCT and OM) of each sample had been selected, the image processing step was performed:
stage, since the microCT analysis was not performed on whole pellets and consequently it was extremely difficult to find reference points that corresponded to a microCT layer.
3.4 Comparison between techniques
3.4.1 MicroCT x MIP
Figures 15a, 15b and 15c show a comparison of porosity values obtained by microCT and MIP, for 0.4X-8µm, 4X-4µm and 0.4X-4µm, respectively.
Figure 14. Processed images: (a) OM; (b) Segmentation-microCT; (c) ROI-OM; (d) ROI-Segmentation-microCT; (e) Pores-OM; (f) Pores-microCT.
For the microCT images, the Non-Local Means filter and the edge enhancement filter were applied, while for the OM images only the edge enhancement filter was needed as their noise level was very low. Then, both images were segmented to create the respective binary images composed of the solid phase (white pixels) and the pores and background (black pixels) - see Figure 14a and 14b.
The “ROI Shrink Wrap” function was applied to both images to create a region of interest. As the number of pixels of the OM image was much greater than that of the microCT image, the "Stretch Over Holes" parameter was adjusted with different values so that the regions and the closed holes were the same (Figure 14c and 14d). Finally, the pores and cracks were detected with a binary difference operator (Figure 14e and 14f).
OM analyzes were only made for the set of pellets from the 1st stage. It was not possible to find the microCT layers corresponding to the OM images for the samples of the 2nd
Figure 15. Comparison of porosities: microCT x MIP: (a) 0.4X-8µm; (b) 4X-4µm; (c) 0.4X-4µm.
porosity values obtained with the 0.4X lens were very low compared to the MIP technique. Figures 15b and 15c show an improvement for the 4µm resolution images obtained with the 4X and 0.4X lenses.
The analyzes with the 4X lens covered an internal cylindrical region of the pellet, so all pores on the surface of this cylinder and all those connected to them are considered open pores. However, since these open pores were artificially generated they do not actually represent the open porosity of the sample. Although the values given by MIP and microCT were closer, the region analyzed may not be representative due to the small volume of the sample and because this volume corresponds to the center of the pellet, which is usually more porous.
The microCT porosity values for the 0.4X-4µm images were still much lower than those of the MIP technique. In this analysis, the open porosity of the samples was also artificially generated by the MIP methodology, since again the surface of the region under analysis does not necessarily correspond to the actual surface of the pellet.
Another factor that affects microCT porosity measurements is the segmentation threshold of the images. The error bars of the microCT analysis in Figure 15 show the impact of the choice of threshold in determining the porosity, as mentioned above (see Figure 9). The associated uncertainty is even greater in the quantification of open porosity, because by increasing the segmentation threshold, more pixels of other tones are included in the segmented phase and more connections are created until they reach the surface, and are therefore considered open pores.
One of the advantages of the microCT porosity characterization is the quantification of the porosity that is treated as closed porosity, which can affect the quality of the pellet in terms of its physical resistance and that is not quantified by the MIP technique. The proposed methodology was able to detect closed pores in all samples.
3.4.2 MicroCT x OM
The comparison between the microCT and OM porosity results are shown in Figure 16.
The results of porosity by microCT were lower than by OM, again due to the poorer resolution of the microCT technique. The error bars show that the segmentation threshold has a greater impact in the microCT images due to the poorer resolution.
On the other hand, the preparation of the OM samples can generate or increase pores and cracks in the samples that are not original features of the material. This was observed in some of the samples.
Figure 16. Comparison of porosity: microCT x OM.
4. Conclusion
This work proposed a method to characterize the porosity of iron ore pellets through the processing and analysis of images acquired by X-ray microtomography. The results of the technique were compared to the classical techniques of mercury intrusion porosimetry and optical microscopy.
As expected, due to the limited spatial resolution of the technique, the values measured from microCT images were much lower than with MIP or OM. As the microCT resolution improved, either through the use of lenses or optimized source-sample-detector geometry, these values came closer together. However, improved resolution implied in an increase of acquisition time, which is also an important limitation to be considered.
However, microCT showed some relevant advantages that can be explored. The technique is non-destructive and requires no specimen preparation. It provides results of both open and closed porosity. It also offers a useful 3D visualization of the spatial distribution of pores. Furthermore, it reveals the presence of both internal and external cracks, that can be related to thermal and mechanical stresses to which the pellet was submitted.
Thus, microCT is able to reveal a lot of previously inaccessible information that can improve the properties and design of iron ore pellets. In addition, green pellets, that is, pellets that have not yet passed the firing stage, have almost no physical resistance and cannot be analyzed by destructive techniques. MicroCT is an important choice for porosity analysis of such pellets, and it can also be used to control the production steps of these materials.
new range that can serve as a reference for future 3D analysis of pellets. As long as the microCT resolution reveals the main pore population peak, and correlations between the measured porosities and related parameters are identified, it might become a new "standard".
To become a practical alternative to OM and MIP, microCT will also need to become a faster technique. Even taking into account the time spent in MIP experiments and specimen preparation for OM, microCT with acceptable resolution is still much slower. New approaches such as algebraic reconstruction techniques17 that do not require as many projections as the conventional Filtered Back Propagation18 method are a promising alternative that will be explored in future works.
5. Acknowledgements
The authors would like to thank Alei Leite Alcântara Domingues, from Vale for providing the material for this work and for the OM and MIP analyzes, and CNPq, CAPES, FINEP and FAPERJ, Brazilian agencies, for financial support.
6. References
1. Meyer K. Pelletizing of Iron Ores. Berlin, Heidelberg: Springer-Verlag; 1980.
2. Klobes P, Meyer K, Munro RG. Porosity and specific surface area measurements for solid materials. Washington: National Institute of Standards and Technology; 2006.
3. Amziane S, Collet F, eds. Bio-aggregates Based Building Materials. State-of-the-Art Report of the RILEM Technical Committee 236-BBM. New York: Springer; 2017.
4. Aligizaki KK. Pore Structure of cement-based materials - Testing, Interpretation and Requirements. New York: Taylor & Francis; 2006.
5. Castellanos RM, Alvarez Iglezias JC, Augusto KS, Domingues
ALA, Paciornik S. Optimization of the Characterization of Iron
Ore Pellets by Image Analysis. In: 25º Congresso Brasileiro de Microscopia; 2015 Jun 7-10; Armação dos Búzios, RJ, Brazil. p. 3-4.
6. Landis EN, Keane DT. X-ray microtomography. Materials Characterization. 2010;61(12):1305-1316.
7. Bhuiyan IU, Mouzon J, Forsberg F, Forsmo SPE, Sjödahl M, Hedlund J. Consideration of X-ray microtomography to quantitatively determine the size distribution of bubble cavities in iron ore pellets. Powder Technology. 2013;233:312-318.
8. Forsberg F, Hjortsberg E. X-ray microtomography for sequential imaging and analysis of iron ore pellets under reduction. In: 13th ABM Iron Ore Symposium ; 2012 Oct 14-18; Rio de Janeiro, RJ, Brazil.
9. Shatokha V, Korobeynikov I, Maire E. On the Application of 3D X-Ray Microtomography for Studies in the Field of Iron Ore Sintering Technology. In: Shatokha V. Sintering - Methods and Products. Rijeka: InTech; 2012.
10. Zong Y, Yu X, Zhu M, Lu S. Characterizing soil pore structure
using nitrogen adsorption, mercury intrusion porosimetry, and synchrotron-radiation-based X-ray computed microtomography techniques. Journal of Soils and Sediments. 2015;15(2):302-312.
11. Cnudde V, Cwirzen A, Masschaele B, Jacobs PJS. Porosity and microstructure characterization of building stones and concretes. Engineering Geology. 2009;103(3-4):76-83.
12. Schindelin J, Arganda-Carreras I, Frise E, Kaynig V, Longair M,
Pietzsch T, et al. Fiji: an open-source platform for biological-image analysis. Nature Methods. 2012;9(7):676-682.
13. Paciornik S, Mauricio MHP. Digital Imaging. In: ASM Handbook: Metallography and Microstructures. Volume 9. Materials Park: ASM International; 2004. p. 368-402.
14. Buades A, Coll B, Morel JM. Non-Local Means Denoising.
Image Processing On Line. 2011;1:208-212.
15. Soille P. Toggle Contrast. In: Soille P. Morphological Image Analysis - Principles and applications. New York: Springer; 2004. p. 259.
16. Gonzales RC, Woods RE. Image Segmentation. In: Gonzales
RC, Woods RE. Digital Image Processing. New Jersey: Pearson Prentice Hall; 2008. p. 689-787.
17. Batenburg KJ, Sijbers J. DART: A Practical Reconstruction Algorithm for Discrete Tomography. IEEE Transactions on Image Processing. 2011;20(9):2542-2553.